
Fish Oil Market By Grade(Feed Grade Fish Oil, Food Grade Fish Oil), By Process(Crude Fish Oil, Refined Fish Oil), By Product(Anchovy Oil, Salmon Oil, Others), By End User(Aqua-feed, Food & Beverages, Dietary Supplements), By Sales Channel(Offline Sales Channel, Online Sales Channel), By Region And Companies - Industry Segment Outlook, Market Assessment, Competition Scenario, Trends, And Forecast 2024-2033
-
23451
-
Jan 2024
-
156
-


-
This report was compiled by Shreyas Rokade Shreyas Rokade is a seasoned Research Analyst with CMFE, bringing extensive expertise in market research and consulting, with a strong background in Chemical Engineering. Correspondence Team Lead-CMFE Linkedin | Detailed Market research Methodology Our methodology involves a mix of primary research, including interviews with leading mental health experts, and secondary research from reputable medical journals and databases. View Detailed Methodology Page
-
Quick Navigation
- Fish Oil Market Size, Share, Trends Analysis
- Fish Oil Market Dynamics
- Fish Oil Market Segmentation Analysis
- Fish Oil Industry Segments
- Fish Oil Market Growth Opportunity
- Fish Oil Market Regional Analysis
- Fish Oil Industry By Region
- Fish Oil Market Share Analysis
- Fish Oil Industry Key Players
- Fish Oil Market Recent Development
- Report Scope
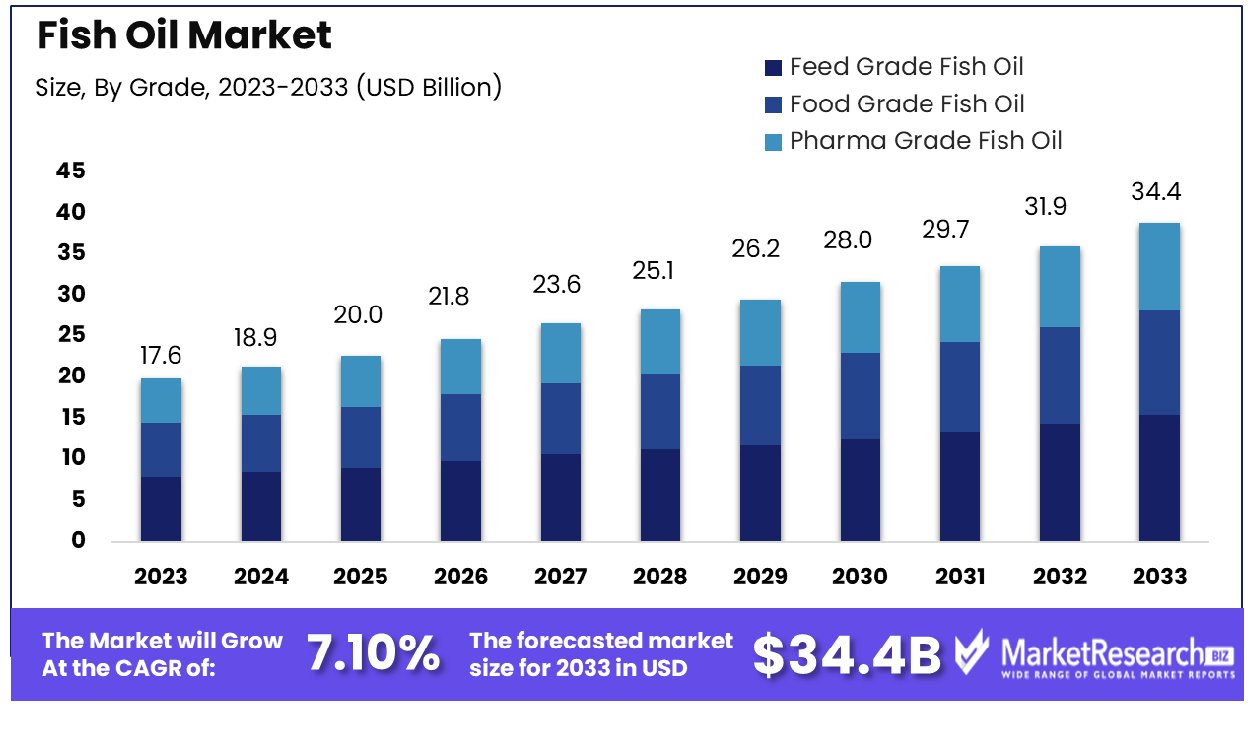
The fish oil market was valued at USD 17.6 billion in 2023. It is expected to reach USD 34.4 billion by 2033, with a CAGR of 7.10% during the forecast period from 2024 to 2033.
The surge in demand for healthier dietary habits and changes in customer preferences are some of the main key factors for the fish oil market. The oil extracted by fish comes from tissues of fatty fish such as mackerel, salmon, and tuna. The method of processing comprises putting pressure on cooked fish and then separating oil from the derived liquid. Researchers believe that the intake of fish oil will decrease cardio-related issues. Fish and other seafood packaging are an exceptional source of long-chain omega-3s -3s and medical researchers also thought that the decreasing rate of heart disease was because of the omega-3s in fatty fish.
A report published by Cardiac Interventions in December 2023, highlights that Ischemic heart disease is the main cause of worldwide CVD mortality, with an age-standardized rate per 100,000 of 108.8 deaths, followed by intracerebral hemorrhage and ischemic stroke. Moreover, according to a report published by Centres for Disease Control and Prevention in May 2023, highlights that In the USA, every 40 seconds a person suffers from a heart attack. Each year more than 805,000 people in the US have heart attacks. Out of these, 605,000 people undergo with first heart attack and 200,000 individuals already have heart attack. There are about 1 out of 5 individuals who have silent heart attacks, the damage is already done but the concerned people are not aware of it.
Similarly, an article published by PCR online in September 2023, emphasizes that more than around 620 million people have heart and circulatory diseases across the globe. Each year around 60 million individuals all across the globe have a heart or circulatory disease. Worldwide it is anticipated that 1 in 13 people are living with a heart or circulatory disease.
The abundant presence of omega-3s in fish oil aids in enhancing heart health. Many researchers suggest that the intake of fish and other seafood is part of a balanced food diet. Fish oil supplements have low triglyceride levels and help in decreasing the risk of heart attack or stroke. The proof is that omega-3 supplements enhance heart health and help people who have heart disease.
Not only this, fish oil also helps regulate blood pressure, enhances cognitive functions, lessens rheumatoid arthritis, and also helps in improving eyesight and vision. Fish oil is also used in skincare for decreasing skin aging, promoting brighter skin, and avoiding hormonal acne. The demand for fish oil will rapidly increase due to the various advantages that it provides in healthcare as well as in personal skincare, which will help in market expansion during the forecast period.
Fish Oil Market Dynamics
Health Awareness Elevates Fish Oil Market
The increasing recognition among consumers regarding the significance of health and wellness is fueling the growth of the fish oils market. The core of this trend lies in the recognized health benefits of omega-3 fatty acids, particularly EPA and DHA, found abundantly in fish oil. These nutrients, endorsed by the American Heart Association for their cardiovascular benefits, have spurred consumer demand. Major retailers like CVS and Amazon report growing fish oil sales, reflecting this trend. The knowledge about omega-3s' role in reducing cardiovascular events has made fish oil supplements a staple in health-conscious diets.
Nutritional Supplement Industry's Expansion Boosts Fish Oil Sales
The supplements market. Projected to grow at a CAGR of 8% through 2026, this upsurge provides a significant tailwind for fish oil products. Fish oil, as a vital component of the supplement sector, benefits from the overall industry's growth trajectory. This trend is not isolated but intertwined with rising health awareness and evolving consumer preferences toward natural and preventive healthcare solutions.
Aquaculture Growth Sustains Fish Oil Supply
With global aquaculture production reaching unprecedented levels and projected to account for 55% of total fish production by 2032, the demand for fish oil as a key feed ingredient is escalating. Dominated by Asia, particularly China, this sector's rapid growth necessitates substantial inputs of fishmeal and oil. The sustained growth in aquaculture is poised to have lasting implications on the fish oil industry, potentially ensuring a steady demand for years to come.
Pet Health Focus Stimulates Fish Oil Market
The increasing emphasis on pet health, particularly in Europe and the U.S., is a significant driver for the fish oil market. With over 80% of pet owners prioritizing their pets' health, fish oil has become a sought-after supplement, valued for its benefits to pets' skin and coats. The U.S. pet supplement market, projected to reach $2 billion by 2025, underscores this trend.
Commoditization and Price Competition Dampen Fish Oil Market Expansion
This surge has intensified price competition, significantly eroding profit margins for manufacturers. The presence of private label store brands exacerbates this trend by offering lower-priced alternatives, compelling other brands to reduce their prices to remain competitive. This market dynamic leads to a race to the bottom in terms of pricing, diminishing the overall profitability of the sector and potentially compromising product quality as manufacturers seek cost-cutting measures to maintain their market presence.
Stringent Regulations Impede Fish Oil Market Growth
The fish oil industry is tightly regulated, with stringent quality control measures imposed by organizations such as the Global Organization for EPA and DHA Omega-3s (GOED) and NSF International. Compliance with these regulations adds layers of complexity and cost to the production process. For instance, obtaining pharmaceutical-grade certification for fish oil products entails substantial expenses, contributing to higher production costs.
Fish Oil Market Segmentation Analysis
By Grade Analysis
Feed Grade Fish Oil is the most popular segment of the market for fish oil. The primary reason is the massive market for fish oil that is used in aquaculture and feed for livestock where it can be used to enhance the growth, development, and overall health of animal feed. Feed-grade fish oil is rich in omega-3 fatty acids, which are essential for the health of aquatic animals, particularly species like salmon, trout, and carp.
Food Grade Fish Oil and Pharma Grade Fish Oil also have substantial market share. Food-grade fish oil is used in cooking and food preparation, while pharma-grade fish oil is used in pharmaceuticals due to its high purity and concentration of beneficial omega-3 fatty acids. Yet, the apex demand in the aquaculture sector illustrates the growing impact on Feed feed-grade fish Oil.
By Product Analysis
Anchovy Oil is the dominant product of the market for fish oil with a 32.5% part. Anchovy oil is highly valued for its high content of omega-3 fatty acids, particularly EPA and DHA, making it a preferred choice for aquafeed and dietary supplements. The anchovy fishery stands as one of the world's largest and most sustainable, ensuring a reliable source of premium fish oil.
Salmon Oil is experiencing faster growth due to its popularity in dietary supplements and health foods. Tuna Oil, Cod Liver Oil, Sardine Oil, Squalene Oil, Krill Oil, Menhaden Oil, and others also contribute to the market. Each of these oils has unique properties and applications, but the widespread availability and high omega-3 content of Anchovy Oil make it the market leader.
By End User Analysis
Aqua-feed stands out as the primary consumer segment within the fish oil market. This segment delves into the utilization of fish oil in the diets of various aquatic organisms, including crustaceans, Cyprinids, eels, marine fish such as salmon and trout, and Tilapia. Essential fatty acids offered in fish oils are vital to the growth and health of these species in the water which makes it a crucial ingredient in aqua-feed.
The Food & Beverages, Dietary Supplements, and Cosmetic & herbal Beauty Products sectors also significantly use fish oil. In dietary supplements, fish oil is valued for its health benefits, while in cosmetics, it's used for its skin-nourishing properties.
By Sales Channel Analysis
Offline Sales Channel is the most popular sales channel in the market for fish oil with a 59.5% share. This channel includes supermarkets/hypermarkets, departmental stores, convenience stores, and other retail outlets. Customers' ability to examine in person a vast range of products made from fish oil in retail stores is an essential factor in the massive online sales.
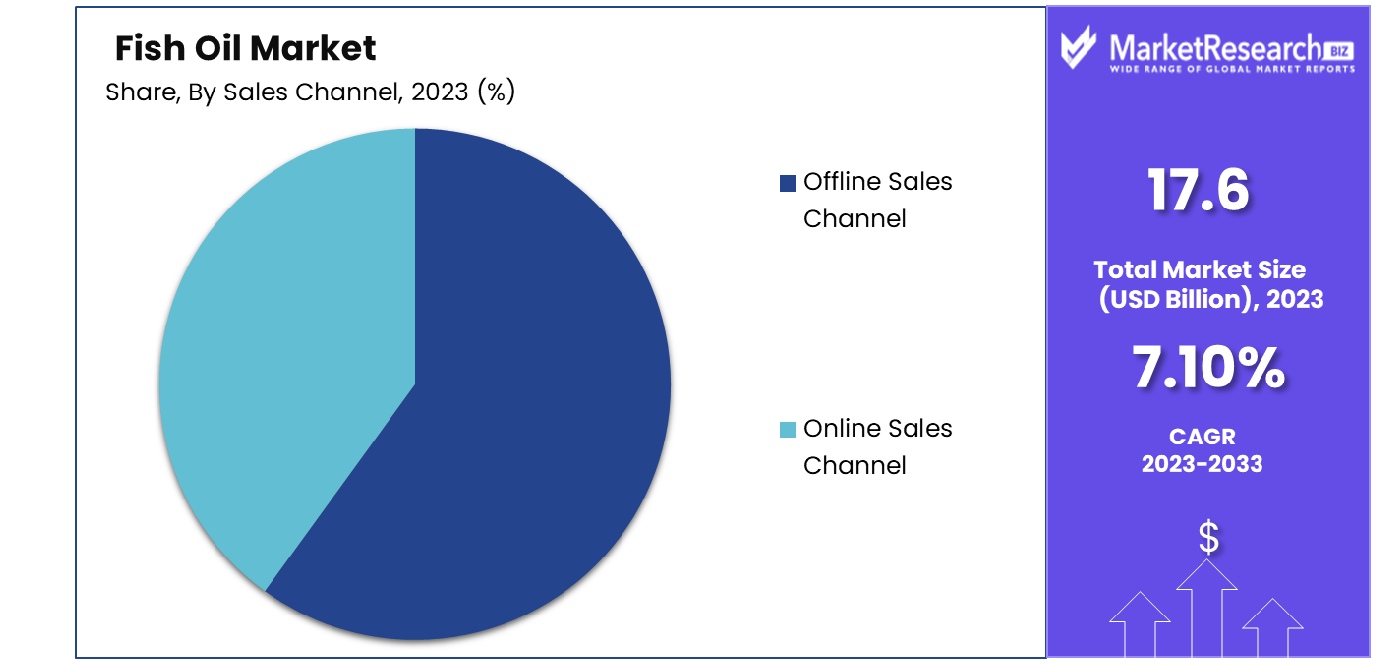
The Online Sales Channel, comprising company websites and e-commerce platforms, is also growing. Online channels offer convenience, a wide selection, and often competitive pricing. However, the enduring presence and popularity of physical stores when it comes to purchasing food and health items ensure that Offline Sales Channel Offline Sales Channel at the top of the sales for fish oil.
Fish Oil Industry Segments
By Grade
- Feed Grade Fish Oil
- Food Grade Fish Oil
- Pharma Grade Fish Oil
By Process
- Crude Fish Oil
- Refined Fish Oil
- Modified Fish Oil
By Product
- Anchovy Oil
- Salmon Oil
- Tuna Oil
- Cod Liver Oil
- Sardine Oil
- Squalene Oil
- Krill Oil
- Menhaden Oil
- Others
By End User
- Aqua-feed [Crustaceans, Eels, Cyprinids, Marine Fish, Salmon & Trout, Tilapias]
- Food & Beverages
- Dietary Supplements
- Cosmetic & Beauty Products
By Sales Channel
- Offline Sales Channel [Supermarkets/Hypermarkets, Departmental Stores, Convenience Store, Other Sales Channel]
- Online Sales Channel [Company Website, E-commerce Platform]
Fish Oil Market Growth Opportunity
Sustainability Focus: A Key Differentiator in the Fish Oil Market
The critical state of global fish stocks, with 87% being either overexploited or fully exploited, presents a unique opportunity for growth in the fish oil market through a focus on sustainability. Consumers are increasingly concerned about overfishing and environmental impact, leading to higher demand for sustainably sourced products.
Major Companies can capitalize on this by obtaining certifications like Friend of the Sea, as seen with Wiley's Finest wild-caught fish oil. Highlighting sustainable practices and responsible sourcing can help key companies gain consumer trust and stand out in a crowded market, driving growth and fostering a more sustainable industry.
Leveraging E-commerce Channels: Expanding the Fish Oil Market Reach
The growing trend of online vitamin and supplement sales, with 77% of US sales occurring on platforms like Amazon, offers a significant expansion opportunity for the fish oil market. Direct-to-consumer (DTC) healthcare, which includes a broad range of products like nutraceuticals, is a rapidly growing industry, currently valued at around $700 billion. By adopting DTC models and leveraging e-commerce channels, fish oil brands can reduce overhead and distribution costs, enhance customer engagement, and build loyalty. Companies like PureLabel Nutrition are leading the way with subscription-based DTC models, demonstrating the potential of online sales in expanding market reach.
New Delivery Formats: Innovating Fish Oil Consumption
The introduction of new delivery formats for fish oil, such as powdered and flavored options, opens up new market opportunities, appealing to consumers who are averse to traditional capsules. The development of child-friendly formats like flavored gummies, exemplified by Nature's Dynamics, addresses the needs of younger demographics and expands the consumer base. Innovations like the conversion of omega-3 oils into stabilized fine powders by Dynamic Extractions and Formulations (DEF) demonstrate the versatility of fish oil products.
Fish Oil Market Regional Analysis
Asia-Pacific Dominates with 34.30% Market Share in Fish Oil Market
Asia-Pacific's dominance in the fish oil market, holding a 34.30% share, is significantly influenced by its lead in global aquaculture production. China, a pivotal country in the region, accounts for 57.8% of the global aquaculture output which is a significant contribution to the global fish oil market. This dominance is supported by the region's extensive coastline, favorable climate for aquaculture, and high fish consumption rates.
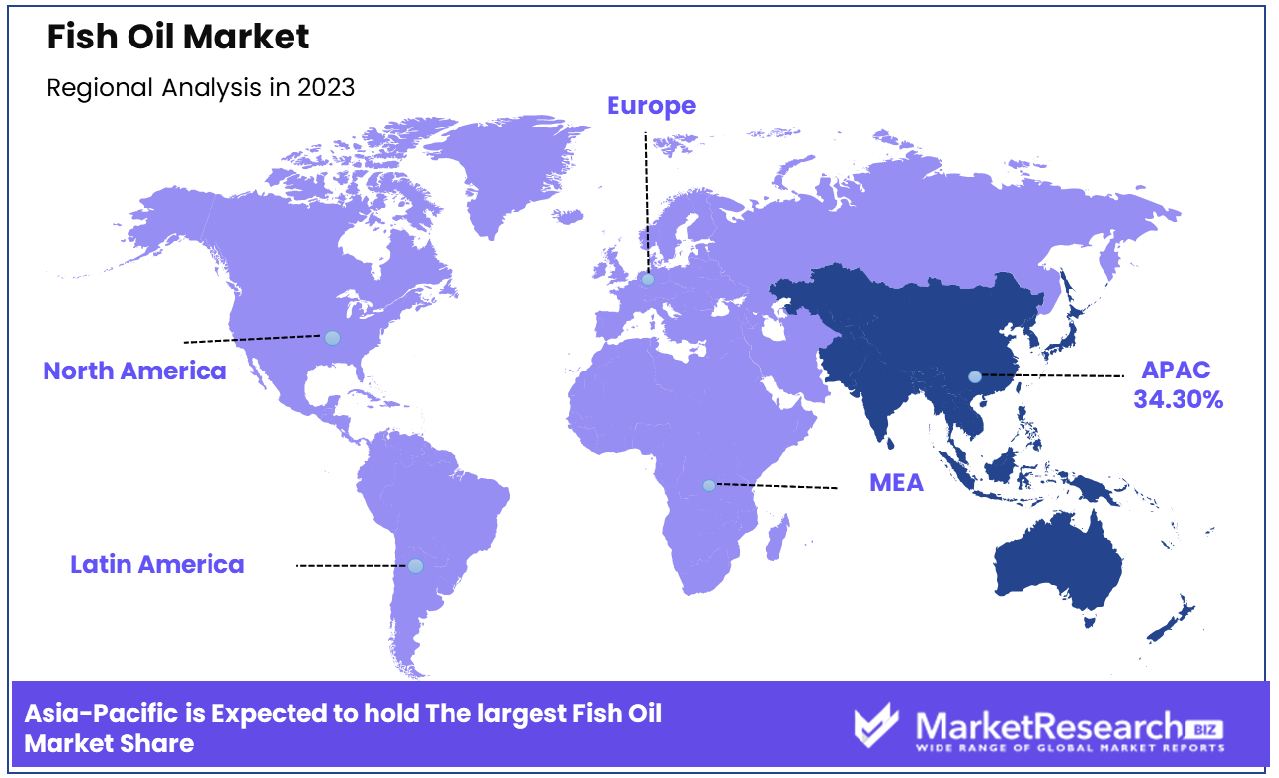
The market for fish oil in Asia-Pacific is driven through a mix of traditional fishing methods as well as modern aquaculture practices. The region's diverse aquatic ecosystems contribute to a wide variety of fish species, which are key raw materials for fish oil production. Furthermore, the increasing acknowledgment of the health advantages associated with omega-3 acids found in fish oil is driving consumer demand throughout the region.
Europe: Advanced Processing Technology and Sustainability Focus
Europe’s fish oil market is driven by advanced processing technology and a strong focus on sustainability in fishing practices. Countries like Norway and Iceland are significant contributors, known for their high-quality fish oil products. The region’s stringent regulations on sustainable fishing and ethical sourcing play a crucial role in market dynamics.
North America: Growing Health Consciousness and Diverse Applications
The North American fish oil market is flourishing, aided by an increasing awareness among consumers of the benefits of health and the many uses of the oil. The United States, ranking 17th in aquaculture production, with marine aquaculture accounting for 7% of its total domestic seafood production, contributes to the region’s market share.
Fish Oil Industry By Region
North America
- The US
- Canada
- Rest of North America
Europe
- Germany
- France
- The UK
- Spain
- Italy
- Russia
- Netherlands
- Rest of Europe
Asia-Pacific
- China
- Japan
- South Korea
- India
- New Zealand
- Singapore
- Thailand
- Vietnam
- Rest of Asia Pacific
Latin America
- Brazil
- Mexico
- Rest of Latin America
Middle East & Africa
- South Africa
- Saudi Arabia
- UAE
- Rest of Middle East & Africa
The Fish Oil Market, is an area of vital importance to its health benefits as well as industry applications. The listed companies play a key role in shaping the global demand and supply dynamics. TripleNine Group A/S and FMC Corporation are significant players, known for their large-scale fish oil production. They play a crucial role in meeting the global demand, particularly for Omega-3 fatty acids, which are essential for human health.
Pesquera Diamante S.A., Croda International PLC, and Omega Protein Corporation are key in providing fish oil for dietary supplements and pharmaceutical applications. Their strategic focus on product purity and sustainability significantly influences consumer preferences and market trends.
Fish Oil Industry Key Players
- Marvesa Holding N.V.
- Pesquera Diamante S.A.
- Foodcorp Chile S.A (Austevoll Seafood ASA)
- DSF
- FMC Corporation
- Pelagia AS
- TripleNine Group A/S
- Croda International PLC
- Omega Protein Corporation
- OLVEA Fish Oils (OLVEA)
- Camanchaca
- China Fishery Group Limited
- Corpesca S.A.
- Oceana Group Limited
- Colpex International
- FF Skagen A/S
- Pesquera Exalmar
- Copeinca AS
- BASF SE
- DSM
- Koninklijke DSM N.V.
Fish Oil Market Recent Development
- In 2023, The IFFO released its latest analysis of market trends in marine ingredients, for the period January-July 2023. The numbers reflect a drop in catches around the world, the IFFO says, with both fishmeal and fish oil production lagging behind last year's levels. During the first seven months of 2023, total fishmeal production had fallen by around 31% compared with July 2022, while global fish oil production had dropped 30%.
- In 2023, Peru, which produces 20 percent of the global fish oil supply, canceled its first-season anchovy harvest, due to a lack of mature fish. Producing omega-3 fatty acids in Camelina may represent a way to enable a predictable supply of high-quality omega-3 oils to meet the global demand for EPA and DHA.
- In June 2022, Halozyme Therapeutics, Inc. announced the commercial launch of TLANDO (testosterone undecanoate), an oral treatment indicated for testosterone replacement therapy in adult males for conditions associated with a deficiency or absence of endogenous testosterone.
- In February 2022, Pfizer Inc. and OPKO Health, Inc. announced that the European Commission has granted marketing authorization for the next-generation long-acting recombinant human growth hormone NGENLA, a once-weekly injection to treat children and adolescents from 3 years of age with growth disturbance due to insufficient secretion of growth hormone.
Report Scope
Report Features Description Market Value (2023) USD 17.63 Billion Forecast Revenue (2033) USD 34.4 Billion CAGR (2024-2032) 7.10% Base Year for Estimation 2023 Historic Period 2016-2023 Forecast Period 2024-2033 Report Coverage Revenue Forecast, Market Dynamics, COVID-19 Impact, Competitive Landscape, Recent Developments Segments Covered By Grade(Feed Grade Fish Oil, Food Grade Fish Oil, Pharma Grade Fish Oil), By Process(Crude Fish Oil, Refined Fish Oil, Modified Fish Oil), By Product(Anchovy Oil, Salmon Oil, Tuna Oil, Cod Liver Oil, Sardine Oil, Squalene Oil, Krill Oil, Menhaden Oil, Others), By End User(Aqua-feed [Crustaceans, Eels, Cyprinids, Marine Fish, Salmon & Trout, Tilapias], Food & Beverages, Dietary Supplements, Cosmetic & Beauty Products), By Sales Channel(Offline Sales Channel [Supermarkets/Hypermarkets, Departmental Stores, Convenience Store, Other Sales Channel], Online Sales Channel [Company Website, E-commerce Platform]) Regional Analysis North America - The US, Canada, Rest of North America, Europe - Germany, France, The UK, Spain, Italy, Russia, Netherlands, Rest of Europe, Asia-Pacific - China, Japan, South Korea, India, New Zealand, Singapore, Thailand, Vietnam, Rest of Asia Pacific, Latin America - Brazil, Mexico, Rest of Latin America, Middle East & Africa - South Africa, Saudi Arabia, UAE, Rest of Middle East & Africa Competitive Landscape Marvesa Holding N.V., Pesquera Diamante S.A., Foodcorp Chile S.A (Austevoll Seafood ASA), DSF, FMC Corporation, Pelagia AS, TripleNine Group A/S, Croda International PLC, Omega Protein Corporation, OLVEA Fish Oils (OLVEA), Camanchaca, China Fishery Group Limited, Corpesca S.A., Oceana Group Limited, Colpex International, FF Skagen A/S, Pesquera Exalmar, Copeinca AS, BASF SE, DSM, Koninklijke DSM N.V. Customization Scope Customization for segments, region/country-level will be provided. Moreover, additional customization can be done based on the requirements. Purchase Options We have three licenses to opt for Single User License, Multi-User License (Up to 5 Users), Corporate Use License (Unlimited User and Printable PDF) -
- 1. Executive Summary
- 1.1. Definition
- 1.2. Taxonomy
- 1.3. Research Scope
- 1.4. Key Analysis
- 1.5. Key Findings by Major Segments
- 1.6. Top strategies by Major Players
- 2. Global Fish Oil Market Overview
- 2.1. Fish Oil Market Dynamics
- 2.1.1. Drivers
- 2.1.2. Opportunities
- 2.1.3. Restraints
- 2.1.4. Challenges
- 2.2. Macro-economic Factors
- 2.3. Regulatory Framework
- 2.4. Market Investment Feasibility Index
- 2.5. PEST Analysis
- 2.6. PORTER’S Five Force Analysis
- 2.7. Drivers & Restraints Impact Analysis
- 2.8. Industry Chain Analysis
- 2.9. Cost Structure Analysis
- 2.10. Marketing Strategy
- 2.11. Russia-Ukraine War Impact Analysis
- 2.12. Opportunity Map Analysis
- 2.13. Market Competition Scenario Analysis
- 2.14. Product Life Cycle Analysis
- 2.15. Opportunity Orbits
- 2.16. Manufacturer Intensity Map
- 2.17. Major Companies sales by Value & Volume
- 2.1. Fish Oil Market Dynamics
- 3. Global Fish Oil Market Analysis, Opportunity and Forecast, 2016-2032
- 3.1. Global Fish Oil Market Analysis, 2016-2021
- 3.2. Global Fish Oil Market Opportunity and Forecast, 2023-2032
- 3.3. Global Fish Oil Market Analysis, Opportunity and Forecast, By By Grade, 2016-2032
- 3.3.1. Global Fish Oil Market Analysis by By Grade: Introduction
- 3.3.2. Market Size Absolute $ Opportunity Analysis and Forecast, By By Grade, 2016-2032
- 3.3.3. Feed Grade Fish Oil
- 3.3.4. Food Grade Fish Oil
- 3.3.5. Pharma Grade Fish Oil
- 3.4. Global Fish Oil Market Analysis, Opportunity and Forecast, By By Process, 2016-2032
- 3.4.1. Global Fish Oil Market Analysis by By Process: Introduction
- 3.4.2. Market Size Absolute $ Opportunity Analysis and Forecast, By By Process, 2016-2032
- 3.4.3. Crude Fish Oil
- 3.4.4. Refined Fish Oil
- 3.4.5. Modified Fish Oil
- 3.5. Global Fish Oil Market Analysis, Opportunity and Forecast, By By Product, 2016-2032
- 3.5.1. Global Fish Oil Market Analysis by By Product: Introduction
- 3.5.2. Market Size Absolute $ Opportunity Analysis and Forecast, By By Product, 2016-2032
- 3.5.3. Anchovy Oil
- 3.5.4. Salmon Oil
- 3.5.5. Tuna Oil
- 3.5.6. Cod Liver Oil
- 3.5.7. Sardine Oil
- 3.5.8. Squalene Oil
- 3.5.9. Krill Oil
- 3.5.10. Menhaden Oil
- 3.5.11. Others
- 3.6. Global Fish Oil Market Analysis, Opportunity and Forecast, By By End User, 2016-2032
- 3.6.1. Global Fish Oil Market Analysis by By End User: Introduction
- 3.6.2. Market Size Absolute $ Opportunity Analysis and Forecast, By By End User, 2016-2032
- 3.6.3. Aqua-feed
- 3.6.3.1. Crustaceans
- 3.6.3.2. Eels
- 3.6.3.3. Cyprinids
- 3.6.3.4. Marine Fish
- 3.6.3.5. Salmon & Trout, Tilapias
- 3.6.4. Food & Beverages
- 3.6.5. Dietary Supplements
- 3.6.6. Cosmetic & Beauty Products
- 3.7. Global Fish Oil Market Analysis, Opportunity and Forecast, By By Sales Channel, 2016-2032
- 3.7.1. Global Fish Oil Market Analysis by By Sales Channel: Introduction
- 3.7.2. Market Size Absolute $ Opportunity Analysis and Forecast, By By Sales Channel, 2016-2032
- 3.7.3. Offline Sales Channel
- 3.7.3.1. Supermarkets/Hypermarkets
- 3.7.3.2. Departmental Stores
- 3.7.3.3. Convenience Store
- 3.7.3.4. Other Sales Channel
- 3.7.4. Online Sales Channel
- 3.7.4.1. Company Website
- 3.7.4.2. E-commerce Platform
- 4. North America Fish Oil Market Analysis, Opportunity and Forecast, 2016-2032
- 4.1. North America Fish Oil Market Analysis, 2016-2021
- 4.2. North America Fish Oil Market Opportunity and Forecast, 2023-2032
- 4.3. North America Fish Oil Market Analysis, Opportunity and Forecast, By By Grade, 2016-2032
- 4.3.1. North America Fish Oil Market Analysis by By Grade: Introduction
- 4.3.2. Market Size Absolute $ Opportunity Analysis and Forecast, By By Grade, 2016-2032
- 4.3.3. Feed Grade Fish Oil
- 4.3.4. Food Grade Fish Oil
- 4.3.5. Pharma Grade Fish Oil
- 4.4. North America Fish Oil Market Analysis, Opportunity and Forecast, By By Process, 2016-2032
- 4.4.1. North America Fish Oil Market Analysis by By Process: Introduction
- 4.4.2. Market Size Absolute $ Opportunity Analysis and Forecast, By By Process, 2016-2032
- 4.4.3. Crude Fish Oil
- 4.4.4. Refined Fish Oil
- 4.4.5. Modified Fish Oil
- 4.5. North America Fish Oil Market Analysis, Opportunity and Forecast, By By Product, 2016-2032
- 4.5.1. North America Fish Oil Market Analysis by By Product: Introduction
- 4.5.2. Market Size Absolute $ Opportunity Analysis and Forecast, By By Product, 2016-2032
- 4.5.3. Anchovy Oil
- 4.5.4. Salmon Oil
- 4.5.5. Tuna Oil
- 4.5.6. Cod Liver Oil
- 4.5.7. Sardine Oil
- 4.5.8. Squalene Oil
- 4.5.9. Krill Oil
- 4.5.10. Menhaden Oil
- 4.5.11. Others
- 4.6. North America Fish Oil Market Analysis, Opportunity and Forecast, By By End User, 2016-2032
- 4.6.1. North America Fish Oil Market Analysis by By End User: Introduction
- 4.6.2. Market Size Absolute $ Opportunity Analysis and Forecast, By By End User, 2016-2032
- 4.6.3. Aqua-feed
- 4.6.3.1. Crustaceans
- 4.6.3.2. Eels
- 4.6.3.3. Cyprinids
- 4.6.3.4. Marine Fish
- 4.6.3.5. Salmon & Trout, Tilapias
- 4.6.4. Food & Beverages
- 4.6.5. Dietary Supplements
- 4.6.6. Cosmetic & Beauty Products
- 4.7. North America Fish Oil Market Analysis, Opportunity and Forecast, By By Sales Channel, 2016-2032
- 4.7.1. North America Fish Oil Market Analysis by By Sales Channel: Introduction
- 4.7.2. Market Size Absolute $ Opportunity Analysis and Forecast, By By Sales Channel, 2016-2032
- 4.7.3. Offline Sales Channel
- 4.7.3.1. Supermarkets/Hypermarkets
- 4.7.3.2. Departmental Stores
- 4.7.3.3. Convenience Store
- 4.7.3.4. Other Sales Channel
- 4.7.4. Online Sales Channel
- 4.7.4.1. Company Website
- 4.7.4.2. E-commerce Platform
- 4.8. North America Fish Oil Market Analysis, Opportunity and Forecast, By Country , 2016-2032
- 4.8.1. North America Fish Oil Market Analysis by Country : Introduction
- 4.8.2. Market Size Absolute $ Opportunity Analysis and Forecast, Country , 2016-2032
- 4.8.2.1. The US
- 4.8.2.2. Canada
- 4.8.2.3. Mexico
- 5. Western Europe Fish Oil Market Analysis, Opportunity and Forecast, 2016-2032
- 5.1. Western Europe Fish Oil Market Analysis, 2016-2021
- 5.2. Western Europe Fish Oil Market Opportunity and Forecast, 2023-2032
- 5.3. Western Europe Fish Oil Market Analysis, Opportunity and Forecast, By By Grade, 2016-2032
- 5.3.1. Western Europe Fish Oil Market Analysis by By Grade: Introduction
- 5.3.2. Market Size Absolute $ Opportunity Analysis and Forecast, By By Grade, 2016-2032
- 5.3.3. Feed Grade Fish Oil
- 5.3.4. Food Grade Fish Oil
- 5.3.5. Pharma Grade Fish Oil
- 5.4. Western Europe Fish Oil Market Analysis, Opportunity and Forecast, By By Process, 2016-2032
- 5.4.1. Western Europe Fish Oil Market Analysis by By Process: Introduction
- 5.4.2. Market Size Absolute $ Opportunity Analysis and Forecast, By By Process, 2016-2032
- 5.4.3. Crude Fish Oil
- 5.4.4. Refined Fish Oil
- 5.4.5. Modified Fish Oil
- 5.5. Western Europe Fish Oil Market Analysis, Opportunity and Forecast, By By Product, 2016-2032
- 5.5.1. Western Europe Fish Oil Market Analysis by By Product: Introduction
- 5.5.2. Market Size Absolute $ Opportunity Analysis and Forecast, By By Product, 2016-2032
- 5.5.3. Anchovy Oil
- 5.5.4. Salmon Oil
- 5.5.5. Tuna Oil
- 5.5.6. Cod Liver Oil
- 5.5.7. Sardine Oil
- 5.5.8. Squalene Oil
- 5.5.9. Krill Oil
- 5.5.10. Menhaden Oil
- 5.5.11. Others
- 5.6. Western Europe Fish Oil Market Analysis, Opportunity and Forecast, By By End User, 2016-2032
- 5.6.1. Western Europe Fish Oil Market Analysis by By End User: Introduction
- 5.6.2. Market Size Absolute $ Opportunity Analysis and Forecast, By By End User, 2016-2032
- 5.6.3. Aqua-feed
- 5.6.3.1. Crustaceans
- 5.6.3.2. Eels
- 5.6.3.3. Cyprinids
- 5.6.3.4. Marine Fish
- 5.6.3.5. Salmon & Trout, Tilapias
- 5.6.4. Food & Beverages
- 5.6.5. Dietary Supplements
- 5.6.6. Cosmetic & Beauty Products
- 5.7. Western Europe Fish Oil Market Analysis, Opportunity and Forecast, By By Sales Channel, 2016-2032
- 5.7.1. Western Europe Fish Oil Market Analysis by By Sales Channel: Introduction
- 5.7.2. Market Size Absolute $ Opportunity Analysis and Forecast, By By Sales Channel, 2016-2032
- 5.7.3. Offline Sales Channel
- 5.7.3.1. Supermarkets/Hypermarkets
- 5.7.3.2. Departmental Stores
- 5.7.3.3. Convenience Store
- 5.7.3.4. Other Sales Channel
- 5.7.4. Online Sales Channel
- 5.7.4.1. Company Website
- 5.7.4.2. E-commerce Platform
- 5.8. Western Europe Fish Oil Market Analysis, Opportunity and Forecast, By Country , 2016-2032
- 5.8.1. Western Europe Fish Oil Market Analysis by Country : Introduction
- 5.8.2. Market Size Absolute $ Opportunity Analysis and Forecast, Country , 2016-2032
- 5.8.2.1. Germany
- 5.8.2.2. France
- 5.8.2.3. The UK
- 5.8.2.4. Spain
- 5.8.2.5. Italy
- 5.8.2.6. Portugal
- 5.8.2.7. Ireland
- 5.8.2.8. Austria
- 5.8.2.9. Switzerland
- 5.8.2.10. Benelux
- 5.8.2.11. Nordic
- 5.8.2.12. Rest of Western Europe
- 6. Eastern Europe Fish Oil Market Analysis, Opportunity and Forecast, 2016-2032
- 6.1. Eastern Europe Fish Oil Market Analysis, 2016-2021
- 6.2. Eastern Europe Fish Oil Market Opportunity and Forecast, 2023-2032
- 6.3. Eastern Europe Fish Oil Market Analysis, Opportunity and Forecast, By By Grade, 2016-2032
- 6.3.1. Eastern Europe Fish Oil Market Analysis by By Grade: Introduction
- 6.3.2. Market Size Absolute $ Opportunity Analysis and Forecast, By By Grade, 2016-2032
- 6.3.3. Feed Grade Fish Oil
- 6.3.4. Food Grade Fish Oil
- 6.3.5. Pharma Grade Fish Oil
- 6.4. Eastern Europe Fish Oil Market Analysis, Opportunity and Forecast, By By Process, 2016-2032
- 6.4.1. Eastern Europe Fish Oil Market Analysis by By Process: Introduction
- 6.4.2. Market Size Absolute $ Opportunity Analysis and Forecast, By By Process, 2016-2032
- 6.4.3. Crude Fish Oil
- 6.4.4. Refined Fish Oil
- 6.4.5. Modified Fish Oil
- 6.5. Eastern Europe Fish Oil Market Analysis, Opportunity and Forecast, By By Product, 2016-2032
- 6.5.1. Eastern Europe Fish Oil Market Analysis by By Product: Introduction
- 6.5.2. Market Size Absolute $ Opportunity Analysis and Forecast, By By Product, 2016-2032
- 6.5.3. Anchovy Oil
- 6.5.4. Salmon Oil
- 6.5.5. Tuna Oil
- 6.5.6. Cod Liver Oil
- 6.5.7. Sardine Oil
- 6.5.8. Squalene Oil
- 6.5.9. Krill Oil
- 6.5.10. Menhaden Oil
- 6.5.11. Others
- 6.6. Eastern Europe Fish Oil Market Analysis, Opportunity and Forecast, By By End User, 2016-2032
- 6.6.1. Eastern Europe Fish Oil Market Analysis by By End User: Introduction
- 6.6.2. Market Size Absolute $ Opportunity Analysis and Forecast, By By End User, 2016-2032
- 6.6.3. Aqua-feed
- 6.6.3.1. Crustaceans
- 6.6.3.2. Eels
- 6.6.3.3. Cyprinids
- 6.6.3.4. Marine Fish
- 6.6.3.5. Salmon & Trout, Tilapias
- 6.6.4. Food & Beverages
- 6.6.5. Dietary Supplements
- 6.6.6. Cosmetic & Beauty Products
- 6.7. Eastern Europe Fish Oil Market Analysis, Opportunity and Forecast, By By Sales Channel, 2016-2032
- 6.7.1. Eastern Europe Fish Oil Market Analysis by By Sales Channel: Introduction
- 6.7.2. Market Size Absolute $ Opportunity Analysis and Forecast, By By Sales Channel, 2016-2032
- 6.7.3. Offline Sales Channel
- 6.7.3.1. Supermarkets/Hypermarkets
- 6.7.3.2. Departmental Stores
- 6.7.3.3. Convenience Store
- 6.7.3.4. Other Sales Channel
- 6.7.4. Online Sales Channel
- 6.7.4.1. Company Website
- 6.7.4.2. E-commerce Platform
- 6.8. Eastern Europe Fish Oil Market Analysis, Opportunity and Forecast, By Country , 2016-2032
- 6.8.1. Eastern Europe Fish Oil Market Analysis by Country : Introduction
- 6.8.2. Market Size Absolute $ Opportunity Analysis and Forecast, Country , 2016-2032
- 6.8.2.1. Russia
- 6.8.2.2. Poland
- 6.8.2.3. The Czech Republic
- 6.8.2.4. Greece
- 6.8.2.5. Rest of Eastern Europe
- 7. APAC Fish Oil Market Analysis, Opportunity and Forecast, 2016-2032
- 7.1. APAC Fish Oil Market Analysis, 2016-2021
- 7.2. APAC Fish Oil Market Opportunity and Forecast, 2023-2032
- 7.3. APAC Fish Oil Market Analysis, Opportunity and Forecast, By By Grade, 2016-2032
- 7.3.1. APAC Fish Oil Market Analysis by By Grade: Introduction
- 7.3.2. Market Size Absolute $ Opportunity Analysis and Forecast, By By Grade, 2016-2032
- 7.3.3. Feed Grade Fish Oil
- 7.3.4. Food Grade Fish Oil
- 7.3.5. Pharma Grade Fish Oil
- 7.4. APAC Fish Oil Market Analysis, Opportunity and Forecast, By By Process, 2016-2032
- 7.4.1. APAC Fish Oil Market Analysis by By Process: Introduction
- 7.4.2. Market Size Absolute $ Opportunity Analysis and Forecast, By By Process, 2016-2032
- 7.4.3. Crude Fish Oil
- 7.4.4. Refined Fish Oil
- 7.4.5. Modified Fish Oil
- 7.5. APAC Fish Oil Market Analysis, Opportunity and Forecast, By By Product, 2016-2032
- 7.5.1. APAC Fish Oil Market Analysis by By Product: Introduction
- 7.5.2. Market Size Absolute $ Opportunity Analysis and Forecast, By By Product, 2016-2032
- 7.5.3. Anchovy Oil
- 7.5.4. Salmon Oil
- 7.5.5. Tuna Oil
- 7.5.6. Cod Liver Oil
- 7.5.7. Sardine Oil
- 7.5.8. Squalene Oil
- 7.5.9. Krill Oil
- 7.5.10. Menhaden Oil
- 7.5.11. Others
- 7.6. APAC Fish Oil Market Analysis, Opportunity and Forecast, By By End User, 2016-2032
- 7.6.1. APAC Fish Oil Market Analysis by By End User: Introduction
- 7.6.2. Market Size Absolute $ Opportunity Analysis and Forecast, By By End User, 2016-2032
- 7.6.3. Aqua-feed
- 7.6.3.1. Crustaceans
- 7.6.3.2. Eels
- 7.6.3.3. Cyprinids
- 7.6.3.4. Marine Fish
- 7.6.3.5. Salmon & Trout, Tilapias
- 7.6.4. Food & Beverages
- 7.6.5. Dietary Supplements
- 7.6.6. Cosmetic & Beauty Products
- 7.7. APAC Fish Oil Market Analysis, Opportunity and Forecast, By By Sales Channel, 2016-2032
- 7.7.1. APAC Fish Oil Market Analysis by By Sales Channel: Introduction
- 7.7.2. Market Size Absolute $ Opportunity Analysis and Forecast, By By Sales Channel, 2016-2032
- 7.7.3. Offline Sales Channel
- 7.7.3.1. Supermarkets/Hypermarkets
- 7.7.3.2. Departmental Stores
- 7.7.3.3. Convenience Store
- 7.7.3.4. Other Sales Channel
- 7.7.4. Online Sales Channel
- 7.7.4.1. Company Website
- 7.7.4.2. E-commerce Platform
- 7.8. APAC Fish Oil Market Analysis, Opportunity and Forecast, By Country , 2016-2032
- 7.8.1. APAC Fish Oil Market Analysis by Country : Introduction
- 7.8.2. Market Size Absolute $ Opportunity Analysis and Forecast, Country , 2016-2032
- 7.8.2.1. China
- 7.8.2.2. Japan
- 7.8.2.3. South Korea
- 7.8.2.4. India
- 7.8.2.5. Australia & New Zeland
- 7.8.2.6. Indonesia
- 7.8.2.7. Malaysia
- 7.8.2.8. Philippines
- 7.8.2.9. Singapore
- 7.8.2.10. Thailand
- 7.8.2.11. Vietnam
- 7.8.2.12. Rest of APAC
- 8. Latin America Fish Oil Market Analysis, Opportunity and Forecast, 2016-2032
- 8.1. Latin America Fish Oil Market Analysis, 2016-2021
- 8.2. Latin America Fish Oil Market Opportunity and Forecast, 2023-2032
- 8.3. Latin America Fish Oil Market Analysis, Opportunity and Forecast, By By Grade, 2016-2032
- 8.3.1. Latin America Fish Oil Market Analysis by By Grade: Introduction
- 8.3.2. Market Size Absolute $ Opportunity Analysis and Forecast, By By Grade, 2016-2032
- 8.3.3. Feed Grade Fish Oil
- 8.3.4. Food Grade Fish Oil
- 8.3.5. Pharma Grade Fish Oil
- 8.4. Latin America Fish Oil Market Analysis, Opportunity and Forecast, By By Process, 2016-2032
- 8.4.1. Latin America Fish Oil Market Analysis by By Process: Introduction
- 8.4.2. Market Size Absolute $ Opportunity Analysis and Forecast, By By Process, 2016-2032
- 8.4.3. Crude Fish Oil
- 8.4.4. Refined Fish Oil
- 8.4.5. Modified Fish Oil
- 8.5. Latin America Fish Oil Market Analysis, Opportunity and Forecast, By By Product, 2016-2032
- 8.5.1. Latin America Fish Oil Market Analysis by By Product: Introduction
- 8.5.2. Market Size Absolute $ Opportunity Analysis and Forecast, By By Product, 2016-2032
- 8.5.3. Anchovy Oil
- 8.5.4. Salmon Oil
- 8.5.5. Tuna Oil
- 8.5.6. Cod Liver Oil
- 8.5.7. Sardine Oil
- 8.5.8. Squalene Oil
- 8.5.9. Krill Oil
- 8.5.10. Menhaden Oil
- 8.5.11. Others
- 8.6. Latin America Fish Oil Market Analysis, Opportunity and Forecast, By By End User, 2016-2032
- 8.6.1. Latin America Fish Oil Market Analysis by By End User: Introduction
- 8.6.2. Market Size Absolute $ Opportunity Analysis and Forecast, By By End User, 2016-2032
- 8.6.3. Aqua-feed
- 8.6.3.1. Crustaceans
- 8.6.3.2. Eels
- 8.6.3.3. Cyprinids
- 8.6.3.4. Marine Fish
- 8.6.3.5. Salmon & Trout, Tilapias
- 8.6.4. Food & Beverages
- 8.6.5. Dietary Supplements
- 8.6.6. Cosmetic & Beauty Products
- 8.7. Latin America Fish Oil Market Analysis, Opportunity and Forecast, By By Sales Channel, 2016-2032
- 8.7.1. Latin America Fish Oil Market Analysis by By Sales Channel: Introduction
- 8.7.2. Market Size Absolute $ Opportunity Analysis and Forecast, By By Sales Channel, 2016-2032
- 8.7.3. Offline Sales Channel
- 8.7.3.1. Supermarkets/Hypermarkets
- 8.7.3.2. Departmental Stores
- 8.7.3.3. Convenience Store
- 8.7.3.4. Other Sales Channel
- 8.7.4. Online Sales Channel
- 8.7.4.1. Company Website
- 8.7.4.2. E-commerce Platform
- 8.8. Latin America Fish Oil Market Analysis, Opportunity and Forecast, By Country , 2016-2032
- 8.8.1. Latin America Fish Oil Market Analysis by Country : Introduction
- 8.8.2. Market Size Absolute $ Opportunity Analysis and Forecast, Country , 2016-2032
- 8.8.2.1. Brazil
- 8.8.2.2. Colombia
- 8.8.2.3. Chile
- 8.8.2.4. Argentina
- 8.8.2.5. Costa Rica
- 8.8.2.6. Rest of Latin America
- 9. Middle East & Africa Fish Oil Market Analysis, Opportunity and Forecast, 2016-2032
- 9.1. Middle East & Africa Fish Oil Market Analysis, 2016-2021
- 9.2. Middle East & Africa Fish Oil Market Opportunity and Forecast, 2023-2032
- 9.3. Middle East & Africa Fish Oil Market Analysis, Opportunity and Forecast, By By Grade, 2016-2032
- 9.3.1. Middle East & Africa Fish Oil Market Analysis by By Grade: Introduction
- 9.3.2. Market Size Absolute $ Opportunity Analysis and Forecast, By By Grade, 2016-2032
- 9.3.3. Feed Grade Fish Oil
- 9.3.4. Food Grade Fish Oil
- 9.3.5. Pharma Grade Fish Oil
- 9.4. Middle East & Africa Fish Oil Market Analysis, Opportunity and Forecast, By By Process, 2016-2032
- 9.4.1. Middle East & Africa Fish Oil Market Analysis by By Process: Introduction
- 9.4.2. Market Size Absolute $ Opportunity Analysis and Forecast, By By Process, 2016-2032
- 9.4.3. Crude Fish Oil
- 9.4.4. Refined Fish Oil
- 9.4.5. Modified Fish Oil
- 9.5. Middle East & Africa Fish Oil Market Analysis, Opportunity and Forecast, By By Product, 2016-2032
- 9.5.1. Middle East & Africa Fish Oil Market Analysis by By Product: Introduction
- 9.5.2. Market Size Absolute $ Opportunity Analysis and Forecast, By By Product, 2016-2032
- 9.5.3. Anchovy Oil
- 9.5.4. Salmon Oil
- 9.5.5. Tuna Oil
- 9.5.6. Cod Liver Oil
- 9.5.7. Sardine Oil
- 9.5.8. Squalene Oil
- 9.5.9. Krill Oil
- 9.5.10. Menhaden Oil
- 9.5.11. Others
- 9.6. Middle East & Africa Fish Oil Market Analysis, Opportunity and Forecast, By By End User, 2016-2032
- 9.6.1. Middle East & Africa Fish Oil Market Analysis by By End User: Introduction
- 9.6.2. Market Size Absolute $ Opportunity Analysis and Forecast, By By End User, 2016-2032
- 9.6.3. Aqua-feed
- 9.6.3.1. Crustaceans
- 9.6.3.2. Eels
- 9.6.3.3. Cyprinids
- 9.6.3.4. Marine Fish
- 9.6.3.5. Salmon & Trout, Tilapias
- 9.6.4. Food & Beverages
- 9.6.5. Dietary Supplements
- 9.6.6. Cosmetic & Beauty Products
- 9.7. Middle East & Africa Fish Oil Market Analysis, Opportunity and Forecast, By By Sales Channel, 2016-2032
- 9.7.1. Middle East & Africa Fish Oil Market Analysis by By Sales Channel: Introduction
- 9.7.2. Market Size Absolute $ Opportunity Analysis and Forecast, By By Sales Channel, 2016-2032
- 9.7.3. Offline Sales Channel
- 9.7.3.1. Supermarkets/Hypermarkets
- 9.7.3.2. Departmental Stores
- 9.7.3.3. Convenience Store
- 9.7.3.4. Other Sales Channel
- 9.7.4. Online Sales Channel
- 9.7.4.1. Company Website
- 9.7.4.2. E-commerce Platform
- 9.8. Middle East & Africa Fish Oil Market Analysis, Opportunity and Forecast, By Country , 2016-2032
- 9.8.1. Middle East & Africa Fish Oil Market Analysis by Country : Introduction
- 9.8.2. Market Size Absolute $ Opportunity Analysis and Forecast, Country , 2016-2032
- 9.8.2.1. Algeria
- 9.8.2.2. Egypt
- 9.8.2.3. Israel
- 9.8.2.4. Kuwait
- 9.8.2.5. Nigeria
- 9.8.2.6. Saudi Arabia
- 9.8.2.7. South Africa
- 9.8.2.8. Turkey
- 9.8.2.9. The UAE
- 9.8.2.10. Rest of MEA
- 10. Global Fish Oil Market Analysis, Opportunity and Forecast, By Region , 2016-2032
- 10.1. Global Fish Oil Market Analysis by Region : Introduction
- 10.2. Market Size Absolute $ Opportunity Analysis and Forecast, By Region , 2016-2032
- 10.2.1. North America
- 10.2.2. Western Europe
- 10.2.3. Eastern Europe
- 10.2.4. APAC
- 10.2.5. Latin America
- 10.2.6. Middle East & Africa
- 11. Global Fish Oil Market Competitive Landscape, Market Share Analysis, and Company Profiles
- 11.1. Market Share Analysis
- 11.2. Company Profiles
- 11.3. Marvesa Holding N.V.
- 11.3.1. Company Overview
- 11.3.2. Financial Highlights
- 11.3.3. Product Portfolio
- 11.3.4. SWOT Analysis
- 11.3.5. Key Strategies and Developments
- 11.4. Pesquera Diamante S.A.
- 11.4.1. Company Overview
- 11.4.2. Financial Highlights
- 11.4.3. Product Portfolio
- 11.4.4. SWOT Analysis
- 11.4.5. Key Strategies and Developments
- 11.5. Foodcorp Chile S.A (Austevoll Seafood ASA)
- 11.5.1. Company Overview
- 11.5.2. Financial Highlights
- 11.5.3. Product Portfolio
- 11.5.4. SWOT Analysis
- 11.5.5. Key Strategies and Developments
- 11.6. DSF
- 11.6.1. Company Overview
- 11.6.2. Financial Highlights
- 11.6.3. Product Portfolio
- 11.6.4. SWOT Analysis
- 11.6.5. Key Strategies and Developments
- 11.7. FMC Corporation
- 11.7.1. Company Overview
- 11.7.2. Financial Highlights
- 11.7.3. Product Portfolio
- 11.7.4. SWOT Analysis
- 11.7.5. Key Strategies and Developments
- 11.8. Pelagia AS
- 11.8.1. Company Overview
- 11.8.2. Financial Highlights
- 11.8.3. Product Portfolio
- 11.8.4. SWOT Analysis
- 11.8.5. Key Strategies and Developments
- 11.9. TripleNine Group A/S
- 11.9.1. Company Overview
- 11.9.2. Financial Highlights
- 11.9.3. Product Portfolio
- 11.9.4. SWOT Analysis
- 11.9.5. Key Strategies and Developments
- 11.10. Croda International PLC
- 11.10.1. Company Overview
- 11.10.2. Financial Highlights
- 11.10.3. Product Portfolio
- 11.10.4. SWOT Analysis
- 11.10.5. Key Strategies and Developments
- 11.11. Omega Protein Corporation
- 11.11.1. Company Overview
- 11.11.2. Financial Highlights
- 11.11.3. Product Portfolio
- 11.11.4. SWOT Analysis
- 11.11.5. Key Strategies and Developments
- 11.12. OLVEA Fish Oils (OLVEA)
- 11.12.1. Company Overview
- 11.12.2. Financial Highlights
- 11.12.3. Product Portfolio
- 11.12.4. SWOT Analysis
- 11.12.5. Key Strategies and Developments
- 11.13.1. Company Overview
- 11.13.2. Financial Highlights
- 11.13.3. Product Portfolio
- 11.13.4. SWOT Analysis
- 11.13.5. Key Strategies and Developments
- 11.14. Camanchaca
- 11.14.1. Company Overview
- 11.14.2. Financial Highlights
- 11.14.3. Product Portfolio
- 11.14.4. SWOT Analysis
- 11.14.5. Key Strategies and Developments
- 11.15. Corpesca S.A.
- 11.15.1. Company Overview
- 11.15.2. Financial Highlights
- 11.15.3. Product Portfolio
- 11.15.4. SWOT Analysis
- 11.15.5. Key Strategies and Developments
- 11.16. Oceana Group Limited
- 11.16.1. Company Overview
- 11.16.2. Financial Highlights
- 11.16.3. Product Portfolio
- 11.16.4. SWOT Analysis
- 11.16.5. Key Strategies and Developments
- 11.17. Colpex International
- 11.17.1. Company Overview
- 11.17.2. Financial Highlights
- 11.17.3. Product Portfolio
- 11.17.4. SWOT Analysis
- 11.17.5. Key Strategies and Developments
- 11.18. FF Skagen A/S
- 11.18.1. Company Overview
- 11.18.2. Financial Highlights
- 11.18.3. Product Portfolio
- 11.18.4. SWOT Analysis
- 11.18.5. Key Strategies and Developments
- 11.19. Pesquera Exalmar
- 11.19.1. Company Overview
- 11.19.2. Financial Highlights
- 11.19.3. Product Portfolio
- 11.19.4. SWOT Analysis
- 11.19.5. Key Strategies and Developments
- 11.20. Copeinca AS
- 11.20.1. Company Overview
- 11.20.2. Financial Highlights
- 11.20.3. Product Portfolio
- 11.20.4. SWOT Analysis
- 11.20.5. Key Strategies and Developments
- 11.21. BASF SE
- 11.21.1. Company Overview
- 11.21.2. Financial Highlights
- 11.21.3. Product Portfolio
- 11.21.4. SWOT Analysis
- 11.21.5. Key Strategies and Developments
- 11.22. DSM
- 11.22.1. Company Overview
- 11.22.2. Financial Highlights
- 11.22.3. Product Portfolio
- 11.22.4. SWOT Analysis
- 11.22.5. Key Strategies and Developments
- 12. Assumptions and Acronyms
- 13. Research Methodology
- 14. Contact
"
- List of Figures
- "
- Figure 1: Global Fish Oil Market Revenue (US$ Mn) Market Share by By Grade in 2022
- Figure 2: Global Fish Oil Market Market Attractiveness Analysis by By Grade, 2016-2032
- Figure 3: Global Fish Oil Market Revenue (US$ Mn) Market Share by By Processin 2022
- Figure 4: Global Fish Oil Market Market Attractiveness Analysis by By Process, 2016-2032
- Figure 5: Global Fish Oil Market Revenue (US$ Mn) Market Share by By Productin 2022
- Figure 6: Global Fish Oil Market Market Attractiveness Analysis by By Product, 2016-2032
- Figure 7: Global Fish Oil Market Revenue (US$ Mn) Market Share by By End Userin 2022
- Figure 8: Global Fish Oil Market Market Attractiveness Analysis by By End User, 2016-2032
- Figure 9: Global Fish Oil Market Revenue (US$ Mn) Market Share by By Sales Channelin 2022
- Figure 10: Global Fish Oil Market Market Attractiveness Analysis by By Sales Channel, 2016-2032
- Figure 11: Global Fish Oil Market Revenue (US$ Mn) Market Share by Region in 2022
- Figure 12: Global Fish Oil Market Market Attractiveness Analysis by Region, 2016-2032
- Figure 13: Global Fish Oil Market Market Revenue (US$ Mn) (2016-2032)
- Figure 14: Global Fish Oil Market Market Revenue (US$ Mn) Comparison by Region (2016-2032)
- Figure 15: Global Fish Oil Market Market Revenue (US$ Mn) Comparison by By Grade (2016-2032)
- Figure 16: Global Fish Oil Market Market Revenue (US$ Mn) Comparison by By Process (2016-2032)
- Figure 17: Global Fish Oil Market Market Revenue (US$ Mn) Comparison by By Product (2016-2032)
- Figure 18: Global Fish Oil Market Market Revenue (US$ Mn) Comparison by By End User (2016-2032)
- Figure 19: Global Fish Oil Market Market Revenue (US$ Mn) Comparison by By Sales Channel (2016-2032)
- Figure 20: Global Fish Oil Market Market Y-o-Y Growth Rate Comparison by Region (2016-2032)
- Figure 21: Global Fish Oil Market Market Y-o-Y Growth Rate Comparison by By Grade (2016-2032)
- Figure 22: Global Fish Oil Market Market Y-o-Y Growth Rate Comparison by By Process (2016-2032)
- Figure 23: Global Fish Oil Market Market Y-o-Y Growth Rate Comparison by By Product (2016-2032)
- Figure 24: Global Fish Oil Market Market Y-o-Y Growth Rate Comparison by By End User (2016-2032)
- Figure 25: Global Fish Oil Market Market Y-o-Y Growth Rate Comparison by By Sales Channel (2016-2032)
- Figure 26: Global Fish Oil Market Market Share Comparison by Region (2016-2032)
- Figure 27: Global Fish Oil Market Market Share Comparison by By Grade (2016-2032)
- Figure 28: Global Fish Oil Market Market Share Comparison by By Process (2016-2032)
- Figure 29: Global Fish Oil Market Market Share Comparison by By Product (2016-2032)
- Figure 30: Global Fish Oil Market Market Share Comparison by By End User (2016-2032)
- Figure 31: Global Fish Oil Market Market Share Comparison by By Sales Channel (2016-2032)
- Figure 32: North America Fish Oil Market Revenue (US$ Mn) Market Share by By Gradein 2022
- Figure 33: North America Fish Oil Market Market Attractiveness Analysis by By Grade, 2016-2032
- Figure 34: North America Fish Oil Market Revenue (US$ Mn) Market Share by By Processin 2022
- Figure 35: North America Fish Oil Market Market Attractiveness Analysis by By Process, 2016-2032
- Figure 36: North America Fish Oil Market Revenue (US$ Mn) Market Share by By Productin 2022
- Figure 37: North America Fish Oil Market Market Attractiveness Analysis by By Product, 2016-2032
- Figure 38: North America Fish Oil Market Revenue (US$ Mn) Market Share by By End Userin 2022
- Figure 39: North America Fish Oil Market Market Attractiveness Analysis by By End User, 2016-2032
- Figure 40: North America Fish Oil Market Revenue (US$ Mn) Market Share by By Sales Channelin 2022
- Figure 41: North America Fish Oil Market Market Attractiveness Analysis by By Sales Channel, 2016-2032
- Figure 42: North America Fish Oil Market Revenue (US$ Mn) Market Share by Country in 2022
- Figure 43: North America Fish Oil Market Market Attractiveness Analysis by Country, 2016-2032
- Figure 44: North America Fish Oil Market Market Revenue (US$ Mn) (2016-2032)
- Figure 45: North America Fish Oil Market Market Revenue (US$ Mn) Comparison by Country (2016-2032)
- Figure 46: North America Fish Oil Market Market Revenue (US$ Mn) Comparison by By Grade (2016-2032)
- Figure 47: North America Fish Oil Market Market Revenue (US$ Mn) Comparison by By Process (2016-2032)
- Figure 48: North America Fish Oil Market Market Revenue (US$ Mn) Comparison by By Product (2016-2032)
- Figure 49: North America Fish Oil Market Market Revenue (US$ Mn) Comparison by By End User (2016-2032)
- Figure 50: North America Fish Oil Market Market Revenue (US$ Mn) Comparison by By Sales Channel (2016-2032)
- Figure 51: North America Fish Oil Market Market Y-o-Y Growth Rate Comparison by Country (2016-2032)
- Figure 52: North America Fish Oil Market Market Y-o-Y Growth Rate Comparison by By Grade (2016-2032)
- Figure 53: North America Fish Oil Market Market Y-o-Y Growth Rate Comparison by By Process (2016-2032)
- Figure 54: North America Fish Oil Market Market Y-o-Y Growth Rate Comparison by By Product (2016-2032)
- Figure 55: North America Fish Oil Market Market Y-o-Y Growth Rate Comparison by By End User (2016-2032)
- Figure 56: North America Fish Oil Market Market Y-o-Y Growth Rate Comparison by By Sales Channel (2016-2032)
- Figure 57: North America Fish Oil Market Market Share Comparison by Country (2016-2032)
- Figure 58: North America Fish Oil Market Market Share Comparison by By Grade (2016-2032)
- Figure 59: North America Fish Oil Market Market Share Comparison by By Process (2016-2032)
- Figure 60: North America Fish Oil Market Market Share Comparison by By Product (2016-2032)
- Figure 61: North America Fish Oil Market Market Share Comparison by By End User (2016-2032)
- Figure 62: North America Fish Oil Market Market Share Comparison by By Sales Channel (2016-2032)
- Figure 63: Western Europe Fish Oil Market Revenue (US$ Mn) Market Share by By Gradein 2022
- Figure 64: Western Europe Fish Oil Market Market Attractiveness Analysis by By Grade, 2016-2032
- Figure 65: Western Europe Fish Oil Market Revenue (US$ Mn) Market Share by By Processin 2022
- Figure 66: Western Europe Fish Oil Market Market Attractiveness Analysis by By Process, 2016-2032
- Figure 67: Western Europe Fish Oil Market Revenue (US$ Mn) Market Share by By Productin 2022
- Figure 68: Western Europe Fish Oil Market Market Attractiveness Analysis by By Product, 2016-2032
- Figure 69: Western Europe Fish Oil Market Revenue (US$ Mn) Market Share by By End Userin 2022
- Figure 70: Western Europe Fish Oil Market Market Attractiveness Analysis by By End User, 2016-2032
- Figure 71: Western Europe Fish Oil Market Revenue (US$ Mn) Market Share by By Sales Channelin 2022
- Figure 72: Western Europe Fish Oil Market Market Attractiveness Analysis by By Sales Channel, 2016-2032
- Figure 73: Western Europe Fish Oil Market Revenue (US$ Mn) Market Share by Country in 2022
- Figure 74: Western Europe Fish Oil Market Market Attractiveness Analysis by Country, 2016-2032
- Figure 75: Western Europe Fish Oil Market Market Revenue (US$ Mn) (2016-2032)
- Figure 76: Western Europe Fish Oil Market Market Revenue (US$ Mn) Comparison by Country (2016-2032)
- Figure 77: Western Europe Fish Oil Market Market Revenue (US$ Mn) Comparison by By Grade (2016-2032)
- Figure 78: Western Europe Fish Oil Market Market Revenue (US$ Mn) Comparison by By Process (2016-2032)
- Figure 79: Western Europe Fish Oil Market Market Revenue (US$ Mn) Comparison by By Product (2016-2032)
- Figure 80: Western Europe Fish Oil Market Market Revenue (US$ Mn) Comparison by By End User (2016-2032)
- Figure 81: Western Europe Fish Oil Market Market Revenue (US$ Mn) Comparison by By Sales Channel (2016-2032)
- Figure 82: Western Europe Fish Oil Market Market Y-o-Y Growth Rate Comparison by Country (2016-2032)
- Figure 83: Western Europe Fish Oil Market Market Y-o-Y Growth Rate Comparison by By Grade (2016-2032)
- Figure 84: Western Europe Fish Oil Market Market Y-o-Y Growth Rate Comparison by By Process (2016-2032)
- Figure 85: Western Europe Fish Oil Market Market Y-o-Y Growth Rate Comparison by By Product (2016-2032)
- Figure 86: Western Europe Fish Oil Market Market Y-o-Y Growth Rate Comparison by By End User (2016-2032)
- Figure 87: Western Europe Fish Oil Market Market Y-o-Y Growth Rate Comparison by By Sales Channel (2016-2032)
- Figure 88: Western Europe Fish Oil Market Market Share Comparison by Country (2016-2032)
- Figure 89: Western Europe Fish Oil Market Market Share Comparison by By Grade (2016-2032)
- Figure 90: Western Europe Fish Oil Market Market Share Comparison by By Process (2016-2032)
- Figure 91: Western Europe Fish Oil Market Market Share Comparison by By Product (2016-2032)
- Figure 92: Western Europe Fish Oil Market Market Share Comparison by By End User (2016-2032)
- Figure 93: Western Europe Fish Oil Market Market Share Comparison by By Sales Channel (2016-2032)
- Figure 94: Eastern Europe Fish Oil Market Revenue (US$ Mn) Market Share by By Gradein 2022
- Figure 95: Eastern Europe Fish Oil Market Market Attractiveness Analysis by By Grade, 2016-2032
- Figure 96: Eastern Europe Fish Oil Market Revenue (US$ Mn) Market Share by By Processin 2022
- Figure 97: Eastern Europe Fish Oil Market Market Attractiveness Analysis by By Process, 2016-2032
- Figure 98: Eastern Europe Fish Oil Market Revenue (US$ Mn) Market Share by By Productin 2022
- Figure 99: Eastern Europe Fish Oil Market Market Attractiveness Analysis by By Product, 2016-2032
- Figure 100: Eastern Europe Fish Oil Market Revenue (US$ Mn) Market Share by By End Userin 2022
- Figure 101: Eastern Europe Fish Oil Market Market Attractiveness Analysis by By End User, 2016-2032
- Figure 102: Eastern Europe Fish Oil Market Revenue (US$ Mn) Market Share by By Sales Channelin 2022
- Figure 103: Eastern Europe Fish Oil Market Market Attractiveness Analysis by By Sales Channel, 2016-2032
- Figure 104: Eastern Europe Fish Oil Market Revenue (US$ Mn) Market Share by Country in 2022
- Figure 105: Eastern Europe Fish Oil Market Market Attractiveness Analysis by Country, 2016-2032
- Figure 106: Eastern Europe Fish Oil Market Market Revenue (US$ Mn) (2016-2032)
- Figure 107: Eastern Europe Fish Oil Market Market Revenue (US$ Mn) Comparison by Country (2016-2032)
- Figure 108: Eastern Europe Fish Oil Market Market Revenue (US$ Mn) Comparison by By Grade (2016-2032)
- Figure 109: Eastern Europe Fish Oil Market Market Revenue (US$ Mn) Comparison by By Process (2016-2032)
- Figure 110: Eastern Europe Fish Oil Market Market Revenue (US$ Mn) Comparison by By Product (2016-2032)
- Figure 111: Eastern Europe Fish Oil Market Market Revenue (US$ Mn) Comparison by By End User (2016-2032)
- Figure 112: Eastern Europe Fish Oil Market Market Revenue (US$ Mn) Comparison by By Sales Channel (2016-2032)
- Figure 113: Eastern Europe Fish Oil Market Market Y-o-Y Growth Rate Comparison by Country (2016-2032)
- Figure 114: Eastern Europe Fish Oil Market Market Y-o-Y Growth Rate Comparison by By Grade (2016-2032)
- Figure 115: Eastern Europe Fish Oil Market Market Y-o-Y Growth Rate Comparison by By Process (2016-2032)
- Figure 116: Eastern Europe Fish Oil Market Market Y-o-Y Growth Rate Comparison by By Product (2016-2032)
- Figure 117: Eastern Europe Fish Oil Market Market Y-o-Y Growth Rate Comparison by By End User (2016-2032)
- Figure 118: Eastern Europe Fish Oil Market Market Y-o-Y Growth Rate Comparison by By Sales Channel (2016-2032)
- Figure 119: Eastern Europe Fish Oil Market Market Share Comparison by Country (2016-2032)
- Figure 120: Eastern Europe Fish Oil Market Market Share Comparison by By Grade (2016-2032)
- Figure 121: Eastern Europe Fish Oil Market Market Share Comparison by By Process (2016-2032)
- Figure 122: Eastern Europe Fish Oil Market Market Share Comparison by By Product (2016-2032)
- Figure 123: Eastern Europe Fish Oil Market Market Share Comparison by By End User (2016-2032)
- Figure 124: Eastern Europe Fish Oil Market Market Share Comparison by By Sales Channel (2016-2032)
- Figure 125: APAC Fish Oil Market Revenue (US$ Mn) Market Share by By Gradein 2022
- Figure 126: APAC Fish Oil Market Market Attractiveness Analysis by By Grade, 2016-2032
- Figure 127: APAC Fish Oil Market Revenue (US$ Mn) Market Share by By Processin 2022
- Figure 128: APAC Fish Oil Market Market Attractiveness Analysis by By Process, 2016-2032
- Figure 129: APAC Fish Oil Market Revenue (US$ Mn) Market Share by By Productin 2022
- Figure 130: APAC Fish Oil Market Market Attractiveness Analysis by By Product, 2016-2032
- Figure 131: APAC Fish Oil Market Revenue (US$ Mn) Market Share by By End Userin 2022
- Figure 132: APAC Fish Oil Market Market Attractiveness Analysis by By End User, 2016-2032
- Figure 133: APAC Fish Oil Market Revenue (US$ Mn) Market Share by By Sales Channelin 2022
- Figure 134: APAC Fish Oil Market Market Attractiveness Analysis by By Sales Channel, 2016-2032
- Figure 135: APAC Fish Oil Market Revenue (US$ Mn) Market Share by Country in 2022
- Figure 136: APAC Fish Oil Market Market Attractiveness Analysis by Country, 2016-2032
- Figure 137: APAC Fish Oil Market Market Revenue (US$ Mn) (2016-2032)
- Figure 138: APAC Fish Oil Market Market Revenue (US$ Mn) Comparison by Country (2016-2032)
- Figure 139: APAC Fish Oil Market Market Revenue (US$ Mn) Comparison by By Grade (2016-2032)
- Figure 140: APAC Fish Oil Market Market Revenue (US$ Mn) Comparison by By Process (2016-2032)
- Figure 141: APAC Fish Oil Market Market Revenue (US$ Mn) Comparison by By Product (2016-2032)
- Figure 142: APAC Fish Oil Market Market Revenue (US$ Mn) Comparison by By End User (2016-2032)
- Figure 143: APAC Fish Oil Market Market Revenue (US$ Mn) Comparison by By Sales Channel (2016-2032)
- Figure 144: APAC Fish Oil Market Market Y-o-Y Growth Rate Comparison by Country (2016-2032)
- Figure 145: APAC Fish Oil Market Market Y-o-Y Growth Rate Comparison by By Grade (2016-2032)
- Figure 146: APAC Fish Oil Market Market Y-o-Y Growth Rate Comparison by By Process (2016-2032)
- Figure 147: APAC Fish Oil Market Market Y-o-Y Growth Rate Comparison by By Product (2016-2032)
- Figure 148: APAC Fish Oil Market Market Y-o-Y Growth Rate Comparison by By End User (2016-2032)
- Figure 149: APAC Fish Oil Market Market Y-o-Y Growth Rate Comparison by By Sales Channel (2016-2032)
- Figure 150: APAC Fish Oil Market Market Share Comparison by Country (2016-2032)
- Figure 151: APAC Fish Oil Market Market Share Comparison by By Grade (2016-2032)
- Figure 152: APAC Fish Oil Market Market Share Comparison by By Process (2016-2032)
- Figure 153: APAC Fish Oil Market Market Share Comparison by By Product (2016-2032)
- Figure 154: APAC Fish Oil Market Market Share Comparison by By End User (2016-2032)
- Figure 155: APAC Fish Oil Market Market Share Comparison by By Sales Channel (2016-2032)
- Figure 156: Latin America Fish Oil Market Revenue (US$ Mn) Market Share by By Gradein 2022
- Figure 157: Latin America Fish Oil Market Market Attractiveness Analysis by By Grade, 2016-2032
- Figure 158: Latin America Fish Oil Market Revenue (US$ Mn) Market Share by By Processin 2022
- Figure 159: Latin America Fish Oil Market Market Attractiveness Analysis by By Process, 2016-2032
- Figure 160: Latin America Fish Oil Market Revenue (US$ Mn) Market Share by By Productin 2022
- Figure 161: Latin America Fish Oil Market Market Attractiveness Analysis by By Product, 2016-2032
- Figure 162: Latin America Fish Oil Market Revenue (US$ Mn) Market Share by By End Userin 2022
- Figure 163: Latin America Fish Oil Market Market Attractiveness Analysis by By End User, 2016-2032
- Figure 164: Latin America Fish Oil Market Revenue (US$ Mn) Market Share by By Sales Channelin 2022
- Figure 165: Latin America Fish Oil Market Market Attractiveness Analysis by By Sales Channel, 2016-2032
- Figure 166: Latin America Fish Oil Market Revenue (US$ Mn) Market Share by Country in 2022
- Figure 167: Latin America Fish Oil Market Market Attractiveness Analysis by Country, 2016-2032
- Figure 168: Latin America Fish Oil Market Market Revenue (US$ Mn) (2016-2032)
- Figure 169: Latin America Fish Oil Market Market Revenue (US$ Mn) Comparison by Country (2016-2032)
- Figure 170: Latin America Fish Oil Market Market Revenue (US$ Mn) Comparison by By Grade (2016-2032)
- Figure 171: Latin America Fish Oil Market Market Revenue (US$ Mn) Comparison by By Process (2016-2032)
- Figure 172: Latin America Fish Oil Market Market Revenue (US$ Mn) Comparison by By Product (2016-2032)
- Figure 173: Latin America Fish Oil Market Market Revenue (US$ Mn) Comparison by By End User (2016-2032)
- Figure 174: Latin America Fish Oil Market Market Revenue (US$ Mn) Comparison by By Sales Channel (2016-2032)
- Figure 175: Latin America Fish Oil Market Market Y-o-Y Growth Rate Comparison by Country (2016-2032)
- Figure 176: Latin America Fish Oil Market Market Y-o-Y Growth Rate Comparison by By Grade (2016-2032)
- Figure 177: Latin America Fish Oil Market Market Y-o-Y Growth Rate Comparison by By Process (2016-2032)
- Figure 178: Latin America Fish Oil Market Market Y-o-Y Growth Rate Comparison by By Product (2016-2032)
- Figure 179: Latin America Fish Oil Market Market Y-o-Y Growth Rate Comparison by By End User (2016-2032)
- Figure 180: Latin America Fish Oil Market Market Y-o-Y Growth Rate Comparison by By Sales Channel (2016-2032)
- Figure 181: Latin America Fish Oil Market Market Share Comparison by Country (2016-2032)
- Figure 182: Latin America Fish Oil Market Market Share Comparison by By Grade (2016-2032)
- Figure 183: Latin America Fish Oil Market Market Share Comparison by By Process (2016-2032)
- Figure 184: Latin America Fish Oil Market Market Share Comparison by By Product (2016-2032)
- Figure 185: Latin America Fish Oil Market Market Share Comparison by By End User (2016-2032)
- Figure 186: Latin America Fish Oil Market Market Share Comparison by By Sales Channel (2016-2032)
- Figure 187: Middle East & Africa Fish Oil Market Revenue (US$ Mn) Market Share by By Gradein 2022
- Figure 188: Middle East & Africa Fish Oil Market Market Attractiveness Analysis by By Grade, 2016-2032
- Figure 189: Middle East & Africa Fish Oil Market Revenue (US$ Mn) Market Share by By Processin 2022
- Figure 190: Middle East & Africa Fish Oil Market Market Attractiveness Analysis by By Process, 2016-2032
- Figure 191: Middle East & Africa Fish Oil Market Revenue (US$ Mn) Market Share by By Productin 2022
- Figure 192: Middle East & Africa Fish Oil Market Market Attractiveness Analysis by By Product, 2016-2032
- Figure 193: Middle East & Africa Fish Oil Market Revenue (US$ Mn) Market Share by By End Userin 2022
- Figure 194: Middle East & Africa Fish Oil Market Market Attractiveness Analysis by By End User, 2016-2032
- Figure 195: Middle East & Africa Fish Oil Market Revenue (US$ Mn) Market Share by By Sales Channelin 2022
- Figure 196: Middle East & Africa Fish Oil Market Market Attractiveness Analysis by By Sales Channel, 2016-2032
- Figure 197: Middle East & Africa Fish Oil Market Revenue (US$ Mn) Market Share by Country in 2022
- Figure 198: Middle East & Africa Fish Oil Market Market Attractiveness Analysis by Country, 2016-2032
- Figure 199: Middle East & Africa Fish Oil Market Market Revenue (US$ Mn) (2016-2032)
- Figure 200: Middle East & Africa Fish Oil Market Market Revenue (US$ Mn) Comparison by Country (2016-2032)
- Figure 201: Middle East & Africa Fish Oil Market Market Revenue (US$ Mn) Comparison by By Grade (2016-2032)
- Figure 202: Middle East & Africa Fish Oil Market Market Revenue (US$ Mn) Comparison by By Process (2016-2032)
- Figure 203: Middle East & Africa Fish Oil Market Market Revenue (US$ Mn) Comparison by By Product (2016-2032)
- Figure 204: Middle East & Africa Fish Oil Market Market Revenue (US$ Mn) Comparison by By End User (2016-2032)
- Figure 205: Middle East & Africa Fish Oil Market Market Revenue (US$ Mn) Comparison by By Sales Channel (2016-2032)
- Figure 206: Middle East & Africa Fish Oil Market Market Y-o-Y Growth Rate Comparison by Country (2016-2032)
- Figure 207: Middle East & Africa Fish Oil Market Market Y-o-Y Growth Rate Comparison by By Grade (2016-2032)
- Figure 208: Middle East & Africa Fish Oil Market Market Y-o-Y Growth Rate Comparison by By Process (2016-2032)
- Figure 209: Middle East & Africa Fish Oil Market Market Y-o-Y Growth Rate Comparison by By Product (2016-2032)
- Figure 210: Middle East & Africa Fish Oil Market Market Y-o-Y Growth Rate Comparison by By End User (2016-2032)
- Figure 211: Middle East & Africa Fish Oil Market Market Y-o-Y Growth Rate Comparison by By Sales Channel (2016-2032)
- Figure 212: Middle East & Africa Fish Oil Market Market Share Comparison by Country (2016-2032)
- Figure 213: Middle East & Africa Fish Oil Market Market Share Comparison by By Grade (2016-2032)
- Figure 214: Middle East & Africa Fish Oil Market Market Share Comparison by By Process (2016-2032)
- Figure 215: Middle East & Africa Fish Oil Market Market Share Comparison by By Product (2016-2032)
- Figure 216: Middle East & Africa Fish Oil Market Market Share Comparison by By End User (2016-2032)
- Figure 217: Middle East & Africa Fish Oil Market Market Share Comparison by By Sales Channel (2016-2032)
"
- List of Tables
- "
- Table 1: Global Fish Oil Market Market Comparison by By Grade (2016-2032)
- Table 2: Global Fish Oil Market Market Comparison by By Process (2016-2032)
- Table 3: Global Fish Oil Market Market Comparison by By Product (2016-2032)
- Table 4: Global Fish Oil Market Market Comparison by By End User (2016-2032)
- Table 5: Global Fish Oil Market Market Comparison by By Sales Channel (2016-2032)
- Table 6: Global Fish Oil Market Revenue (US$ Mn) Comparison by Region (2016-2032)
- Table 7: Global Fish Oil Market Market Revenue (US$ Mn) (2016-2032)
- Table 8: Global Fish Oil Market Market Revenue (US$ Mn) Comparison by Region (2016-2032)
- Table 9: Global Fish Oil Market Market Revenue (US$ Mn) Comparison by By Grade (2016-2032)
- Table 10: Global Fish Oil Market Market Revenue (US$ Mn) Comparison by By Process (2016-2032)
- Table 11: Global Fish Oil Market Market Revenue (US$ Mn) Comparison by By Product (2016-2032)
- Table 12: Global Fish Oil Market Market Revenue (US$ Mn) Comparison by By End User (2016-2032)
- Table 13: Global Fish Oil Market Market Revenue (US$ Mn) Comparison by By Sales Channel (2016-2032)
- Table 14: Global Fish Oil Market Market Y-o-Y Growth Rate Comparison by Region (2016-2032)
- Table 15: Global Fish Oil Market Market Y-o-Y Growth Rate Comparison by By Grade (2016-2032)
- Table 16: Global Fish Oil Market Market Y-o-Y Growth Rate Comparison by By Process (2016-2032)
- Table 17: Global Fish Oil Market Market Y-o-Y Growth Rate Comparison by By Product (2016-2032)
- Table 18: Global Fish Oil Market Market Y-o-Y Growth Rate Comparison by By End User (2016-2032)
- Table 19: Global Fish Oil Market Market Y-o-Y Growth Rate Comparison by By Sales Channel (2016-2032)
- Table 20: Global Fish Oil Market Market Share Comparison by Region (2016-2032)
- Table 21: Global Fish Oil Market Market Share Comparison by By Grade (2016-2032)
- Table 22: Global Fish Oil Market Market Share Comparison by By Process (2016-2032)
- Table 23: Global Fish Oil Market Market Share Comparison by By Product (2016-2032)
- Table 24: Global Fish Oil Market Market Share Comparison by By End User (2016-2032)
- Table 25: Global Fish Oil Market Market Share Comparison by By Sales Channel (2016-2032)
- Table 26: North America Fish Oil Market Market Comparison by By Process (2016-2032)
- Table 27: North America Fish Oil Market Market Comparison by By Product (2016-2032)
- Table 28: North America Fish Oil Market Market Comparison by By End User (2016-2032)
- Table 29: North America Fish Oil Market Market Comparison by By Sales Channel (2016-2032)
- Table 30: North America Fish Oil Market Revenue (US$ Mn) Comparison by Country (2016-2032)
- Table 31: North America Fish Oil Market Market Revenue (US$ Mn) (2016-2032)
- Table 32: North America Fish Oil Market Market Revenue (US$ Mn) Comparison by Country (2016-2032)
- Table 33: North America Fish Oil Market Market Revenue (US$ Mn) Comparison by By Grade (2016-2032)
- Table 34: North America Fish Oil Market Market Revenue (US$ Mn) Comparison by By Process (2016-2032)
- Table 35: North America Fish Oil Market Market Revenue (US$ Mn) Comparison by By Product (2016-2032)
- Table 36: North America Fish Oil Market Market Revenue (US$ Mn) Comparison by By End User (2016-2032)
- Table 37: North America Fish Oil Market Market Revenue (US$ Mn) Comparison by By Sales Channel (2016-2032)
- Table 38: North America Fish Oil Market Market Y-o-Y Growth Rate Comparison by Country (2016-2032)
- Table 39: North America Fish Oil Market Market Y-o-Y Growth Rate Comparison by By Grade (2016-2032)
- Table 40: North America Fish Oil Market Market Y-o-Y Growth Rate Comparison by By Process (2016-2032)
- Table 41: North America Fish Oil Market Market Y-o-Y Growth Rate Comparison by By Product (2016-2032)
- Table 42: North America Fish Oil Market Market Y-o-Y Growth Rate Comparison by By End User (2016-2032)
- Table 43: North America Fish Oil Market Market Y-o-Y Growth Rate Comparison by By Sales Channel (2016-2032)
- Table 44: North America Fish Oil Market Market Share Comparison by Country (2016-2032)
- Table 45: North America Fish Oil Market Market Share Comparison by By Grade (2016-2032)
- Table 46: North America Fish Oil Market Market Share Comparison by By Process (2016-2032)
- Table 47: North America Fish Oil Market Market Share Comparison by By Product (2016-2032)
- Table 48: North America Fish Oil Market Market Share Comparison by By End User (2016-2032)
- Table 49: North America Fish Oil Market Market Share Comparison by By Sales Channel (2016-2032)
- Table 50: Western Europe Fish Oil Market Market Comparison by By Grade (2016-2032)
- Table 51: Western Europe Fish Oil Market Market Comparison by By Process (2016-2032)
- Table 52: Western Europe Fish Oil Market Market Comparison by By Product (2016-2032)
- Table 53: Western Europe Fish Oil Market Market Comparison by By End User (2016-2032)
- Table 54: Western Europe Fish Oil Market Market Comparison by By Sales Channel (2016-2032)
- Table 55: Western Europe Fish Oil Market Revenue (US$ Mn) Comparison by Country (2016-2032)
- Table 56: Western Europe Fish Oil Market Market Revenue (US$ Mn) (2016-2032)
- Table 57: Western Europe Fish Oil Market Market Revenue (US$ Mn) Comparison by Country (2016-2032)
- Table 58: Western Europe Fish Oil Market Market Revenue (US$ Mn) Comparison by By Grade (2016-2032)
- Table 59: Western Europe Fish Oil Market Market Revenue (US$ Mn) Comparison by By Process (2016-2032)
- Table 60: Western Europe Fish Oil Market Market Revenue (US$ Mn) Comparison by By Product (2016-2032)
- Table 61: Western Europe Fish Oil Market Market Revenue (US$ Mn) Comparison by By End User (2016-2032)
- Table 62: Western Europe Fish Oil Market Market Revenue (US$ Mn) Comparison by By Sales Channel (2016-2032)
- Table 63: Western Europe Fish Oil Market Market Y-o-Y Growth Rate Comparison by Country (2016-2032)
- Table 64: Western Europe Fish Oil Market Market Y-o-Y Growth Rate Comparison by By Grade (2016-2032)
- Table 65: Western Europe Fish Oil Market Market Y-o-Y Growth Rate Comparison by By Process (2016-2032)
- Table 66: Western Europe Fish Oil Market Market Y-o-Y Growth Rate Comparison by By Product (2016-2032)
- Table 67: Western Europe Fish Oil Market Market Y-o-Y Growth Rate Comparison by By End User (2016-2032)
- Table 68: Western Europe Fish Oil Market Market Y-o-Y Growth Rate Comparison by By Sales Channel (2016-2032)
- Table 69: Western Europe Fish Oil Market Market Share Comparison by Country (2016-2032)
- Table 70: Western Europe Fish Oil Market Market Share Comparison by By Grade (2016-2032)
- Table 71: Western Europe Fish Oil Market Market Share Comparison by By Process (2016-2032)
- Table 72: Western Europe Fish Oil Market Market Share Comparison by By Product (2016-2032)
- Table 73: Western Europe Fish Oil Market Market Share Comparison by By End User (2016-2032)
- Table 74: Western Europe Fish Oil Market Market Share Comparison by By Sales Channel (2016-2032)
- Table 75: Eastern Europe Fish Oil Market Market Comparison by By Grade (2016-2032)
- Table 76: Eastern Europe Fish Oil Market Market Comparison by By Process (2016-2032)
- Table 77: Eastern Europe Fish Oil Market Market Comparison by By Product (2016-2032)
- Table 78: Eastern Europe Fish Oil Market Market Comparison by By End User (2016-2032)
- Table 79: Eastern Europe Fish Oil Market Market Comparison by By Sales Channel (2016-2032)
- Table 80: Eastern Europe Fish Oil Market Revenue (US$ Mn) Comparison by Country (2016-2032)
- Table 81: Eastern Europe Fish Oil Market Market Revenue (US$ Mn) (2016-2032)
- Table 82: Eastern Europe Fish Oil Market Market Revenue (US$ Mn) Comparison by Country (2016-2032)
- Table 83: Eastern Europe Fish Oil Market Market Revenue (US$ Mn) Comparison by By Grade (2016-2032)
- Table 84: Eastern Europe Fish Oil Market Market Revenue (US$ Mn) Comparison by By Process (2016-2032)
- Table 85: Eastern Europe Fish Oil Market Market Revenue (US$ Mn) Comparison by By Product (2016-2032)
- Table 86: Eastern Europe Fish Oil Market Market Revenue (US$ Mn) Comparison by By End User (2016-2032)
- Table 87: Eastern Europe Fish Oil Market Market Revenue (US$ Mn) Comparison by By Sales Channel (2016-2032)
- Table 88: Eastern Europe Fish Oil Market Market Y-o-Y Growth Rate Comparison by Country (2016-2032)
- Table 89: Eastern Europe Fish Oil Market Market Y-o-Y Growth Rate Comparison by By Grade (2016-2032)
- Table 90: Eastern Europe Fish Oil Market Market Y-o-Y Growth Rate Comparison by By Process (2016-2032)
- Table 91: Eastern Europe Fish Oil Market Market Y-o-Y Growth Rate Comparison by By Product (2016-2032)
- Table 92: Eastern Europe Fish Oil Market Market Y-o-Y Growth Rate Comparison by By End User (2016-2032)
- Table 93: Eastern Europe Fish Oil Market Market Y-o-Y Growth Rate Comparison by By Sales Channel (2016-2032)
- Table 94: Eastern Europe Fish Oil Market Market Share Comparison by Country (2016-2032)
- Table 95: Eastern Europe Fish Oil Market Market Share Comparison by By Grade (2016-2032)
- Table 96: Eastern Europe Fish Oil Market Market Share Comparison by By Process (2016-2032)
- Table 97: Eastern Europe Fish Oil Market Market Share Comparison by By Product (2016-2032)
- Table 98: Eastern Europe Fish Oil Market Market Share Comparison by By End User (2016-2032)
- Table 99: Eastern Europe Fish Oil Market Market Share Comparison by By Sales Channel (2016-2032)
- Table 100: APAC Fish Oil Market Market Comparison by By Grade (2016-2032)
- Table 101: APAC Fish Oil Market Market Comparison by By Process (2016-2032)
- Table 102: APAC Fish Oil Market Market Comparison by By Product (2016-2032)
- Table 103: APAC Fish Oil Market Market Comparison by By End User (2016-2032)
- Table 104: APAC Fish Oil Market Market Comparison by By Sales Channel (2016-2032)
- Table 105: APAC Fish Oil Market Revenue (US$ Mn) Comparison by Country (2016-2032)
- Table 106: APAC Fish Oil Market Market Revenue (US$ Mn) (2016-2032)
- Table 107: APAC Fish Oil Market Market Revenue (US$ Mn) Comparison by Country (2016-2032)
- Table 108: APAC Fish Oil Market Market Revenue (US$ Mn) Comparison by By Grade (2016-2032)
- Table 109: APAC Fish Oil Market Market Revenue (US$ Mn) Comparison by By Process (2016-2032)
- Table 110: APAC Fish Oil Market Market Revenue (US$ Mn) Comparison by By Product (2016-2032)
- Table 111: APAC Fish Oil Market Market Revenue (US$ Mn) Comparison by By End User (2016-2032)
- Table 112: APAC Fish Oil Market Market Revenue (US$ Mn) Comparison by By Sales Channel (2016-2032)
- Table 113: APAC Fish Oil Market Market Y-o-Y Growth Rate Comparison by Country (2016-2032)
- Table 114: APAC Fish Oil Market Market Y-o-Y Growth Rate Comparison by By Grade (2016-2032)
- Table 115: APAC Fish Oil Market Market Y-o-Y Growth Rate Comparison by By Process (2016-2032)
- Table 116: APAC Fish Oil Market Market Y-o-Y Growth Rate Comparison by By Product (2016-2032)
- Table 117: APAC Fish Oil Market Market Y-o-Y Growth Rate Comparison by By End User (2016-2032)
- Table 118: APAC Fish Oil Market Market Y-o-Y Growth Rate Comparison by By Sales Channel (2016-2032)
- Table 119: APAC Fish Oil Market Market Share Comparison by Country (2016-2032)
- Table 120: APAC Fish Oil Market Market Share Comparison by By Grade (2016-2032)
- Table 121: APAC Fish Oil Market Market Share Comparison by By Process (2016-2032)
- Table 122: APAC Fish Oil Market Market Share Comparison by By Product (2016-2032)
- Table 123: APAC Fish Oil Market Market Share Comparison by By End User (2016-2032)
- Table 124: APAC Fish Oil Market Market Share Comparison by By Sales Channel (2016-2032)
- Table 125: Latin America Fish Oil Market Market Comparison by By Grade (2016-2032)
- Table 126: Latin America Fish Oil Market Market Comparison by By Process (2016-2032)
- Table 127: Latin America Fish Oil Market Market Comparison by By Product (2016-2032)
- Table 128: Latin America Fish Oil Market Market Comparison by By End User (2016-2032)
- Table 129: Latin America Fish Oil Market Market Comparison by By Sales Channel (2016-2032)
- Table 130: Latin America Fish Oil Market Revenue (US$ Mn) Comparison by Country (2016-2032)
- Table 131: Latin America Fish Oil Market Market Revenue (US$ Mn) (2016-2032)
- Table 132: Latin America Fish Oil Market Market Revenue (US$ Mn) Comparison by Country (2016-2032)
- Table 133: Latin America Fish Oil Market Market Revenue (US$ Mn) Comparison by By Grade (2016-2032)
- Table 134: Latin America Fish Oil Market Market Revenue (US$ Mn) Comparison by By Process (2016-2032)
- Table 135: Latin America Fish Oil Market Market Revenue (US$ Mn) Comparison by By Product (2016-2032)
- Table 136: Latin America Fish Oil Market Market Revenue (US$ Mn) Comparison by By End User (2016-2032)
- Table 137: Latin America Fish Oil Market Market Revenue (US$ Mn) Comparison by By Sales Channel (2016-2032)
- Table 138: Latin America Fish Oil Market Market Y-o-Y Growth Rate Comparison by Country (2016-2032)
- Table 139: Latin America Fish Oil Market Market Y-o-Y Growth Rate Comparison by By Grade (2016-2032)
- Table 140: Latin America Fish Oil Market Market Y-o-Y Growth Rate Comparison by By Process (2016-2032)
- Table 141: Latin America Fish Oil Market Market Y-o-Y Growth Rate Comparison by By Product (2016-2032)
- Table 142: Latin America Fish Oil Market Market Y-o-Y Growth Rate Comparison by By End User (2016-2032)
- Table 143: Latin America Fish Oil Market Market Y-o-Y Growth Rate Comparison by By Sales Channel (2016-2032)
- Table 144: Latin America Fish Oil Market Market Share Comparison by Country (2016-2032)
- Table 145: Latin America Fish Oil Market Market Share Comparison by By Grade (2016-2032)
- Table 146: Latin America Fish Oil Market Market Share Comparison by By Process (2016-2032)
- Table 147: Latin America Fish Oil Market Market Share Comparison by By Product (2016-2032)
- Table 148: Latin America Fish Oil Market Market Share Comparison by By End User (2016-2032)
- Table 149: Latin America Fish Oil Market Market Share Comparison by By Sales Channel (2016-2032)
- Table 150: Middle East & Africa Fish Oil Market Market Comparison by By Grade (2016-2032)
- Table 151: Middle East & Africa Fish Oil Market Market Comparison by By Process (2016-2032)
- Table 152: Middle East & Africa Fish Oil Market Market Comparison by By Product (2016-2032)
- Table 153: Middle East & Africa Fish Oil Market Market Comparison by By End User (2016-2032)
- Table 154: Middle East & Africa Fish Oil Market Market Comparison by By Sales Channel (2016-2032)
- Table 155: Middle East & Africa Fish Oil Market Revenue (US$ Mn) Comparison by Country (2016-2032)
- Table 156: Middle East & Africa Fish Oil Market Market Revenue (US$ Mn) (2016-2032)
- Table 157: Middle East & Africa Fish Oil Market Market Revenue (US$ Mn) Comparison by Country (2016-2032)
- Table 158: Middle East & Africa Fish Oil Market Market Revenue (US$ Mn) Comparison by By Grade (2016-2032)
- Table 159: Middle East & Africa Fish Oil Market Market Revenue (US$ Mn) Comparison by By Process (2016-2032)
- Table 160: Middle East & Africa Fish Oil Market Market Revenue (US$ Mn) Comparison by By Product (2016-2032)
- Table 161: Middle East & Africa Fish Oil Market Market Revenue (US$ Mn) Comparison by By End User (2016-2032)
- Table 162: Middle East & Africa Fish Oil Market Market Revenue (US$ Mn) Comparison by By Sales Channel (2016-2032)
- Table 163: Middle East & Africa Fish Oil Market Market Y-o-Y Growth Rate Comparison by Country (2016-2032)
- Table 164: Middle East & Africa Fish Oil Market Market Y-o-Y Growth Rate Comparison by By Grade (2016-2032)
- Table 165: Middle East & Africa Fish Oil Market Market Y-o-Y Growth Rate Comparison by By Process (2016-2032)
- Table 166: Middle East & Africa Fish Oil Market Market Y-o-Y Growth Rate Comparison by By Product (2016-2032)
- Table 167: Middle East & Africa Fish Oil Market Market Y-o-Y Growth Rate Comparison by By End User (2016-2032)
- Table 168: Middle East & Africa Fish Oil Market Market Y-o-Y Growth Rate Comparison by By Sales Channel (2016-2032)
- Table 169: Middle East & Africa Fish Oil Market Market Share Comparison by Country (2016-2032)
- Table 170: Middle East & Africa Fish Oil Market Market Share Comparison by By Grade (2016-2032)
- Table 171: Middle East & Africa Fish Oil Market Market Share Comparison by By Process (2016-2032)
- Table 172: Middle East & Africa Fish Oil Market Market Share Comparison by By Product (2016-2032)
- Table 173: Middle East & Africa Fish Oil Market Market Share Comparison by By End User (2016-2032)
- Table 174: Middle East & Africa Fish Oil Market Market Share Comparison by By Sales Channel (2016-2032)
- 1. Executive Summary
-
- Marvesa Holding N.V.
- Pesquera Diamante S.A.
- Foodcorp Chile S.A (Austevoll Seafood ASA)
- DSF
- FMC Corporation
- Pelagia AS
- TripleNine Group A/S
- Croda International PLC
- Omega Protein Corporation
- OLVEA Fish Oils (OLVEA)
- Camanchaca
- China Fishery Group Limited
- Corpesca S.A.
- Oceana Group Limited
- Colpex International
- FF Skagen A/S
- Pesquera Exalmar
- Copeinca AS
- BASF SE
- DSM
- Koninklijke DSM N.V.
Our Clients


View Our Licence Options
