
Generative AI in Telecom Market,By Component:(Software,Services), By Type:(Text-based, Image-based, Voice-based), By Deployment mode:(On-premise, Cloud), By Application:(Network Optimization, Predictive Maintenance, Improve call center operations & customer support, Personalized Product/Service Recommendations, Security & fraud detection) By Region and Companies - Industry Segment Outlook, Market Assessment, Competition Scenario, Trends, and Forecast 2024-2033
-
37812
-
July 2023
-
136
-


-
This report was compiled by Vishwa Gaul Vishwa is an experienced market research and consulting professional with over 8 years of expertise in the ICT industry, contributing to over 700 reports across telecommunications, software, hardware, and digital solutions. Correspondence Team Lead- ICT Linkedin | Detailed Market research Methodology Our methodology involves a mix of primary research, including interviews with leading mental health experts, and secondary research from reputable medical journals and databases. View Detailed Methodology Page
-
Quick Navigation
- Report Overview
- Key Takeaways
- Driving Factors
- Restraining Factors
- Generative AI in Telecom Market Segmentation Analysis
- Generative AI in Telecom Industry Segments
- Generative AI in Telecom Market Growth Opportunities
- Generative AI in Telecom Market Trending Factors
- Generative AI in Telecom Market Regional Analysis
- Generative AI in Telecom Market Competitive Analysis
- Generative AI in Telecom Industry Key Players
- Generative AI in Telecom Market Recent Development
- Report Scope
Report Overview
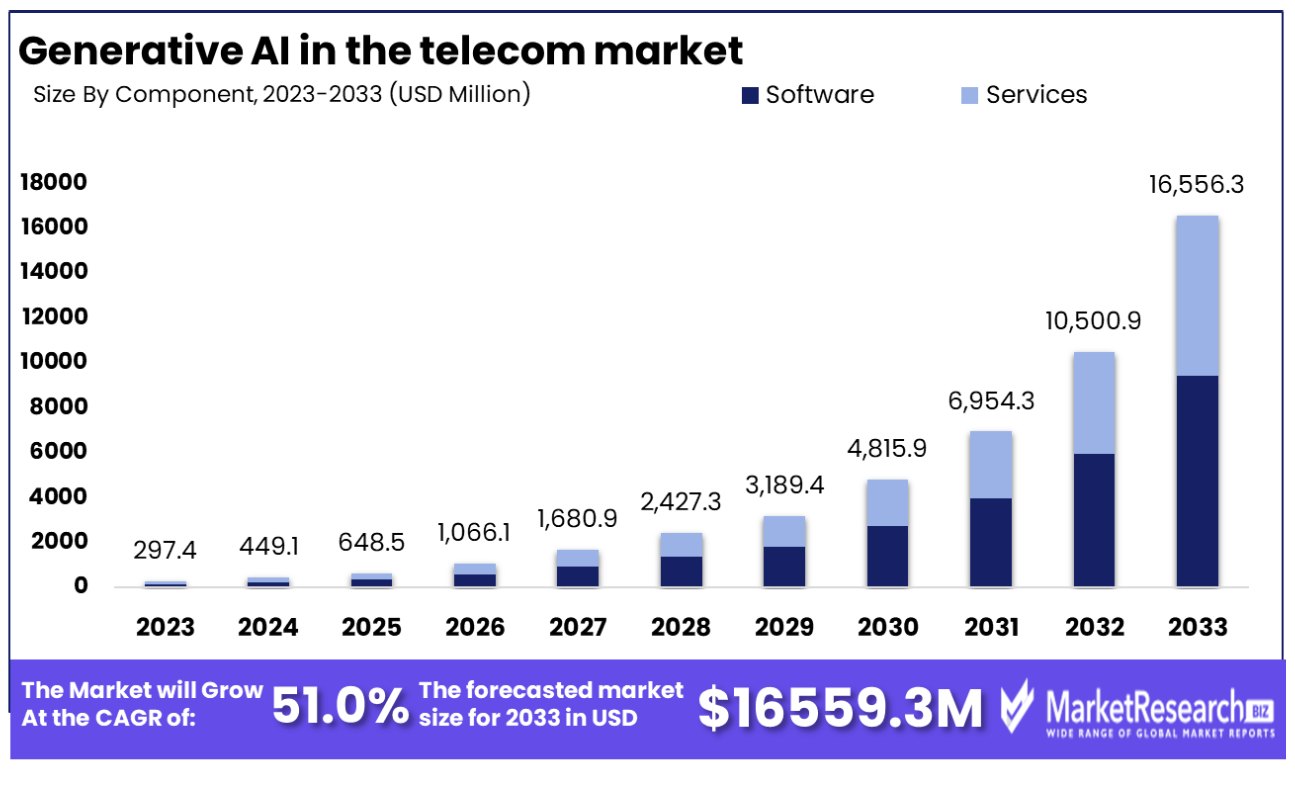
Generative AI in the telecom market was valued at USD 297.4 Million in 2023. It is expected to reach USD 16,556 Million by 2033, with a CAGR of 51.0% during the forecast period from 2024 to 2033.
Generative AI in the telecom market refers to the application of artificial intelligence technologies capable of generating new content, predictions, or data models within the telecommunications industry. These technologies harness advanced algorithms and machine learning techniques to analyze vast datasets, enabling the creation of predictive models, optimization of network operations, and personalization of customer experiences. By leveraging generative AI, telecom companies can enhance service quality, innovate new offerings, streamline operational efficiencies, and improve decision-making processes. This integration signifies a pivotal shift towards more intelligent, adaptive, and customer-centric telecommunications services, fostering market growth and technological advancements in the sector.
Incorporating Generative AI into the telecom sector is increasingly seen as a strategic imperative for operators aiming to navigate the complexities of the digital age while ensuring competitive advantage and operational efficiency. The forthcoming adoption of Billing and Charging Evolution (BCE) 2.0 in 2024 underscores this trend, with a forecasted increase in 5G roaming connections from 35 million in 2023 to 77 million by the end of 2024. This rise, coupled with the integration of cutting-edge technologies such as generative AI, is poised to significantly mitigate revenue leakage traditionally associated with the outdated Transferred Account Procedure (TAP), thereby enhancing 5G monetization strategies.
Supporting this viewpoint, research from Altman Solon indicates a potential six-fold increase in AI spending by 2025, with nearly half (45%) of telecom providers expecting a notable rise in generative AI investment within the next two years. Their analysis of 17 potential generative AI use cases across product & marketing, customer service, IT, and network domains highlights the technology’s broad applicability and transformative potential within the telecom industry.
Moreover, the adoption of generative AI necessitates radical transformations in existing data and communications infrastructures to meet new scaling requirements. For instance, Cisco’s Data Center Networking Blueprint for AI/ML Applications delineates how organizations can leverage existing data center Ethernet networks, capable of supporting up to 25.6Tbps of bandwidth per ASIC, to accommodate AI applications. This is critical as a survey by IDC revealed that 46% of IT decision-makers rank network scalability among the top three challenges, emphasizing the need for investments in scalable networks to meet the burgeoning connectivity demands of a digital era.
Key Takeaways
- Market Growth: Generative AI in the telecom market was valued at USD 297.4 Million in 2023. It is expected to reach USD 16,556 Million by 2033, with a CAGR of 51.0% during the forecast period from 2024 to 2033.
- By Component: Software emerges as the dominant segment, accounting for 75% of the market share.
- By Type: Text-based generative AI holds the largest market share by type within the telecom sector, with 40% dominance.
- By Deployment Mode: On-premise deployment of Generative AI solutions is the preferred mode in the telecom sector, commanding a 60% market share.
- By Application: Network optimization is the leading application of Generative AI in the telecom sector, accounting for 25% of the market.
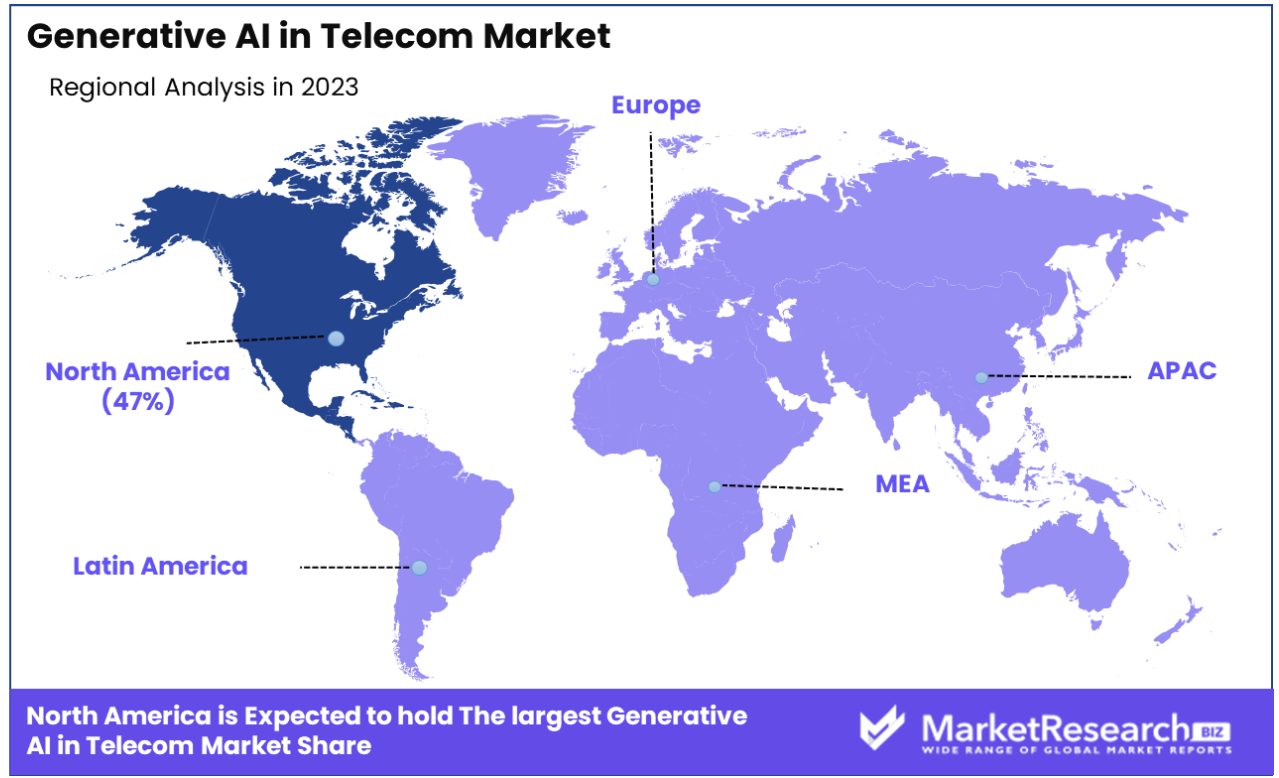
- Regional Dominance: North America Dominates with 47% Market Share
Driving Factors
Cost Savings Drive Market Growth
The adoption of Generative AI in the telecom sector significantly enhances operational efficiency, leading to substantial cost reductions. By automating routine tasks, such as customer service through AI-driven chatbots, telecom companies can decrease labor expenses, a major component of operational costs. This automation not only streamlines operations but also reallocates human resources to more strategic roles, enhancing productivity.
The savings generated can be invested in innovation and infrastructure, further propelling market growth. This strategic reallocation underpins a virtuous cycle of investment in new technologies, fostering an environment conducive to continuous improvement and innovation. The long-term implication is a more agile, efficient telecom sector capable of adapting to evolving market demands with reduced financial burden.
Improved Customer Experience Fuels Market Expansion
Generative AI elevates the customer experience in the telecom industry by providing personalized, engaging interactions. Tools such as AI-generated natural conversations and recommendations cater to individual customer preferences, significantly enhancing satisfaction and loyalty. This tailored approach not only meets but anticipates customer needs, setting a new standard for service delivery.
By synthesizing customers' voices and personalities, telecom companies create a uniquely personal interaction, deepening customer engagement. This heightened customer satisfaction drives increased retention rates and attracts new customers through positive word-of-mouth. The ripple effect of improved customer experience is a strengthened brand reputation and competitive advantage, leading to sustained market growth. In the long term, this focus on customer-centric innovation will dictate market leadership in the telecom industry.
Increased Revenues Propel Market Growth
Generative AI offers telecom companies a pathway to diversify and enhance their revenue streams through the creation of innovative products and services. By leveraging generative design, telecom companies can offer customized mobile plans and services tailored to the nuanced needs of their customer base, fostering a more personalized customer journey. This customization not only enhances customer satisfaction but also opens up new avenues for monetization, including premium services and plans.
The ability to rapidly prototype and deploy new offerings, thanks to AI, ensures telecom companies remain at the forefront of market trends, effectively responding to consumer demand with agility. The introduction of such AI-driven innovations contributes to a dynamic, competitive market landscape, encouraging continual growth and evolution. In the long term, the integration of Generative AI into product and service development is expected to be a cornerstone of revenue generation and market expansion in the telecom sector.
Restraining Factors
Data Privacy Concerns Restrain Market Growth
Data privacy concerns significantly limit the expansion of Generative AI in the telecom sector. As telecom companies manage vast quantities of sensitive customer information, the use of this data to train generative AI models without explicit consent raises substantial privacy issues. The apprehension surrounding the misuse of personal data not only erodes customer trust but also leads to heightened scrutiny from data protection authorities.
This environment of skepticism hampers the willingness of telecom operators to fully embrace generative AI technologies, fearing backlash and potential legal ramifications. Moreover, the necessity to navigate complex data privacy regulations adds another layer of operational complexity, further restraining market growth by deterring innovation and slowing the pace of AI integration into customer service and product development.
Regulatory Uncertainty Limits Market Expansion
Regulatory uncertainty acts as a significant barrier to the growth of Generative AI in the telecom industry. The lack of clear regulations regarding the deployment of generative AI technologies, such as voice and video synthesis, creates a challenging environment for telecom companies. This ambiguity discourages investment in generative AI applications due to concerns over future compliance and potential legal challenges.
For example, the telecom industry faces uncertainties around regulations for informing customers about interactions with AI instead of humans, which could impact customer trust and acceptance. This regulatory fog not only stifles innovation but also constrains the telecom sector's ability to leverage generative AI for enhancing customer experiences and developing new services, ultimately inhibiting market growth and innovation.
Generative AI in Telecom Market Segmentation Analysis
By Component Analysis:
In the Generative AI in Telecom Market, software emerges as the dominant segment, accounting for 75% of the market share. This dominance can be attributed to the increasing demand for AI-driven solutions that enhance operational efficiency, customer experience, and service personalization in the telecom sector.
Generative AI software, including platforms and tools for data analysis, customer interaction, and network management, is at the forefront of this transformation. These software solutions enable telecom companies to automate complex processes, from customer service with AI chatbots to network optimization and predictive maintenance, significantly reducing operational costs and improving service quality.
The remaining 25% of the market is occupied by services, including consultancy, implementation, support, and maintenance services. These services play a crucial role in enabling telecom companies to effectively deploy, manage, and leverage generative AI software. They ensure that AI solutions are tailored to specific business needs, integrated seamlessly into existing infrastructure, and optimized for peak performance. As the complexity of AI technologies and the importance of specialized knowledge increase, the demand for these services is expected to grow, supporting the overall expansion of Generative AI in the Telecom Market.
By Type Analysis:
Text-based generative AI holds the largest market share by type within the telecom sector, with 40% dominance. This segment's growth is driven by the widespread adoption of AI for customer support, including chatbots and virtual assistants that handle inquiries, complaints, and service requests. Text-based AI improves efficiency and customer satisfaction by providing quick, accurate responses around the clock, reducing wait times, and freeing human agents to tackle more complex issues.
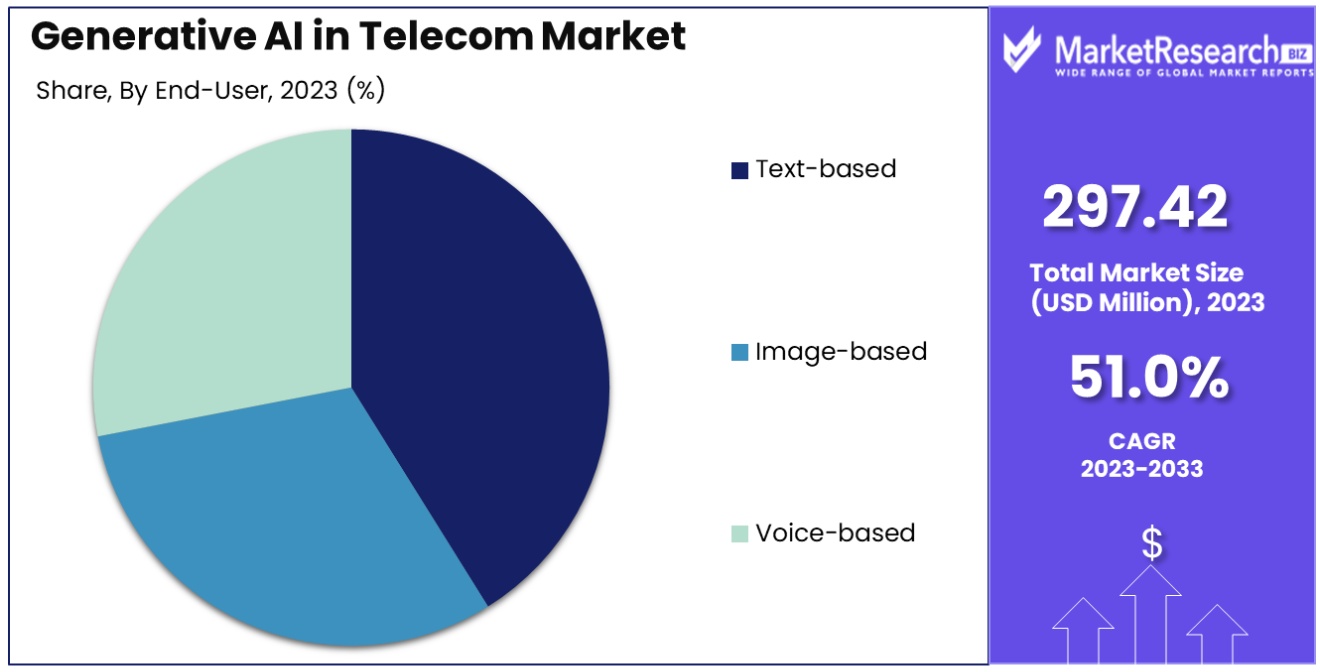
Image-based and voice-based generative AI also contribute to the market but to a lesser extent. Image-based AI is used in applications such as network planning and maintenance, where visual data analysis can identify issues or optimize layouts. Voice-based AI, on the other hand, enhances customer interactions by providing more natural and engaging conversational experiences. These segments, while smaller, are integral to creating a comprehensive AI ecosystem in telecom, offering diverse solutions that cater to varying customer and operational needs.
By Deployment Mode Analysis:
On-premise deployment of Generative AI solutions is the preferred mode in the telecom sector, commanding a 60% market share. This preference is largely due to the sensitive nature of telecom operations and the critical importance of data security and regulatory compliance. On-premise solutions offer telecom companies greater control over their data and AI infrastructure, minimizing the risk of data breaches and ensuring that operations comply with strict industry regulations.
Cloud-based deployment, although less dominant, is gaining traction due to its scalability, flexibility, and cost-effectiveness. Cloud platforms allow telecom operators to leverage advanced AI capabilities without the need for substantial upfront investments in hardware and infrastructure. As cloud technologies continue to advance in terms of security and compliance features, the shift towards cloud deployment is expected to accelerate, contributing to the market's growth.
By Application Analysis:
Network optimization is the leading application of Generative AI in the telecom sector, accounting for 25% of the market. This dominance is underpinned by the critical need for telecom operators to ensure optimal network performance, reliability, and efficiency. Generative AI plays a pivotal role in analyzing network traffic, predicting demand patterns, and automatically adjusting resources to meet demand, thereby enhancing service quality and customer satisfaction.
Other significant applications include predictive maintenance, which reduces downtime and operational costs; improving call center operations and customer support through AI-driven interactions; personalized product/service recommendations; security and fraud detection; and marketing and personalized product recommendations.
Each of these applications leverages Generative AI to address specific challenges within the telecom industry, contributing to improved operational efficiency, customer experience, and revenue generation. While network optimization is currently the dominant application, the importance and market share of other applications are expected to grow as telecom companies continue to explore and adopt AI-driven solutions across different facets of their operations.
Generative AI in Telecom Industry Segments
By Component:
- Software
- Services
By Type:
- Text-based
- Image-based
- Voice-based
By Deployment mode:
- On-premise
- Cloud
By Application:
- Network Optimization
- Predictive Maintenance
- Improve call center operations & customer support
- Personalized Product/Service Recommendations
- Security & fraud detection
- Marketing and Personalized Product Recommendations
- Others
Generative AI in Telecom Market Growth Opportunities
Personalized Marketing Offers Growth Opportunities
Personalized marketing powered by Generative AI presents significant growth opportunities within the Generative AI Telecom Market. By crafting customized marketing messages, telecom companies like Vodafone can directly address each customer's unique needs and interests, moving beyond the inefficiencies of generic mass marketing. This approach significantly enhances customer engagement and response rates, driving higher conversion and retention.
Statistics suggest that personalized marketing can lead to a substantial increase in customer loyalty and revenue. For instance, campaigns tailored to individual preferences are shown to generate up to 50% higher engagement rates. As telecom companies harness Generative AI for personalized marketing, they unlock new avenues for growth, deepening customer relationships and boosting revenue through targeted offers and communications.
Intelligent Network Capacity Planning Enhances Market Potential
Intelligent network capacity planning, facilitated by Generative AI, optimizes network expansion and operational efficiency, marking a critical growth area in the telecom industry. Generative models enable telecom operators like Hydro One to align capacity expansion with actual demand by analyzing network traffic and customer usage patterns, particularly in underserved rural areas.
This proactive approach ensures optimal investment in infrastructure, enhancing service quality and customer satisfaction while minimizing wasted resources. The ability to forecast demand accurately and plan network expansions strategically can lead to cost savings and improved profitability, positioning telecom companies for sustainable growth in a competitive market.
Generative AI in Telecom Market Trending Factors
Fraud Prevention Secures Market Expansion
Generative AI's capability to detect and prevent novel fraud patterns offers a robust growth opportunity for the telecom sector. With telecom companies losing billions annually to fraudulent activities, the introduction of advanced, AI-driven anomaly detection mechanisms can significantly mitigate financial losses.
Generative algorithms excel in identifying emerging fraud schemes, such as sophisticated robocalling scams, before they become widespread. This proactive fraud prevention enhances customer trust and reduces operational risks, contributing to a more secure and reliable telecom ecosystem. As these AI solutions evolve, they provide telecom companies with a competitive edge, securing their market position and opening new avenues for growth through enhanced security measures.
Automated Customer Service Is Trending
Automated customer service, enabled by conversational generative AI agents, addresses key consumer pain points such as long wait times and limited service hours, presenting a substantial growth opportunity for the telecom market. These AI-driven chatbots, capable of handling inquiries 24/7, offer telecom companies like Rogers a way to deliver consistent, high-quality customer service.
By training on historical customer interactions, these agents can provide personalized and efficient solutions, improving overall customer satisfaction and loyalty. The implementation of automated customer service not only enhances the customer experience but also reduces operational costs, creating a scalable solution for improving service quality and driving market growth.
Generative AI in Telecom Market Regional Analysis
North America Dominates with 47% Market Share
North America, with a 47% stake, stands as the dominant force in the Generative AI in the Telecom Market, driven by a confluence of technological innovation, robust infrastructure, and significant investment in AI research and development. This region's leadership stems from its early adoption of AI technologies, supported by a strong ecosystem of tech giants and startups alike, fostering innovation and deployment in telecom services.
High levels of digital literacy among consumers and businesses alike have accelerated the demand for advanced telecom solutions, including those powered by Generative AI, further propelling market growth. The presence of stringent data protection regulations has also encouraged the development of secure, compliant AI solutions, setting a benchmark for the global market.
The dynamics of the North American market are characterized by a competitive landscape that pushes for continuous technological advancements, making it a hotbed for AI innovation. This competitive environment, coupled with substantial financial backing for AI projects, has enabled rapid experimentation and deployment of Generative AI in telecom, addressing both operational efficiencies and customer experience enhancements.
Europe Progresses with Substantial Adoption
Europe, with its significant market share, progresses as a key player in the Generative AI in Telecom Market, underpinned by its strong regulatory framework for data protection and privacy, such as GDPR. This regulatory environment has prompted the development of AI solutions that are not only innovative but also highly compliant with data protection standards, making Europe an attractive market for secure and ethical AI deployment.
Asia-Pacific Showcases Rapid Growth Potential
The Asia-Pacific region demonstrates a rapidly growing potential for Generative AI in the Telecom Market, buoyed by its vast population, increasing digital penetration, and strong governmental support for technological advancements. Countries like China, India, and South
Korea is at the forefront of this growth, leveraging Generative AI to enhance connectivity, improve customer service, and introduce innovative telecom solutions to meet the region's unique demands. The Asia-Pacific market benefits from a dynamic startup ecosystem, significant investment in AI research, and a willingness among telecom operators to experiment with new technologies.
Generative AI in the Telecom Industry By Region
Key Regions and Countries
North America
- The US
- Canada
- Rest of North America
Europe
- Germany
- France
- The UK
- Spain
- Netherlands
- Russia
- Italy
- Rest of Europe
Asia-Pacific
- China
- Japan
- Singapore
- Thailand
- South Korea
- Vietnam
- India
- New Zealand
- Rest of Asia Pacific
Latin America
- Mexico
- Brazil
- Rest of Latin America
Middle East & Africa
- Saudi Arabia
- South Africa
- UAE
- The rest of the Middle East & Africa
Generative AI in Telecom Market Competitive Analysis
In the dynamic landscape of Generative AI in the Telecom Market, key players such as IBM, Nokia, Ericsson, and Cisco Systems demonstrate substantial impact and strategic positioning, driving the market forward through innovation and comprehensive AI solutions. These companies, alongside LeewayHertz, Amdocs, C3.ai, Inc., and Ciena, are pivotal in shaping the industry's trajectory, offering a blend of advanced AI software, services, and infrastructure crucial for telecom operators aiming to enhance operational efficiency, customer experience, and network optimization.
ZTE Corporation, Infosys, and Altran (part of Capgemini), further contribute to the market's diversity, bringing specialized expertise in telecommunications and AI to address unique challenges within the sector. Ribbon Communications, Aria Networks, and Guavus (a Thales company) stand out for their focus on network efficiency, analytics, and security, highlighting the critical role of AI in improving telecom infrastructure and services.
Netcracker Technology (a subsidiary of NEC Corporation) and Cresta bring forward-looking AI applications to the table, emphasizing the importance of innovation in customer interaction and service delivery. The inclusion of "Other key players" signifies a vibrant, competitive market environment, where emerging and established companies alike vie to offer differentiated, value-added AI solutions.
Generative AI in Telecom Industry Key Players
- IBM
- LeewayHertz
- Nokia
- Ericsson
- Cisco Systems
- Amdocs
- C3.ai, Inc.
- Ciena
- ZTE Corporation
- Infosys
- Altran (part of Capgemini)
- Ribbon Communications
- Aria Networks
- Guavus (a Thales company)
- Netcracker Technology (a subsidiary of NEC Corporation)
- Cresta
- Other key players
Generative AI in Telecom Market Recent Development
- In November 2023, Amdocs and NVIDIA announced that they are collaborating to optimize large language models (LLMs), aiming to accelerate the adoption of generative AI applications and services in the $1.7 trillion telecommunications and media industries. This partnership will empower communication service providers to efficiently deploy generative AI across various aspects of their businesses. Service providers can expect cost savings, streamlined operations, and enhanced performance by adopting customized Amdocs amazing LLMs, and generative AI applications leveraging NVIDIA DGX Cloud.
- In June 2023, AT&T launched Ask AT&T, a generative AI platform based on OpenAI's chatGPT, aimed at assisting employees in various tasks. The technology is seen as transformative and is expected to impact businesses similar to how the introduction of PCs and the internet did decades ago. Besides AT&T, other telecom companies, such as Verizon, are also incorporating AI into their services. Verizon, for instance, offers a contact center service utilizing AI to assist customer service representatives.
- In September 2023, Netcracker Technology launched the GenAI Telco Solution, aiming to enable communications service providers (CSPs) in the telecom industry to leverage their valuable data through transformative Generative AI (GenAI) technology securely and efficiently.
Report Scope
Report Features Description Market Value (2023) USD 297.4 Million Forecast Revenue (2033) USD 16,556 Million CAGR (2024-2032) 51.0% Base Year for Estimation 2023 Historic Period 2016-2023 Forecast Period 2024-2033 Report Coverage Revenue Forecast, Market Dynamics, COVID-19 Impact, Competitive Landscape, Recent Developments Segments Covered By Component:(Software,Services), By Type:(Text-based, Image-based, Voice-based), By Deployment mode:(On-premise, Cloud), By Application:(Network Optimization, Predictive Maintenance, Improve call center operations & customer support, Personalized Product/Service Recommendations, Security & fraud detection) Regional Analysis North America - The US, Canada, Rest of North America, Europe - Germany, France, The UK, Spain, Italy, Russia, Netherlands, Rest of Europe, Asia-Pacific - China, Japan, South Korea, India, New Zealand, Singapore, Thailand, Vietnam, Rest of Asia Pacific, Latin America - Brazil, Mexico, Rest of Latin America, Middle East & Africa - South Africa, Saudi Arabia, UAE, Rest of Middle East & Africa Competitive Landscape IBM, LeewayHertz, Nokia, Ericsson, Cisco Systems, Amdocs, C3.ai, Inc., Ciena, ZTE Corporation, Infosys Customization Scope Customization for segments, region/country-level will be provided. Moreover, additional customization can be done based on the requirements. Purchase Options We have three licenses to opt for Single User License, Multi-User License (Up to 5 Users), Corporate Use License (Unlimited User and Printable PDF) -
- 1. Executive Summary
- 1.1. Definition
- 1.2. Taxonomy
- 1.3. Research Scope
- 1.4. Key Analysis
- 1.5. Key Findings by Major Segments
- 1.6. Top strategies by Major Players
- 2. Global Generative AI in Telecom Market Overview
- 2.1. Generative AI in Telecom Market Dynamics
- 2.1.1. Drivers
- 2.1.2. Opportunities
- 2.1.3. Restraints
- 2.1.4. Challenges
- 2.2. Macro-economic Factors
- 2.3. Regulatory Framework
- 2.4. Market Investment Feasibility Index
- 2.5. PEST Analysis
- 2.6. PORTER’S Five Force Analysis
- 2.7. Drivers & Restraints Impact Analysis
- 2.8. Industry Chain Analysis
- 2.9. Cost Structure Analysis
- 2.10. Marketing Strategy
- 2.11. Russia-Ukraine War Impact Analysis
- 2.12. Opportunity Map Analysis
- 2.13. Market Competition Scenario Analysis
- 2.14. Product Life Cycle Analysis
- 2.15. Opportunity Orbits
- 2.16. Manufacturer Intensity Map
- 2.17. Major Companies sales by Value & Volume
- 2.1. Generative AI in Telecom Market Dynamics
- 3. Global Generative AI in Telecom Market Analysis, Opportunity and Forecast, 2016-2032
- 3.1. Global Generative AI in Telecom Market Analysis, 2016-2021
- 3.2. Global Generative AI in Telecom Market Opportunity and Forecast, 2023-2032
- 3.3. Global Generative AI in Telecom Market Analysis, Opportunity and Forecast, By Based On Type, 2016-2032
- 3.3.1. Global Generative AI in Telecom Market Analysis by Based On Type: Introduction
- 3.3.2. Market Size Absolute $ Opportunity Analysis and Forecast, By Based On Type, 2016-2032
- 3.3.3. Text-based
- 3.3.4. Image-based
- 3.3.5. Voice-based
- 3.4. Global Generative AI in Telecom Market Analysis, Opportunity and Forecast, By Based On Application, 2016-2032
- 3.4.1. Global Generative AI in Telecom Market Analysis by Based On Application: Introduction
- 3.4.2. Market Size Absolute $ Opportunity Analysis and Forecast, By Based On Application, 2016-2032
- 3.4.3. Enhanced Customer Satisfaction
- 3.4.4. Automated Monitoring Solutions
- 3.4.5. Manage Dynamic Networks
- 3.4.6. Improve Network Performance
- 3.4.7. Network Security and Fraud Mitigation
- 3.4.8. Network Orchestration
- 3.5. Global Generative AI in Telecom Market Analysis, Opportunity and Forecast, By Based On Deployment, 2016-2032
- 3.5.1. Global Generative AI in Telecom Market Analysis by Based On Deployment: Introduction
- 3.5.2. Market Size Absolute $ Opportunity Analysis and Forecast, By Based On Deployment, 2016-2032
- 3.5.3. On-Premises
- 3.5.4. Cloud-Based
- 3.5.5. Edge
- 3.5.6. Hybrid
- 4. North America Generative AI in Telecom Market Analysis, Opportunity and Forecast, 2016-2032
- 4.1. North America Generative AI in Telecom Market Analysis, 2016-2021
- 4.2. North America Generative AI in Telecom Market Opportunity and Forecast, 2023-2032
- 4.3. North America Generative AI in Telecom Market Analysis, Opportunity and Forecast, By Based On Type, 2016-2032
- 4.3.1. North America Generative AI in Telecom Market Analysis by Based On Type: Introduction
- 4.3.2. Market Size Absolute $ Opportunity Analysis and Forecast, By Based On Type, 2016-2032
- 4.3.3. Text-based
- 4.3.4. Image-based
- 4.3.5. Voice-based
- 4.4. North America Generative AI in Telecom Market Analysis, Opportunity and Forecast, By Based On Application, 2016-2032
- 4.4.1. North America Generative AI in Telecom Market Analysis by Based On Application: Introduction
- 4.4.2. Market Size Absolute $ Opportunity Analysis and Forecast, By Based On Application, 2016-2032
- 4.4.3. Enhanced Customer Satisfaction
- 4.4.4. Automated Monitoring Solutions
- 4.4.5. Manage Dynamic Networks
- 4.4.6. Improve Network Performance
- 4.4.7. Network Security and Fraud Mitigation
- 4.4.8. Network Orchestration
- 4.5. North America Generative AI in Telecom Market Analysis, Opportunity and Forecast, By Based On Deployment, 2016-2032
- 4.5.1. North America Generative AI in Telecom Market Analysis by Based On Deployment: Introduction
- 4.5.2. Market Size Absolute $ Opportunity Analysis and Forecast, By Based On Deployment, 2016-2032
- 4.5.3. On-Premises
- 4.5.4. Cloud-Based
- 4.5.5. Edge
- 4.5.6. Hybrid
- 4.6. North America Generative AI in Telecom Market Analysis, Opportunity and Forecast, By Country , 2016-2032
- 4.6.1. North America Generative AI in Telecom Market Analysis by Country : Introduction
- 4.6.2. Market Size Absolute $ Opportunity Analysis and Forecast, Country , 2016-2032
- 4.6.2.1. The US
- 4.6.2.2. Canada
- 4.6.2.3. Mexico
- 5. Western Europe Generative AI in Telecom Market Analysis, Opportunity and Forecast, 2016-2032
- 5.1. Western Europe Generative AI in Telecom Market Analysis, 2016-2021
- 5.2. Western Europe Generative AI in Telecom Market Opportunity and Forecast, 2023-2032
- 5.3. Western Europe Generative AI in Telecom Market Analysis, Opportunity and Forecast, By Based On Type, 2016-2032
- 5.3.1. Western Europe Generative AI in Telecom Market Analysis by Based On Type: Introduction
- 5.3.2. Market Size Absolute $ Opportunity Analysis and Forecast, By Based On Type, 2016-2032
- 5.3.3. Text-based
- 5.3.4. Image-based
- 5.3.5. Voice-based
- 5.4. Western Europe Generative AI in Telecom Market Analysis, Opportunity and Forecast, By Based On Application, 2016-2032
- 5.4.1. Western Europe Generative AI in Telecom Market Analysis by Based On Application: Introduction
- 5.4.2. Market Size Absolute $ Opportunity Analysis and Forecast, By Based On Application, 2016-2032
- 5.4.3. Enhanced Customer Satisfaction
- 5.4.4. Automated Monitoring Solutions
- 5.4.5. Manage Dynamic Networks
- 5.4.6. Improve Network Performance
- 5.4.7. Network Security and Fraud Mitigation
- 5.4.8. Network Orchestration
- 5.5. Western Europe Generative AI in Telecom Market Analysis, Opportunity and Forecast, By Based On Deployment, 2016-2032
- 5.5.1. Western Europe Generative AI in Telecom Market Analysis by Based On Deployment: Introduction
- 5.5.2. Market Size Absolute $ Opportunity Analysis and Forecast, By Based On Deployment, 2016-2032
- 5.5.3. On-Premises
- 5.5.4. Cloud-Based
- 5.5.5. Edge
- 5.5.6. Hybrid
- 5.6. Western Europe Generative AI in Telecom Market Analysis, Opportunity and Forecast, By Country , 2016-2032
- 5.6.1. Western Europe Generative AI in Telecom Market Analysis by Country : Introduction
- 5.6.2. Market Size Absolute $ Opportunity Analysis and Forecast, Country , 2016-2032
- 5.6.2.1. Germany
- 5.6.2.2. France
- 5.6.2.3. The UK
- 5.6.2.4. Spain
- 5.6.2.5. Italy
- 5.6.2.6. Portugal
- 5.6.2.7. Ireland
- 5.6.2.8. Austria
- 5.6.2.9. Switzerland
- 5.6.2.10. Benelux
- 5.6.2.11. Nordic
- 5.6.2.12. Rest of Western Europe
- 6. Eastern Europe Generative AI in Telecom Market Analysis, Opportunity and Forecast, 2016-2032
- 6.1. Eastern Europe Generative AI in Telecom Market Analysis, 2016-2021
- 6.2. Eastern Europe Generative AI in Telecom Market Opportunity and Forecast, 2023-2032
- 6.3. Eastern Europe Generative AI in Telecom Market Analysis, Opportunity and Forecast, By Based On Type, 2016-2032
- 6.3.1. Eastern Europe Generative AI in Telecom Market Analysis by Based On Type: Introduction
- 6.3.2. Market Size Absolute $ Opportunity Analysis and Forecast, By Based On Type, 2016-2032
- 6.3.3. Text-based
- 6.3.4. Image-based
- 6.3.5. Voice-based
- 6.4. Eastern Europe Generative AI in Telecom Market Analysis, Opportunity and Forecast, By Based On Application, 2016-2032
- 6.4.1. Eastern Europe Generative AI in Telecom Market Analysis by Based On Application: Introduction
- 6.4.2. Market Size Absolute $ Opportunity Analysis and Forecast, By Based On Application, 2016-2032
- 6.4.3. Enhanced Customer Satisfaction
- 6.4.4. Automated Monitoring Solutions
- 6.4.5. Manage Dynamic Networks
- 6.4.6. Improve Network Performance
- 6.4.7. Network Security and Fraud Mitigation
- 6.4.8. Network Orchestration
- 6.5. Eastern Europe Generative AI in Telecom Market Analysis, Opportunity and Forecast, By Based On Deployment, 2016-2032
- 6.5.1. Eastern Europe Generative AI in Telecom Market Analysis by Based On Deployment: Introduction
- 6.5.2. Market Size Absolute $ Opportunity Analysis and Forecast, By Based On Deployment, 2016-2032
- 6.5.3. On-Premises
- 6.5.4. Cloud-Based
- 6.5.5. Edge
- 6.5.6. Hybrid
- 6.6. Eastern Europe Generative AI in Telecom Market Analysis, Opportunity and Forecast, By Country , 2016-2032
- 6.6.1. Eastern Europe Generative AI in Telecom Market Analysis by Country : Introduction
- 6.6.2. Market Size Absolute $ Opportunity Analysis and Forecast, Country , 2016-2032
- 6.6.2.1. Russia
- 6.6.2.2. Poland
- 6.6.2.3. The Czech Republic
- 6.6.2.4. Greece
- 6.6.2.5. Rest of Eastern Europe
- 7. APAC Generative AI in Telecom Market Analysis, Opportunity and Forecast, 2016-2032
- 7.1. APAC Generative AI in Telecom Market Analysis, 2016-2021
- 7.2. APAC Generative AI in Telecom Market Opportunity and Forecast, 2023-2032
- 7.3. APAC Generative AI in Telecom Market Analysis, Opportunity and Forecast, By Based On Type, 2016-2032
- 7.3.1. APAC Generative AI in Telecom Market Analysis by Based On Type: Introduction
- 7.3.2. Market Size Absolute $ Opportunity Analysis and Forecast, By Based On Type, 2016-2032
- 7.3.3. Text-based
- 7.3.4. Image-based
- 7.3.5. Voice-based
- 7.4. APAC Generative AI in Telecom Market Analysis, Opportunity and Forecast, By Based On Application, 2016-2032
- 7.4.1. APAC Generative AI in Telecom Market Analysis by Based On Application: Introduction
- 7.4.2. Market Size Absolute $ Opportunity Analysis and Forecast, By Based On Application, 2016-2032
- 7.4.3. Enhanced Customer Satisfaction
- 7.4.4. Automated Monitoring Solutions
- 7.4.5. Manage Dynamic Networks
- 7.4.6. Improve Network Performance
- 7.4.7. Network Security and Fraud Mitigation
- 7.4.8. Network Orchestration
- 7.5. APAC Generative AI in Telecom Market Analysis, Opportunity and Forecast, By Based On Deployment, 2016-2032
- 7.5.1. APAC Generative AI in Telecom Market Analysis by Based On Deployment: Introduction
- 7.5.2. Market Size Absolute $ Opportunity Analysis and Forecast, By Based On Deployment, 2016-2032
- 7.5.3. On-Premises
- 7.5.4. Cloud-Based
- 7.5.5. Edge
- 7.5.6. Hybrid
- 7.6. APAC Generative AI in Telecom Market Analysis, Opportunity and Forecast, By Country , 2016-2032
- 7.6.1. APAC Generative AI in Telecom Market Analysis by Country : Introduction
- 7.6.2. Market Size Absolute $ Opportunity Analysis and Forecast, Country , 2016-2032
- 7.6.2.1. China
- 7.6.2.2. Japan
- 7.6.2.3. South Korea
- 7.6.2.4. India
- 7.6.2.5. Australia & New Zeland
- 7.6.2.6. Indonesia
- 7.6.2.7. Malaysia
- 7.6.2.8. Philippines
- 7.6.2.9. Singapore
- 7.6.2.10. Thailand
- 7.6.2.11. Vietnam
- 7.6.2.12. Rest of APAC
- 8. Latin America Generative AI in Telecom Market Analysis, Opportunity and Forecast, 2016-2032
- 8.1. Latin America Generative AI in Telecom Market Analysis, 2016-2021
- 8.2. Latin America Generative AI in Telecom Market Opportunity and Forecast, 2023-2032
- 8.3. Latin America Generative AI in Telecom Market Analysis, Opportunity and Forecast, By Based On Type, 2016-2032
- 8.3.1. Latin America Generative AI in Telecom Market Analysis by Based On Type: Introduction
- 8.3.2. Market Size Absolute $ Opportunity Analysis and Forecast, By Based On Type, 2016-2032
- 8.3.3. Text-based
- 8.3.4. Image-based
- 8.3.5. Voice-based
- 8.4. Latin America Generative AI in Telecom Market Analysis, Opportunity and Forecast, By Based On Application, 2016-2032
- 8.4.1. Latin America Generative AI in Telecom Market Analysis by Based On Application: Introduction
- 8.4.2. Market Size Absolute $ Opportunity Analysis and Forecast, By Based On Application, 2016-2032
- 8.4.3. Enhanced Customer Satisfaction
- 8.4.4. Automated Monitoring Solutions
- 8.4.5. Manage Dynamic Networks
- 8.4.6. Improve Network Performance
- 8.4.7. Network Security and Fraud Mitigation
- 8.4.8. Network Orchestration
- 8.5. Latin America Generative AI in Telecom Market Analysis, Opportunity and Forecast, By Based On Deployment, 2016-2032
- 8.5.1. Latin America Generative AI in Telecom Market Analysis by Based On Deployment: Introduction
- 8.5.2. Market Size Absolute $ Opportunity Analysis and Forecast, By Based On Deployment, 2016-2032
- 8.5.3. On-Premises
- 8.5.4. Cloud-Based
- 8.5.5. Edge
- 8.5.6. Hybrid
- 8.6. Latin America Generative AI in Telecom Market Analysis, Opportunity and Forecast, By Country , 2016-2032
- 8.6.1. Latin America Generative AI in Telecom Market Analysis by Country : Introduction
- 8.6.2. Market Size Absolute $ Opportunity Analysis and Forecast, Country , 2016-2032
- 8.6.2.1. Brazil
- 8.6.2.2. Colombia
- 8.6.2.3. Chile
- 8.6.2.4. Argentina
- 8.6.2.5. Costa Rica
- 8.6.2.6. Rest of Latin America
- 9. Middle East & Africa Generative AI in Telecom Market Analysis, Opportunity and Forecast, 2016-2032
- 9.1. Middle East & Africa Generative AI in Telecom Market Analysis, 2016-2021
- 9.2. Middle East & Africa Generative AI in Telecom Market Opportunity and Forecast, 2023-2032
- 9.3. Middle East & Africa Generative AI in Telecom Market Analysis, Opportunity and Forecast, By Based On Type, 2016-2032
- 9.3.1. Middle East & Africa Generative AI in Telecom Market Analysis by Based On Type: Introduction
- 9.3.2. Market Size Absolute $ Opportunity Analysis and Forecast, By Based On Type, 2016-2032
- 9.3.3. Text-based
- 9.3.4. Image-based
- 9.3.5. Voice-based
- 9.4. Middle East & Africa Generative AI in Telecom Market Analysis, Opportunity and Forecast, By Based On Application, 2016-2032
- 9.4.1. Middle East & Africa Generative AI in Telecom Market Analysis by Based On Application: Introduction
- 9.4.2. Market Size Absolute $ Opportunity Analysis and Forecast, By Based On Application, 2016-2032
- 9.4.3. Enhanced Customer Satisfaction
- 9.4.4. Automated Monitoring Solutions
- 9.4.5. Manage Dynamic Networks
- 9.4.6. Improve Network Performance
- 9.4.7. Network Security and Fraud Mitigation
- 9.4.8. Network Orchestration
- 9.5. Middle East & Africa Generative AI in Telecom Market Analysis, Opportunity and Forecast, By Based On Deployment, 2016-2032
- 9.5.1. Middle East & Africa Generative AI in Telecom Market Analysis by Based On Deployment: Introduction
- 9.5.2. Market Size Absolute $ Opportunity Analysis and Forecast, By Based On Deployment, 2016-2032
- 9.5.3. On-Premises
- 9.5.4. Cloud-Based
- 9.5.5. Edge
- 9.5.6. Hybrid
- 9.6. Middle East & Africa Generative AI in Telecom Market Analysis, Opportunity and Forecast, By Country , 2016-2032
- 9.6.1. Middle East & Africa Generative AI in Telecom Market Analysis by Country : Introduction
- 9.6.2. Market Size Absolute $ Opportunity Analysis and Forecast, Country , 2016-2032
- 9.6.2.1. Algeria
- 9.6.2.2. Egypt
- 9.6.2.3. Israel
- 9.6.2.4. Kuwait
- 9.6.2.5. Nigeria
- 9.6.2.6. Saudi Arabia
- 9.6.2.7. South Africa
- 9.6.2.8. Turkey
- 9.6.2.9. The UAE
- 9.6.2.10. Rest of MEA
- 10. Global Generative AI in Telecom Market Analysis, Opportunity and Forecast, By Region , 2016-2032
- 10.1. Global Generative AI in Telecom Market Analysis by Region : Introduction
- 10.2. Market Size Absolute $ Opportunity Analysis and Forecast, By Region , 2016-2032
- 10.2.1. North America
- 10.2.2. Western Europe
- 10.2.3. Eastern Europe
- 10.2.4. APAC
- 10.2.5. Latin America
- 10.2.6. Middle East & Africa
- 11. Global Generative AI in Telecom Market Competitive Landscape, Market Share Analysis, and Company Profiles
- 11.1. Market Share Analysis
- 11.2. Company Profiles
- 11.3. DeepMind Technologies Ltd.
- 11.3.1. Company Overview
- 11.3.2. Financial Highlights
- 11.3.3. Product Portfolio
- 11.3.4. SWOT Analysis
- 11.3.5. Key Strategies and Developments
- 11.4. NVIDIA Corporation
- 11.4.1. Company Overview
- 11.4.2. Financial Highlights
- 11.4.3. Product Portfolio
- 11.4.4. SWOT Analysis
- 11.4.5. Key Strategies and Developments
- 11.5. IBM Corporation
- 11.5.1. Company Overview
- 11.5.2. Financial Highlights
- 11.5.3. Product Portfolio
- 11.5.4. SWOT Analysis
- 11.5.5. Key Strategies and Developments
- 11.6. Microsoft Corporation
- 11.6.1. Company Overview
- 11.6.2. Financial Highlights
- 11.6.3. Product Portfolio
- 11.6.4. SWOT Analysis
- 11.6.5. Key Strategies and Developments
- 11.7. XENONSTACK
- 11.7.1. Company Overview
- 11.7.2. Financial Highlights
- 11.7.3. Product Portfolio
- 11.7.4. SWOT Analysis
- 11.7.5. Key Strategies and Developments
- 11.8. Techsee
- 11.8.1. Company Overview
- 11.8.2. Financial Highlights
- 11.8.3. Product Portfolio
- 11.8.4. SWOT Analysis
- 11.8.5. Key Strategies and Developments
- 11.9. Other Key Players
- 11.9.1. Company Overview
- 11.9.2. Financial Highlights
- 11.9.3. Product Portfolio
- 11.9.4. SWOT Analysis
- 11.9.5. Key Strategies and Developments
- 12. Assumptions and Acronyms
- 13. Research Methodology
- 14. Contact
- List of Figures
- Figure 1: Global Generative AI in Telecom Market Revenue (US$ Mn) Market Share by Based On Type in 2022
- Figure 2: Global Generative AI in Telecom Market Attractiveness Analysis by Based On Type, 2016-2032
- Figure 3: Global Generative AI in Telecom Market Revenue (US$ Mn) Market Share by Based On Applicationin 2022
- Figure 4: Global Generative AI in Telecom Market Attractiveness Analysis by Based On Application, 2016-2032
- Figure 5: Global Generative AI in Telecom Market Revenue (US$ Mn) Market Share by Based On Deploymentin 2022
- Figure 6: Global Generative AI in Telecom Market Attractiveness Analysis by Based On Deployment, 2016-2032
- Figure 7: Global Generative AI in Telecom Market Revenue (US$ Mn) Market Share by Region in 2022
- Figure 8: Global Generative AI in Telecom Market Attractiveness Analysis by Region, 2016-2032
- Figure 9: Global Generative AI in Telecom Market Revenue (US$ Mn) (2016-2032)
- Figure 10: Global Generative AI in Telecom Market Revenue (US$ Mn) Comparison by Region (2016-2032)
- Figure 11: Global Generative AI in Telecom Market Revenue (US$ Mn) Comparison by Based On Type (2016-2032)
- Figure 12: Global Generative AI in Telecom Market Revenue (US$ Mn) Comparison by Based On Application (2016-2032)
- Figure 13: Global Generative AI in Telecom Market Revenue (US$ Mn) Comparison by Based On Deployment (2016-2032)
- Figure 14: Global Generative AI in Telecom Market Y-o-Y Growth Rate Comparison by Region (2016-2032)
- Figure 15: Global Generative AI in Telecom Market Y-o-Y Growth Rate Comparison by Based On Type (2016-2032)
- Figure 16: Global Generative AI in Telecom Market Y-o-Y Growth Rate Comparison by Based On Application (2016-2032)
- Figure 17: Global Generative AI in Telecom Market Y-o-Y Growth Rate Comparison by Based On Deployment (2016-2032)
- Figure 18: Global Generative AI in Telecom Market Share Comparison by Region (2016-2032)
- Figure 19: Global Generative AI in Telecom Market Share Comparison by Based On Type (2016-2032)
- Figure 20: Global Generative AI in Telecom Market Share Comparison by Based On Application (2016-2032)
- Figure 21: Global Generative AI in Telecom Market Share Comparison by Based On Deployment (2016-2032)
- Figure 22: North America Generative AI in Telecom Market Revenue (US$ Mn) Market Share by Based On Typein 2022
- Figure 23: North America Generative AI in Telecom Market Attractiveness Analysis by Based On Type, 2016-2032
- Figure 24: North America Generative AI in Telecom Market Revenue (US$ Mn) Market Share by Based On Applicationin 2022
- Figure 25: North America Generative AI in Telecom Market Attractiveness Analysis by Based On Application, 2016-2032
- Figure 26: North America Generative AI in Telecom Market Revenue (US$ Mn) Market Share by Based On Deploymentin 2022
- Figure 27: North America Generative AI in Telecom Market Attractiveness Analysis by Based On Deployment, 2016-2032
- Figure 28: North America Generative AI in Telecom Market Revenue (US$ Mn) Market Share by Country in 2022
- Figure 29: North America Generative AI in Telecom Market Attractiveness Analysis by Country, 2016-2032
- Figure 30: North America Generative AI in Telecom Market Revenue (US$ Mn) (2016-2032)
- Figure 31: North America Generative AI in Telecom Market Revenue (US$ Mn) Comparison by Country (2016-2032)
- Figure 32: North America Generative AI in Telecom Market Revenue (US$ Mn) Comparison by Based On Type (2016-2032)
- Figure 33: North America Generative AI in Telecom Market Revenue (US$ Mn) Comparison by Based On Application (2016-2032)
- Figure 34: North America Generative AI in Telecom Market Revenue (US$ Mn) Comparison by Based On Deployment (2016-2032)
- Figure 35: North America Generative AI in Telecom Market Y-o-Y Growth Rate Comparison by Country (2016-2032)
- Figure 36: North America Generative AI in Telecom Market Y-o-Y Growth Rate Comparison by Based On Type (2016-2032)
- Figure 37: North America Generative AI in Telecom Market Y-o-Y Growth Rate Comparison by Based On Application (2016-2032)
- Figure 38: North America Generative AI in Telecom Market Y-o-Y Growth Rate Comparison by Based On Deployment (2016-2032)
- Figure 39: North America Generative AI in Telecom Market Share Comparison by Country (2016-2032)
- Figure 40: North America Generative AI in Telecom Market Share Comparison by Based On Type (2016-2032)
- Figure 41: North America Generative AI in Telecom Market Share Comparison by Based On Application (2016-2032)
- Figure 42: North America Generative AI in Telecom Market Share Comparison by Based On Deployment (2016-2032)
- Figure 43: Western Europe Generative AI in Telecom Market Revenue (US$ Mn) Market Share by Based On Typein 2022
- Figure 44: Western Europe Generative AI in Telecom Market Attractiveness Analysis by Based On Type, 2016-2032
- Figure 45: Western Europe Generative AI in Telecom Market Revenue (US$ Mn) Market Share by Based On Applicationin 2022
- Figure 46: Western Europe Generative AI in Telecom Market Attractiveness Analysis by Based On Application, 2016-2032
- Figure 47: Western Europe Generative AI in Telecom Market Revenue (US$ Mn) Market Share by Based On Deploymentin 2022
- Figure 48: Western Europe Generative AI in Telecom Market Attractiveness Analysis by Based On Deployment, 2016-2032
- Figure 49: Western Europe Generative AI in Telecom Market Revenue (US$ Mn) Market Share by Country in 2022
- Figure 50: Western Europe Generative AI in Telecom Market Attractiveness Analysis by Country, 2016-2032
- Figure 51: Western Europe Generative AI in Telecom Market Revenue (US$ Mn) (2016-2032)
- Figure 52: Western Europe Generative AI in Telecom Market Revenue (US$ Mn) Comparison by Country (2016-2032)
- Figure 53: Western Europe Generative AI in Telecom Market Revenue (US$ Mn) Comparison by Based On Type (2016-2032)
- Figure 54: Western Europe Generative AI in Telecom Market Revenue (US$ Mn) Comparison by Based On Application (2016-2032)
- Figure 55: Western Europe Generative AI in Telecom Market Revenue (US$ Mn) Comparison by Based On Deployment (2016-2032)
- Figure 56: Western Europe Generative AI in Telecom Market Y-o-Y Growth Rate Comparison by Country (2016-2032)
- Figure 57: Western Europe Generative AI in Telecom Market Y-o-Y Growth Rate Comparison by Based On Type (2016-2032)
- Figure 58: Western Europe Generative AI in Telecom Market Y-o-Y Growth Rate Comparison by Based On Application (2016-2032)
- Figure 59: Western Europe Generative AI in Telecom Market Y-o-Y Growth Rate Comparison by Based On Deployment (2016-2032)
- Figure 60: Western Europe Generative AI in Telecom Market Share Comparison by Country (2016-2032)
- Figure 61: Western Europe Generative AI in Telecom Market Share Comparison by Based On Type (2016-2032)
- Figure 62: Western Europe Generative AI in Telecom Market Share Comparison by Based On Application (2016-2032)
- Figure 63: Western Europe Generative AI in Telecom Market Share Comparison by Based On Deployment (2016-2032)
- Figure 64: Eastern Europe Generative AI in Telecom Market Revenue (US$ Mn) Market Share by Based On Typein 2022
- Figure 65: Eastern Europe Generative AI in Telecom Market Attractiveness Analysis by Based On Type, 2016-2032
- Figure 66: Eastern Europe Generative AI in Telecom Market Revenue (US$ Mn) Market Share by Based On Applicationin 2022
- Figure 67: Eastern Europe Generative AI in Telecom Market Attractiveness Analysis by Based On Application, 2016-2032
- Figure 68: Eastern Europe Generative AI in Telecom Market Revenue (US$ Mn) Market Share by Based On Deploymentin 2022
- Figure 69: Eastern Europe Generative AI in Telecom Market Attractiveness Analysis by Based On Deployment, 2016-2032
- Figure 70: Eastern Europe Generative AI in Telecom Market Revenue (US$ Mn) Market Share by Country in 2022
- Figure 71: Eastern Europe Generative AI in Telecom Market Attractiveness Analysis by Country, 2016-2032
- Figure 72: Eastern Europe Generative AI in Telecom Market Revenue (US$ Mn) (2016-2032)
- Figure 73: Eastern Europe Generative AI in Telecom Market Revenue (US$ Mn) Comparison by Country (2016-2032)
- Figure 74: Eastern Europe Generative AI in Telecom Market Revenue (US$ Mn) Comparison by Based On Type (2016-2032)
- Figure 75: Eastern Europe Generative AI in Telecom Market Revenue (US$ Mn) Comparison by Based On Application (2016-2032)
- Figure 76: Eastern Europe Generative AI in Telecom Market Revenue (US$ Mn) Comparison by Based On Deployment (2016-2032)
- Figure 77: Eastern Europe Generative AI in Telecom Market Y-o-Y Growth Rate Comparison by Country (2016-2032)
- Figure 78: Eastern Europe Generative AI in Telecom Market Y-o-Y Growth Rate Comparison by Based On Type (2016-2032)
- Figure 79: Eastern Europe Generative AI in Telecom Market Y-o-Y Growth Rate Comparison by Based On Application (2016-2032)
- Figure 80: Eastern Europe Generative AI in Telecom Market Y-o-Y Growth Rate Comparison by Based On Deployment (2016-2032)
- Figure 81: Eastern Europe Generative AI in Telecom Market Share Comparison by Country (2016-2032)
- Figure 82: Eastern Europe Generative AI in Telecom Market Share Comparison by Based On Type (2016-2032)
- Figure 83: Eastern Europe Generative AI in Telecom Market Share Comparison by Based On Application (2016-2032)
- Figure 84: Eastern Europe Generative AI in Telecom Market Share Comparison by Based On Deployment (2016-2032)
- Figure 85: APAC Generative AI in Telecom Market Revenue (US$ Mn) Market Share by Based On Typein 2022
- Figure 86: APAC Generative AI in Telecom Market Attractiveness Analysis by Based On Type, 2016-2032
- Figure 87: APAC Generative AI in Telecom Market Revenue (US$ Mn) Market Share by Based On Applicationin 2022
- Figure 88: APAC Generative AI in Telecom Market Attractiveness Analysis by Based On Application, 2016-2032
- Figure 89: APAC Generative AI in Telecom Market Revenue (US$ Mn) Market Share by Based On Deploymentin 2022
- Figure 90: APAC Generative AI in Telecom Market Attractiveness Analysis by Based On Deployment, 2016-2032
- Figure 91: APAC Generative AI in Telecom Market Revenue (US$ Mn) Market Share by Country in 2022
- Figure 92: APAC Generative AI in Telecom Market Attractiveness Analysis by Country, 2016-2032
- Figure 93: APAC Generative AI in Telecom Market Revenue (US$ Mn) (2016-2032)
- Figure 94: APAC Generative AI in Telecom Market Revenue (US$ Mn) Comparison by Country (2016-2032)
- Figure 95: APAC Generative AI in Telecom Market Revenue (US$ Mn) Comparison by Based On Type (2016-2032)
- Figure 96: APAC Generative AI in Telecom Market Revenue (US$ Mn) Comparison by Based On Application (2016-2032)
- Figure 97: APAC Generative AI in Telecom Market Revenue (US$ Mn) Comparison by Based On Deployment (2016-2032)
- Figure 98: APAC Generative AI in Telecom Market Y-o-Y Growth Rate Comparison by Country (2016-2032)
- Figure 99: APAC Generative AI in Telecom Market Y-o-Y Growth Rate Comparison by Based On Type (2016-2032)
- Figure 100: APAC Generative AI in Telecom Market Y-o-Y Growth Rate Comparison by Based On Application (2016-2032)
- Figure 101: APAC Generative AI in Telecom Market Y-o-Y Growth Rate Comparison by Based On Deployment (2016-2032)
- Figure 102: APAC Generative AI in Telecom Market Share Comparison by Country (2016-2032)
- Figure 103: APAC Generative AI in Telecom Market Share Comparison by Based On Type (2016-2032)
- Figure 104: APAC Generative AI in Telecom Market Share Comparison by Based On Application (2016-2032)
- Figure 105: APAC Generative AI in Telecom Market Share Comparison by Based On Deployment (2016-2032)
- Figure 106: Latin America Generative AI in Telecom Market Revenue (US$ Mn) Market Share by Based On Typein 2022
- Figure 107: Latin America Generative AI in Telecom Market Attractiveness Analysis by Based On Type, 2016-2032
- Figure 108: Latin America Generative AI in Telecom Market Revenue (US$ Mn) Market Share by Based On Applicationin 2022
- Figure 109: Latin America Generative AI in Telecom Market Attractiveness Analysis by Based On Application, 2016-2032
- Figure 110: Latin America Generative AI in Telecom Market Revenue (US$ Mn) Market Share by Based On Deploymentin 2022
- Figure 111: Latin America Generative AI in Telecom Market Attractiveness Analysis by Based On Deployment, 2016-2032
- Figure 112: Latin America Generative AI in Telecom Market Revenue (US$ Mn) Market Share by Country in 2022
- Figure 113: Latin America Generative AI in Telecom Market Attractiveness Analysis by Country, 2016-2032
- Figure 114: Latin America Generative AI in Telecom Market Revenue (US$ Mn) (2016-2032)
- Figure 115: Latin America Generative AI in Telecom Market Revenue (US$ Mn) Comparison by Country (2016-2032)
- Figure 116: Latin America Generative AI in Telecom Market Revenue (US$ Mn) Comparison by Based On Type (2016-2032)
- Figure 117: Latin America Generative AI in Telecom Market Revenue (US$ Mn) Comparison by Based On Application (2016-2032)
- Figure 118: Latin America Generative AI in Telecom Market Revenue (US$ Mn) Comparison by Based On Deployment (2016-2032)
- Figure 119: Latin America Generative AI in Telecom Market Y-o-Y Growth Rate Comparison by Country (2016-2032)
- Figure 120: Latin America Generative AI in Telecom Market Y-o-Y Growth Rate Comparison by Based On Type (2016-2032)
- Figure 121: Latin America Generative AI in Telecom Market Y-o-Y Growth Rate Comparison by Based On Application (2016-2032)
- Figure 122: Latin America Generative AI in Telecom Market Y-o-Y Growth Rate Comparison by Based On Deployment (2016-2032)
- Figure 123: Latin America Generative AI in Telecom Market Share Comparison by Country (2016-2032)
- Figure 124: Latin America Generative AI in Telecom Market Share Comparison by Based On Type (2016-2032)
- Figure 125: Latin America Generative AI in Telecom Market Share Comparison by Based On Application (2016-2032)
- Figure 126: Latin America Generative AI in Telecom Market Share Comparison by Based On Deployment (2016-2032)
- Figure 127: Middle East & Africa Generative AI in Telecom Market Revenue (US$ Mn) Market Share by Based On Typein 2022
- Figure 128: Middle East & Africa Generative AI in Telecom Market Attractiveness Analysis by Based On Type, 2016-2032
- Figure 129: Middle East & Africa Generative AI in Telecom Market Revenue (US$ Mn) Market Share by Based On Applicationin 2022
- Figure 130: Middle East & Africa Generative AI in Telecom Market Attractiveness Analysis by Based On Application, 2016-2032
- Figure 131: Middle East & Africa Generative AI in Telecom Market Revenue (US$ Mn) Market Share by Based On Deploymentin 2022
- Figure 132: Middle East & Africa Generative AI in Telecom Market Attractiveness Analysis by Based On Deployment, 2016-2032
- Figure 133: Middle East & Africa Generative AI in Telecom Market Revenue (US$ Mn) Market Share by Country in 2022
- Figure 134: Middle East & Africa Generative AI in Telecom Market Attractiveness Analysis by Country, 2016-2032
- Figure 135: Middle East & Africa Generative AI in Telecom Market Revenue (US$ Mn) (2016-2032)
- Figure 136: Middle East & Africa Generative AI in Telecom Market Revenue (US$ Mn) Comparison by Country (2016-2032)
- Figure 137: Middle East & Africa Generative AI in Telecom Market Revenue (US$ Mn) Comparison by Based On Type (2016-2032)
- Figure 138: Middle East & Africa Generative AI in Telecom Market Revenue (US$ Mn) Comparison by Based On Application (2016-2032)
- Figure 139: Middle East & Africa Generative AI in Telecom Market Revenue (US$ Mn) Comparison by Based On Deployment (2016-2032)
- Figure 140: Middle East & Africa Generative AI in Telecom Market Y-o-Y Growth Rate Comparison by Country (2016-2032)
- Figure 141: Middle East & Africa Generative AI in Telecom Market Y-o-Y Growth Rate Comparison by Based On Type (2016-2032)
- Figure 142: Middle East & Africa Generative AI in Telecom Market Y-o-Y Growth Rate Comparison by Based On Application (2016-2032)
- Figure 143: Middle East & Africa Generative AI in Telecom Market Y-o-Y Growth Rate Comparison by Based On Deployment (2016-2032)
- Figure 144: Middle East & Africa Generative AI in Telecom Market Share Comparison by Country (2016-2032)
- Figure 145: Middle East & Africa Generative AI in Telecom Market Share Comparison by Based On Type (2016-2032)
- Figure 146: Middle East & Africa Generative AI in Telecom Market Share Comparison by Based On Application (2016-2032)
- Figure 147: Middle East & Africa Generative AI in Telecom Market Share Comparison by Based On Deployment (2016-2032)
- List of Tables
- Table 1: Global Generative AI in Telecom Market Comparison by Based On Type (2016-2032)
- Table 2: Global Generative AI in Telecom Market Comparison by Based On Application (2016-2032)
- Table 3: Global Generative AI in Telecom Market Comparison by Based On Deployment (2016-2032)
- Table 4: Global Generative AI in Telecom Market Revenue (US$ Mn) Comparison by Region (2016-2032)
- Table 5: Global Generative AI in Telecom Market Revenue (US$ Mn) (2016-2032)
- Table 6: Global Generative AI in Telecom Market Revenue (US$ Mn) Comparison by Region (2016-2032)
- Table 7: Global Generative AI in Telecom Market Revenue (US$ Mn) Comparison by Based On Type (2016-2032)
- Table 8: Global Generative AI in Telecom Market Revenue (US$ Mn) Comparison by Based On Application (2016-2032)
- Table 9: Global Generative AI in Telecom Market Revenue (US$ Mn) Comparison by Based On Deployment (2016-2032)
- Table 10: Global Generative AI in Telecom Market Y-o-Y Growth Rate Comparison by Region (2016-2032)
- Table 11: Global Generative AI in Telecom Market Y-o-Y Growth Rate Comparison by Based On Type (2016-2032)
- Table 12: Global Generative AI in Telecom Market Y-o-Y Growth Rate Comparison by Based On Application (2016-2032)
- Table 13: Global Generative AI in Telecom Market Y-o-Y Growth Rate Comparison by Based On Deployment (2016-2032)
- Table 14: Global Generative AI in Telecom Market Share Comparison by Region (2016-2032)
- Table 15: Global Generative AI in Telecom Market Share Comparison by Based On Type (2016-2032)
- Table 16: Global Generative AI in Telecom Market Share Comparison by Based On Application (2016-2032)
- Table 17: Global Generative AI in Telecom Market Share Comparison by Based On Deployment (2016-2032)
- Table 18: North America Generative AI in Telecom Market Comparison by Based On Application (2016-2032)
- Table 19: North America Generative AI in Telecom Market Comparison by Based On Deployment (2016-2032)
- Table 20: North America Generative AI in Telecom Market Revenue (US$ Mn) Comparison by Country (2016-2032)
- Table 21: North America Generative AI in Telecom Market Revenue (US$ Mn) (2016-2032)
- Table 22: North America Generative AI in Telecom Market Revenue (US$ Mn) Comparison by Country (2016-2032)
- Table 23: North America Generative AI in Telecom Market Revenue (US$ Mn) Comparison by Based On Type (2016-2032)
- Table 24: North America Generative AI in Telecom Market Revenue (US$ Mn) Comparison by Based On Application (2016-2032)
- Table 25: North America Generative AI in Telecom Market Revenue (US$ Mn) Comparison by Based On Deployment (2016-2032)
- Table 26: North America Generative AI in Telecom Market Y-o-Y Growth Rate Comparison by Country (2016-2032)
- Table 27: North America Generative AI in Telecom Market Y-o-Y Growth Rate Comparison by Based On Type (2016-2032)
- Table 28: North America Generative AI in Telecom Market Y-o-Y Growth Rate Comparison by Based On Application (2016-2032)
- Table 29: North America Generative AI in Telecom Market Y-o-Y Growth Rate Comparison by Based On Deployment (2016-2032)
- Table 30: North America Generative AI in Telecom Market Share Comparison by Country (2016-2032)
- Table 31: North America Generative AI in Telecom Market Share Comparison by Based On Type (2016-2032)
- Table 32: North America Generative AI in Telecom Market Share Comparison by Based On Application (2016-2032)
- Table 33: North America Generative AI in Telecom Market Share Comparison by Based On Deployment (2016-2032)
- Table 34: Western Europe Generative AI in Telecom Market Comparison by Based On Type (2016-2032)
- Table 35: Western Europe Generative AI in Telecom Market Comparison by Based On Application (2016-2032)
- Table 36: Western Europe Generative AI in Telecom Market Comparison by Based On Deployment (2016-2032)
- Table 37: Western Europe Generative AI in Telecom Market Revenue (US$ Mn) Comparison by Country (2016-2032)
- Table 38: Western Europe Generative AI in Telecom Market Revenue (US$ Mn) (2016-2032)
- Table 39: Western Europe Generative AI in Telecom Market Revenue (US$ Mn) Comparison by Country (2016-2032)
- Table 40: Western Europe Generative AI in Telecom Market Revenue (US$ Mn) Comparison by Based On Type (2016-2032)
- Table 41: Western Europe Generative AI in Telecom Market Revenue (US$ Mn) Comparison by Based On Application (2016-2032)
- Table 42: Western Europe Generative AI in Telecom Market Revenue (US$ Mn) Comparison by Based On Deployment (2016-2032)
- Table 43: Western Europe Generative AI in Telecom Market Y-o-Y Growth Rate Comparison by Country (2016-2032)
- Table 44: Western Europe Generative AI in Telecom Market Y-o-Y Growth Rate Comparison by Based On Type (2016-2032)
- Table 45: Western Europe Generative AI in Telecom Market Y-o-Y Growth Rate Comparison by Based On Application (2016-2032)
- Table 46: Western Europe Generative AI in Telecom Market Y-o-Y Growth Rate Comparison by Based On Deployment (2016-2032)
- Table 47: Western Europe Generative AI in Telecom Market Share Comparison by Country (2016-2032)
- Table 48: Western Europe Generative AI in Telecom Market Share Comparison by Based On Type (2016-2032)
- Table 49: Western Europe Generative AI in Telecom Market Share Comparison by Based On Application (2016-2032)
- Table 50: Western Europe Generative AI in Telecom Market Share Comparison by Based On Deployment (2016-2032)
- Table 51: Eastern Europe Generative AI in Telecom Market Comparison by Based On Type (2016-2032)
- Table 52: Eastern Europe Generative AI in Telecom Market Comparison by Based On Application (2016-2032)
- Table 53: Eastern Europe Generative AI in Telecom Market Comparison by Based On Deployment (2016-2032)
- Table 54: Eastern Europe Generative AI in Telecom Market Revenue (US$ Mn) Comparison by Country (2016-2032)
- Table 55: Eastern Europe Generative AI in Telecom Market Revenue (US$ Mn) (2016-2032)
- Table 56: Eastern Europe Generative AI in Telecom Market Revenue (US$ Mn) Comparison by Country (2016-2032)
- Table 57: Eastern Europe Generative AI in Telecom Market Revenue (US$ Mn) Comparison by Based On Type (2016-2032)
- Table 58: Eastern Europe Generative AI in Telecom Market Revenue (US$ Mn) Comparison by Based On Application (2016-2032)
- Table 59: Eastern Europe Generative AI in Telecom Market Revenue (US$ Mn) Comparison by Based On Deployment (2016-2032)
- Table 60: Eastern Europe Generative AI in Telecom Market Y-o-Y Growth Rate Comparison by Country (2016-2032)
- Table 61: Eastern Europe Generative AI in Telecom Market Y-o-Y Growth Rate Comparison by Based On Type (2016-2032)
- Table 62: Eastern Europe Generative AI in Telecom Market Y-o-Y Growth Rate Comparison by Based On Application (2016-2032)
- Table 63: Eastern Europe Generative AI in Telecom Market Y-o-Y Growth Rate Comparison by Based On Deployment (2016-2032)
- Table 64: Eastern Europe Generative AI in Telecom Market Share Comparison by Country (2016-2032)
- Table 65: Eastern Europe Generative AI in Telecom Market Share Comparison by Based On Type (2016-2032)
- Table 66: Eastern Europe Generative AI in Telecom Market Share Comparison by Based On Application (2016-2032)
- Table 67: Eastern Europe Generative AI in Telecom Market Share Comparison by Based On Deployment (2016-2032)
- Table 68: APAC Generative AI in Telecom Market Comparison by Based On Type (2016-2032)
- Table 69: APAC Generative AI in Telecom Market Comparison by Based On Application (2016-2032)
- Table 70: APAC Generative AI in Telecom Market Comparison by Based On Deployment (2016-2032)
- Table 71: APAC Generative AI in Telecom Market Revenue (US$ Mn) Comparison by Country (2016-2032)
- Table 72: APAC Generative AI in Telecom Market Revenue (US$ Mn) (2016-2032)
- Table 73: APAC Generative AI in Telecom Market Revenue (US$ Mn) Comparison by Country (2016-2032)
- Table 74: APAC Generative AI in Telecom Market Revenue (US$ Mn) Comparison by Based On Type (2016-2032)
- Table 75: APAC Generative AI in Telecom Market Revenue (US$ Mn) Comparison by Based On Application (2016-2032)
- Table 76: APAC Generative AI in Telecom Market Revenue (US$ Mn) Comparison by Based On Deployment (2016-2032)
- Table 77: APAC Generative AI in Telecom Market Y-o-Y Growth Rate Comparison by Country (2016-2032)
- Table 78: APAC Generative AI in Telecom Market Y-o-Y Growth Rate Comparison by Based On Type (2016-2032)
- Table 79: APAC Generative AI in Telecom Market Y-o-Y Growth Rate Comparison by Based On Application (2016-2032)
- Table 80: APAC Generative AI in Telecom Market Y-o-Y Growth Rate Comparison by Based On Deployment (2016-2032)
- Table 81: APAC Generative AI in Telecom Market Share Comparison by Country (2016-2032)
- Table 82: APAC Generative AI in Telecom Market Share Comparison by Based On Type (2016-2032)
- Table 83: APAC Generative AI in Telecom Market Share Comparison by Based On Application (2016-2032)
- Table 84: APAC Generative AI in Telecom Market Share Comparison by Based On Deployment (2016-2032)
- Table 85: Latin America Generative AI in Telecom Market Comparison by Based On Type (2016-2032)
- Table 86: Latin America Generative AI in Telecom Market Comparison by Based On Application (2016-2032)
- Table 87: Latin America Generative AI in Telecom Market Comparison by Based On Deployment (2016-2032)
- Table 88: Latin America Generative AI in Telecom Market Revenue (US$ Mn) Comparison by Country (2016-2032)
- Table 89: Latin America Generative AI in Telecom Market Revenue (US$ Mn) (2016-2032)
- Table 90: Latin America Generative AI in Telecom Market Revenue (US$ Mn) Comparison by Country (2016-2032)
- Table 91: Latin America Generative AI in Telecom Market Revenue (US$ Mn) Comparison by Based On Type (2016-2032)
- Table 92: Latin America Generative AI in Telecom Market Revenue (US$ Mn) Comparison by Based On Application (2016-2032)
- Table 93: Latin America Generative AI in Telecom Market Revenue (US$ Mn) Comparison by Based On Deployment (2016-2032)
- Table 94: Latin America Generative AI in Telecom Market Y-o-Y Growth Rate Comparison by Country (2016-2032)
- Table 95: Latin America Generative AI in Telecom Market Y-o-Y Growth Rate Comparison by Based On Type (2016-2032)
- Table 96: Latin America Generative AI in Telecom Market Y-o-Y Growth Rate Comparison by Based On Application (2016-2032)
- Table 97: Latin America Generative AI in Telecom Market Y-o-Y Growth Rate Comparison by Based On Deployment (2016-2032)
- Table 98: Latin America Generative AI in Telecom Market Share Comparison by Country (2016-2032)
- Table 99: Latin America Generative AI in Telecom Market Share Comparison by Based On Type (2016-2032)
- Table 100: Latin America Generative AI in Telecom Market Share Comparison by Based On Application (2016-2032)
- Table 101: Latin America Generative AI in Telecom Market Share Comparison by Based On Deployment (2016-2032)
- Table 102: Middle East & Africa Generative AI in Telecom Market Comparison by Based On Type (2016-2032)
- Table 103: Middle East & Africa Generative AI in Telecom Market Comparison by Based On Application (2016-2032)
- Table 104: Middle East & Africa Generative AI in Telecom Market Comparison by Based On Deployment (2016-2032)
- Table 105: Middle East & Africa Generative AI in Telecom Market Revenue (US$ Mn) Comparison by Country (2016-2032)
- Table 106: Middle East & Africa Generative AI in Telecom Market Revenue (US$ Mn) (2016-2032)
- Table 107: Middle East & Africa Generative AI in Telecom Market Revenue (US$ Mn) Comparison by Country (2016-2032)
- Table 108: Middle East & Africa Generative AI in Telecom Market Revenue (US$ Mn) Comparison by Based On Type (2016-2032)
- Table 109: Middle East & Africa Generative AI in Telecom Market Revenue (US$ Mn) Comparison by Based On Application (2016-2032)
- Table 110: Middle East & Africa Generative AI in Telecom Market Revenue (US$ Mn) Comparison by Based On Deployment (2016-2032)
- Table 111: Middle East & Africa Generative AI in Telecom Market Y-o-Y Growth Rate Comparison by Country (2016-2032)
- Table 112: Middle East & Africa Generative AI in Telecom Market Y-o-Y Growth Rate Comparison by Based On Type (2016-2032)
- Table 113: Middle East & Africa Generative AI in Telecom Market Y-o-Y Growth Rate Comparison by Based On Application (2016-2032)
- Table 114: Middle East & Africa Generative AI in Telecom Market Y-o-Y Growth Rate Comparison by Based On Deployment (2016-2032)
- Table 115: Middle East & Africa Generative AI in Telecom Market Share Comparison by Country (2016-2032)
- Table 116: Middle East & Africa Generative AI in Telecom Market Share Comparison by Based On Type (2016-2032)
- Table 117: Middle East & Africa Generative AI in Telecom Market Share Comparison by Based On Application (2016-2032)
- Table 118: Middle East & Africa Generative AI in Telecom Market Share Comparison by Based On Deployment (2016-2032)
- 1. Executive Summary
-
- IBM
- LeewayHertz
- Nokia
- Ericsson
- Cisco Systems
- Amdocs
- C3.ai, Inc.
- Ciena
- ZTE Corporation
- Infosys
- Altran (part of Capgemini)
- Ribbon Communications
- Aria Networks
- Guavus (a Thales company)
- Netcracker Technology (a subsidiary of NEC Corporation)
- Cresta
- Other key players
Our Clients


View Our Licence Options
