
Generative AI in Energy Market Based on Component Type(Services, Solution), Based on Application(Demand Forecasting, Robotics, Renewables Management, Safety and Security, Other Applications), Based on End-Use Vertical(Energy Generation, Energy Transmission, Energy Distribution, Utilities, Other End-Use Verticals), By Region And Companies - Industry Segment Outlook, Market Assessment, Competition Scenario, Trends, And Forecast 2024-2033
-
38090
-
Feb 2024
-
159
-


-
This report was compiled by Vishwa Gaul Vishwa is an experienced market research and consulting professional with over 8 years of expertise in the ICT industry, contributing to over 700 reports across telecommunications, software, hardware, and digital solutions. Correspondence Team Lead- ICT Linkedin | Detailed Market research Methodology Our methodology involves a mix of primary research, including interviews with leading mental health experts, and secondary research from reputable medical journals and databases. View Detailed Methodology Page
-
Quick Navigation
Report Overview
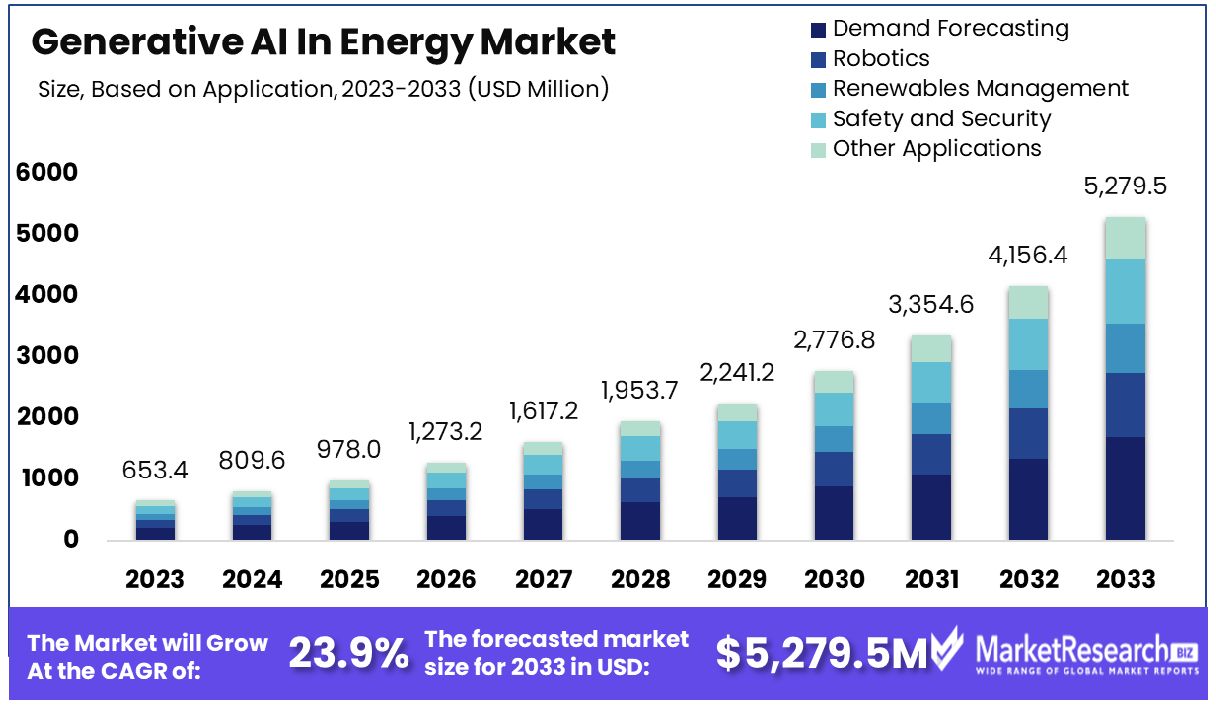
The Generative AI in Energy Market was valued at USD 653.4 million in 2023. It is expected to reach USD 5,279.5 million by 2033, with a CAGR of 23.9% during the forecast period from 2024 to 2033.
The Generative AI in Energy Market refers to the burgeoning sector focused on the application of advanced artificial intelligence technologies, specifically generative models, within the energy industry. These AI systems are designed to simulate, predict, and optimize energy production, distribution, and consumption processes. By leveraging deep learning algorithms, generative AI facilitates the creation of highly efficient energy solutions, predictive maintenance, and innovative energy generation models, enhancing operational efficiency and reducing costs.
This market segment is pivotal for energy companies, technology providers, and policymakers aiming to achieve sustainability goals, drive innovation, and enhance competitiveness. Key stakeholders are increasingly recognizing the strategic value of integrating generative AI into their operations to propel the energy sector towards a more adaptive, resilient, and sustainable future.
An innovative AI within the Energy Market is anticipated to witness a transformational increase because of the necessity to improve effectiveness, efficiency, and sustainability and innovation and sustainable development in the field. As organizations strive to navigate the complexities of energy transition, generative AI emerges as a critical tool for optimizing energy production, energy firms' distribution, and consumption.
This market's potential is underscored by the anticipated surge in solar electricity generation within the U.S. electric power sector, projected to increase by 43% in 2024, an addition of 70 billion kilowatt-hours (BkWh). Such data points not only highlight the rapid ascendancy of renewable energy generation sources but also underscore the necessity for advanced analytical tools to manage this growth effectively.
The shift away from fossil fuels, with fossil gas generation accounting for 22% of global flexible electricity generation in 2022, to renewables and nuclear energy, expected to meet over 90% of the incremental demand by 2025, presents both challenges and opportunities. Wind and solar panel capacities are expanding at a pace poised to outstrip the growth in annual electricity demand by the end of 2023. This shift necessitates sophisticated generative AI applications capable of predictive modeling and operational optimization to ensure grid stability and efficiency.
From a perspective of strategic importance from a strategic perspective, the incorporation of generative AI for the energy industry allows stakeholders to detect fluctuations in demand, maximize the production of renewable energy, and help improve grid management. It is a strategic imperative to invest in generative AI capabilities to not only keep pace with the rapid growth of renewables but also to drive innovation, operational excellence, and sustainability in energy management practices.
Key Takeaways
- Market Growth: The Generative ai in energy market was valued at USD 653.4 million in 2023. It is expected to reach USD 5,279.5 million by 2033, with a CAGR of 23.9% during the forecast period from 2024 to 2033.
- Based on Component Type Analysis: Services lead with a robust 24.1% CAGR, signaling strong growth in AI applications.
- Based on Application Analysis: Demand forecasting commands a 30% market share, indicating its critical role in energy planning.
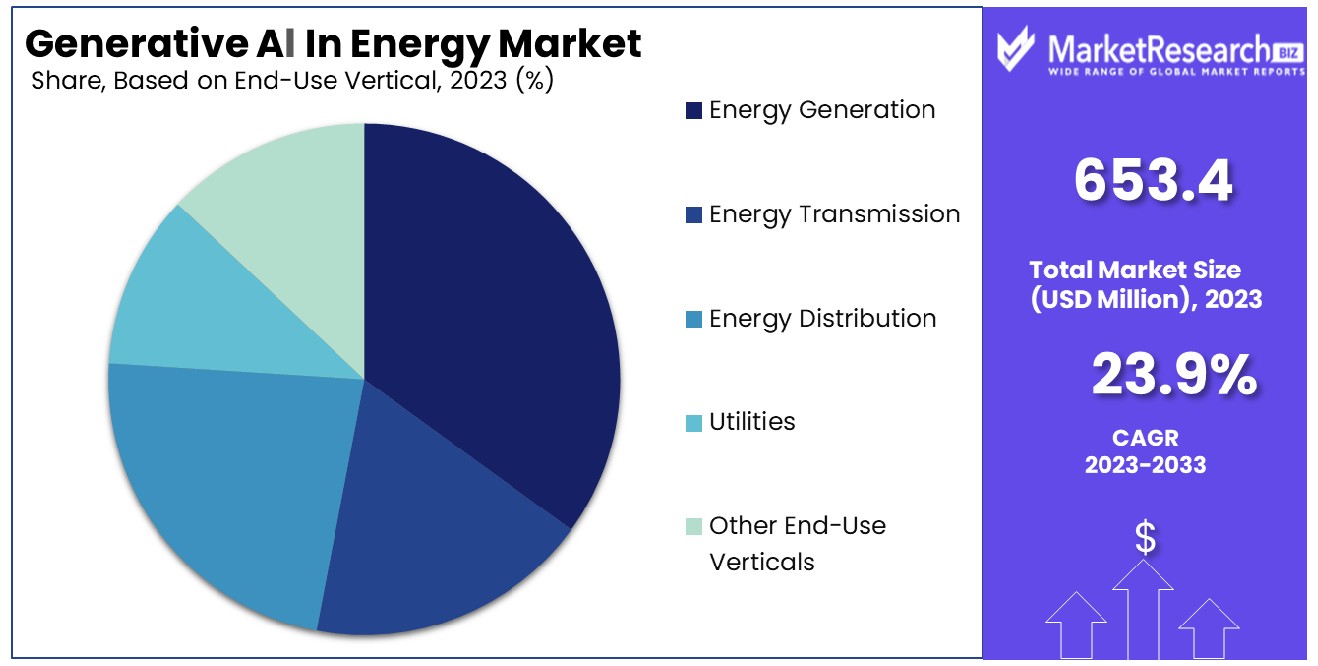
- Based on End-Use Vertical Analysis: Energy generation follows closely, holding a 27% market share, showcasing its importance in the AI-driven market.
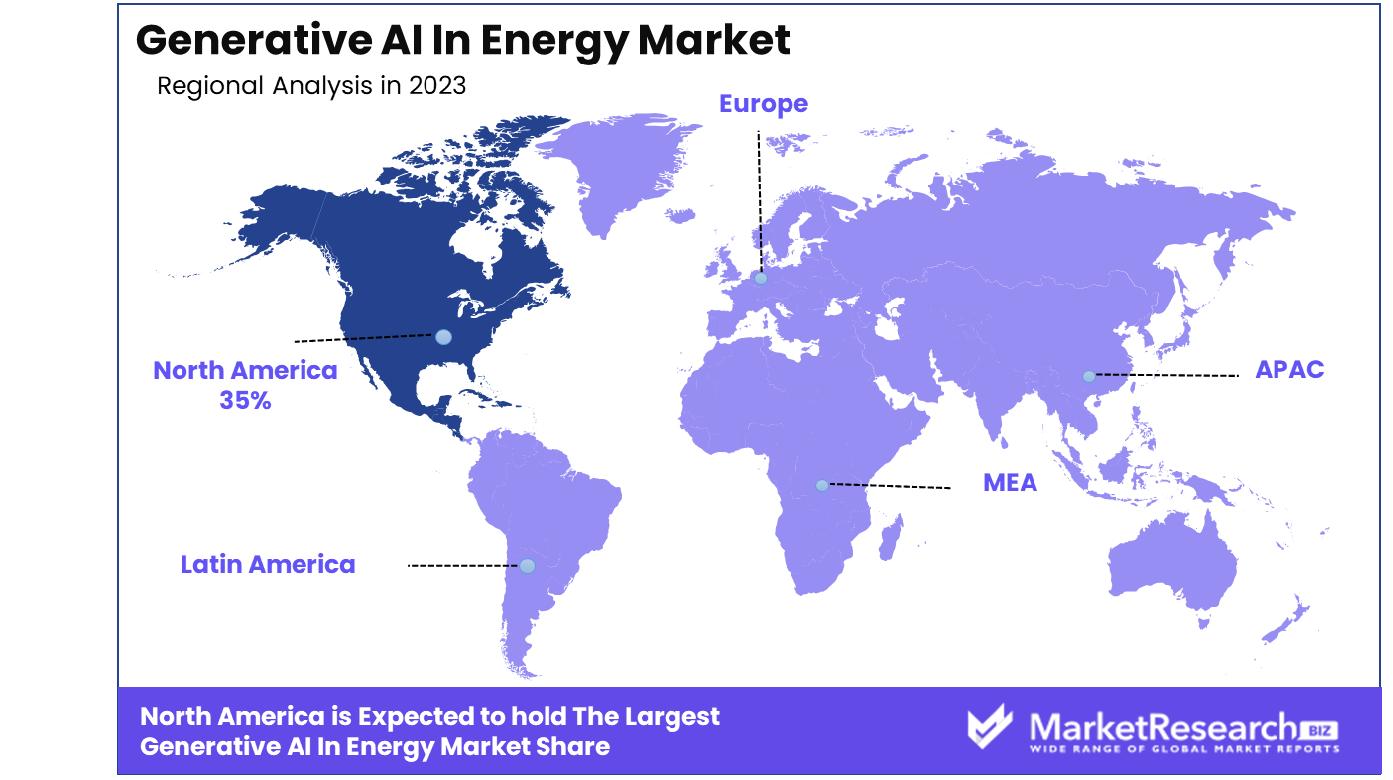
- Regional Dominance: North America leads the market, holding a 35% share, reflecting its pioneering role in technological adoption.
- Growth Opportunity: Generative AI reduces downtime and operating costs, enhancing efficiency, reliability, and market competitiveness for energy providers.
Driving factors
Predictive Grid Maintenance Drives Market Growth
Predictive grid maintenance, facilitated by generative AI, marks a pivotal advancement in enhancing the energy sector's operational efficiency and reliability. By leveraging AI models that analyze sensor data to preemptively identify and address equipment anomalies, this approach significantly minimizes downtime and ensures a more reliable power supply. The integration of such AI technologies not only optimizes maintenance schedules but also extends the lifespan of critical infrastructure, thereby reducing long-term capital expenditure.
The consequential boost in uptime directly translates to enhanced service quality, fostering consumer trust and satisfaction. Furthermore, as these AI-driven insights become increasingly sophisticated, they pave the way for a more resilient and adaptable energy grid, positioning the industry to effectively meet evolving demand and integrate renewable energy sources, thus propelling the market growth.
Optimized Energy Trading Drives Market Growth
Generative AI's role in optimizing energy trading strategies represents a transformative force in the energy market. By analyzing multifaceted variables and potential scenarios, AI enables traders to make informed decisions that balance cost efficiency with risk management. This not only enhances profitability but also contributes to market stability by enabling more precise forecasting and strategic planning.
The ability of AI to develop advanced bidding strategies in electricity markets exemplifies its capacity to adapt to and capitalize on market fluctuations, thereby optimizing financial outcomes for energy providers. This strategic edge, provided by AI, encourages a more dynamic and competitive market landscape. Over the long term, the adoption of AI-driven trading solutions is expected to catalyze innovations in financial models and trading mechanisms within the energy sector, further stimulating market expansion.
Personalized Pricing Drives Market Growth
The introduction of generative AI into the development of personalized pricing and energy plans represents a significant leap forward in customer-centric service delivery within the energy sector. By utilizing detailed individual usage data, AI algorithms can tailor pricing schemes and energy solutions to match consumer behavior and preferences, promoting efficiency and satisfaction. This customization supports demand-side management, allowing energy providers to balance load more effectively while fostering consumer engagement and loyalty.
The shift towards personalized energy solutions reflects a broader trend toward digitalization and customer empowerment in the energy market. As these AI-driven models become more refined, they offer the potential to revolutionize energy consumption patterns, encouraging energy conservation and facilitating the integration of renewable energy sources. The long-term implications include a more flexible, responsive, and sustainable energy ecosystem, underpinning broader market growth.
Restraining Factors
Cybersecurity Risks Restrain Market Growth
The introduction of generative AI into the energy sector and its promise of better efficiency and predictive capabilities raises serious cybersecurity issues. The reliance on extensive data flows and interconnected systems increases the vulnerability of energy grids to cyberattacks, which could have catastrophic outcomes given the critical nature of energy infrastructure. The necessity for stringent security measures to mitigate these risks often curtails the full potential application of AI technologies, particularly in areas requiring remote automated controls.
This protective stance, while essential for safeguarding infrastructure, inadvertently hampers the adoption of AI solutions, limiting the market's growth potential. The balance between innovation and security remains a delicate one, with cybersecurity concerns acting as a substantial barrier to the widespread deployment of generative AI in the energy industry.
High Capital Costs Restrain Market Growth
The deployment of generative AI technologies in the energy market is significantly hindered by the high capital investments required for the necessary infrastructure, such as sensors, meters, and advanced software platforms. These technologies are critical for gathering the high-quality data essential for training AI models and integrating them with existing legacy systems. The substantial upfront costs associated with these implementations pose a particularly daunting barrier for smaller utilities, which may lack the financial resources to invest in such advanced technologies.
This financial constraint not only slows the pace of AI adoption across the sector but also widens the technological divide between large and small energy providers, thus restraining market growth. The financial burden of large initial investment requirements highlights one of the major limitations in the general application and scalability of generative AI solutions in the energy industry.
Based on Component Type Analysis
The services sector exhibits a dominant CAGR of 24.1% growth.
Within the component type segment, services emerge as the dominant force, boasting a Compound Annual Growth Rate (CAGR) of 24.1%. This robust growth is indicative of the increasing reliance on specialized services such as integration, support, and maintenance, which are critical for the successful deployment and operation of generative AI technologies in the energy sector. Services play a pivotal role in facilitating the seamless integration of AI solutions into existing energy storage operations systems, offering expertise that ensures optimal performance, reliability, and adaptation to evolving market needs.
The services segment's dominance is further underscored by the complex nature of generative AI applications, requiring ongoing updates, training, and customization to meet specific industry demands. This necessity for specialized support drives the demand for services, positioning them as an indispensable component of the generative AI ecosystem in dynamic energy markets.
In contrast, the solutions segment, although not the dominant sub-segment, holds significant importance in providing the foundational technology and software that enable generative AI capabilities. Solutions such as AI platforms, tools, and algorithms are crucial for analyzing data, generating insights, and automating processes within the energy sector. The symbiotic relationship between services and solutions underscores a comprehensive approach to implementing generative AI, where each plays a vital role in fostering market growth.
Based on Application Analysis
Demand Forecasting holds a dominant 30% market share.
Demand forecasting stands out as the dominant application, commanding a market share of 30% alongside a CAGR of 24.1%. This preeminence is attributed to the critical role of accurate demand predictions in optimizing energy production, distribution, and consumption. Generative AI's ability to analyze vast datasets and predict future energy needs with high precision is invaluable for enhancing efficiency, reducing waste, and supporting decision-making processes.
This application's significance is magnified in the context of the energy transition, where the integration of renewable sources and the need for grid stability present complex challenges. Demand forecasting offers a proactive tool for balancing supply and demand, facilitating the effective management of resources, and contributing to a more sustainable and resilient energy ecosystem.
Other applications, including robotics, renewables management, safety, security, and various emerging technologies, collectively contribute to the diversification and enrichment of the generative AI landscape in energy. Each segment plays a unique role in addressing specific operational, maintenance, and safety challenges, thereby complementing demand forecasting and enhancing the overall value proposition of generative AI in this sector.
Based on End-Use Vertical Analysis
Energy Generation commands a 27% share, showcasing dominance.
Energy generation emerges as the dominant end-use vertical, with a market share of 27% and a projected CAGR of 20.3%. This segment's leadership is largely due to the critical need for optimizing energy production processes, improving plant efficiency, and integrating renewable energy sources. Generative AI applications in energy generation, such as predictive maintenance, operational optimization, and capacity forecasting, are pivotal in achieving these objectives.
The dominant position of energy generation is reinforced by the sector's direct impact on overall energy availability and sustainability. As the foundation of the energy value chain, improvements in generation efficiency and flexibility have far-reaching effects on transmission, distribution, and consumption patterns.
While the energy generation segment leads the way, other end-use verticals like energy transmission, distribution, utilities, and various specialized areas contribute to the comprehensive adoption and implementation of generative AI technologies.
Each vertical addresses distinct aspects of the energy ecosystem, from ensuring the reliability and security of power transmission to enhancing customer service and operational efficiency in utilities. Together, they illustrate the diversity of AI that is generative in the energy industry and show a market that has a lot of creativity and diversity.
Key Market Segments
Based on Component Type
- Services
- Solution
Based on Application
- Demand Forecasting
- Robotics
- Renewables Management
- Safety and Security
- Other Applications
Based on End-Use Vertical
- Energy Generation
- Energy Transmission
- Energy Distribution
- Utilities
- Other End-Use Verticals
Growth Opportunity
Reduced Equipment Downtime Offers Growth Opportunities
The use of intelligent AI to assist with predictive maintenance in the energy industry significantly decreases the time it takes for equipment to be down, presenting significant growth opportunities. This technology's capacity to analyze data and identify potential faults before they lead to failures enables utilities to minimize costly outages and adhere to uptime objectives. For instance, AI's ability to detect anomalies in transformer vibrations can preemptively address issues, averting potential breakdowns.
This proactive maintenance approach not only saves on repair costs but also enhances operational efficiency, leading to improved reliability and customer satisfaction. By avoiding revenue losses associated with unscheduled downtimes, energy providers can allocate resources more effectively, fostering an environment conducive to growth and innovation. This advantage in competition is a testimony to the transformative effect that Generative AI on the power industry. It also offers the potential to increase efficiency and competitiveness.
Lower Operating Costs Offers Growth Opportunity
Generative AI's role in streamlining operations within the energy sector by optimizing demand forecasting, spot market trading, and automating processes presents a significant opportunity for reducing operating costs. The deployment of AI algorithms for tasks such as fuel procurement optimization for coal power plants exemplifies the potential for substantial cost savings.
By improving the accuracy of demand forecasts, energy providers can better manage their resources, reducing the need for expensive, last-minute adjustments. Similarly, AI-enhanced spot market trading strategies enable more effective risk management and cost efficiency. The automation of routine processes further reduces labor costs and minimizes errors, contributing to overall operational efficiency.
This confluence of factors facilitated by generative AI not only lowers the operational expenditures for energy companies but also enhances their agility and responsiveness to market dynamics. Cost reductions and improved operations create an environment that is conducive to growth, investment, and innovation within the field. This highlights the importance of AI to influence our energy future.
Latest Trends
AI-Driven Renewable Energy Forecasting
The integration of Generative AI for forecasting renewable energy is a significant development in the field of energy. This technology has been increasingly adopted to predict solar and wind power generation with remarkable accuracy. By analyzing vast datasets, including historical weather patterns and real-time environmental conditions, Generative AI models can produce highly accurate energy resource output forecasts.
This advancement enables energy providers to optimize grid operations and enhance the efficiency of renewable energy distribution, thus supporting the transition towards sustainable energy sources.
Generative AI in Energy Consumption Optimization
Another prominent trend is the application of Generative AI in optimizing energy consumption for both industrial and residential sectors. Through the analysis of consumption patterns and the simulation of various scenarios, these AI models can identify potential savings and recommend measures to reduce energy usage without compromising operational efficiency.
This not only leads to significant cost savings but also contributes to the global effort of reducing carbon footprints. Businesses and households alike benefit from tailored energy consumption strategies, fostering a more sustainable and economical energy landscape.
Regional Analysis
North America Dominates with a 35% Market Share
North America's dominant region 35% share of the generative AI in the energy market underscores its leadership role, propelled by several key factors. Foremost among these is the region's robust technological infrastructure, which facilitates the rapid deployment and integration of AI solutions within the energy sector. Additionally, significant investments in research and development, driven by both public and private sectors, have spurred innovation and adoption of generative AI technologies. The presence of leading AI companies and startups in this region further catalyzes market growth by offering advanced solutions tailored to the energy industry's needs.
The regional dynamics, including a highly competitive market environment and stringent regulatory standards, encourage the adoption of efficiency-enhancing and cost-saving technologies. North America's commitment to renewable energy infrastructure solutions and sustainability initiatives also plays a crucial role, as generative AI applications are vital for optimizing energy production, distribution, and consumption in these domains.
As time passes the influence being played on North America in the generative AI market for energy is likely to grow because of the continuous technological advancements as well as the favorable policies and the rising demand for new ways to address the challenges of sustainability and efficiency in energy use. The leadership of North America in the market will encourage more investment and development setting an example for the global application of dynamic AI in the energy sector.
Europe Progresses with Strategic Investments
Europe's strategic focus on sustainability and digitalization has positioned it as a significant player in the generative AI in energy market. The emphasis on the region's renewable energy sources and the shift to digitalization energy market analysis is an important element in the region's dedication to the integration of AI technologies. European Union policies and funding aimed at enhancing energy efficiency and reducing carbon footprints have further accelerated the adoption of generative AI solutions. The collaborative ecosystem, combining governmental support with innovation from leading tech companies and research institutions, fosters a conducive environment for growth and development in this sector.
Asia-Pacific Emerges as a Dynamic Contender
The Asia-Pacific region is rapidly emerging as a dynamic contender in the generative AI in the energy market, driven by its fast-growing economies, increasing energy analyst demands, and substantial investments in digital tools infrastructure. Countries like China and India are at the forefront, leveraging generative AI to optimize their expanding renewable energy sectors and modernize traditional energy systems.
The region's focus on innovation, supported by government initiatives and the presence of fast-growing tech hubs, underlines its potential to significantly influence the global market. Asia-Pacific's diverse and rapidly developing market presents unique opportunities for the application of generative AI in addressing both local and global energy challenges.
Key Regions and Countries
North America
- The US
- Canada
- Rest of North America
Europe
- Germany
- France
- The UK
- Spain
- Netherlands
- Russia
- Italy
- Rest of Europe
Asia-Pacific
- China
- Japan
- Singapore
- Thailand
- South Korea
- Vietnam
- India
- New Zealand
- Rest of Asia Pacific
Latin America
- Mexico
- Brazil
- Rest of Latin America
Middle East & Africa
- Saudi Arabia
- South Africa
- UAE
- Rest of Middle East & Africa
Key Players Analysis
In the rapidly evolving generative AI in the energy market, key players such as SmartCloud Inc., Siemens AG, ATOS SE, Alpiq AG, AppOrchid Inc., General Electric, Schneider Electric, Zen Robotics Ltd, and other significant entities are pivotal in shaping the industry's trajectory. These companies, through strategic positioning and innovative solutions, significantly influence market dynamics, driving forward the integration of AI technologies within the energy sector.
SmartCloud Inc. and AppOrchid Inc., with their focus on cloud-based AI solutions and applications, are enhancing operational efficiencies and predictive analytics capabilities for energy providers. Siemens AG, General Electric, and Schneider Electric, with their extensive industrial expertise, are not only advancing the development of smart and connected sources of energy systems but also emphasizing sustainability and efficiency in energy management.
ATOS SE and Alpiq AG are contributing through their robust IT solutions and services, facilitating the digital transformation of the energy sector. Zen Robotics Ltd, specializing in AI and robotics, is advancing recycling technology and managing waste in the energy field demonstrating the many applications of artificially generative AI.
Market Key Players
- SmartCloud Inc.
- Siemens AG
- ATOS SE
- Alpiq AG
- AppOrchid Inc
- General Electric
- Schneider Electric
- Zen Robotics Ltd
- Other Key Players
Recent Development
- In December 2023, Arkon Energy secured $110 million in private funding led by Bluesky Capital Management, Kestrel 0x1, and Nural Capital for global data center expansion, including a 200-megawatt capacity increase and AI cloud service project development in Norway.
- In December 2023, ANNEA raised $2.9 million in Seed funding led by Voyager Ventures to expand its AI-powered predictive maintenance and performance optimization technology for renewable energy globally.
Report Scope
Report Features Description Market Value (2023) USD 653.4 Million Forecast Revenue (2033) USD 5,279.5 Million CAGR (2024-2032) 23.9% Base Year for Estimation 2023 Historic Period 2016-2023 Forecast Period 2024-2033 Report Coverage Revenue Forecast, Market Dynamics, COVID-19 Impact, Competitive Landscape, Recent Developments Segments Covered Based on Component Type(Services, Solution), Based on Application(Demand Forecasting, Robotics, Renewables Management, Safety and Security, Other Applications), Based on End-Use Vertical(Energy Generation, Energy Transmission, Energy Distribution, Utilities, Other End-Use Verticals) Regional Analysis North America - The US, Canada, Rest of North America, Europe - Germany, France, The UK, Spain, Italy, Russia, Netherlands, Rest of Europe, Asia-Pacific - China, Japan, South Korea, India, New Zealand, Singapore, Thailand, Vietnam, Rest of Asia Pacific, Latin America - Brazil, Mexico, Rest of Latin America, Middle East & Africa - South Africa, Saudi Arabia, UAE, Rest of Middle East & Africa Competitive Landscape SmartCloud Inc., Siemens AG, ATOS SE, Alpiq AG, AppOrchid Inc, General Electric, Schneider Electric, Zen Robotics Ltd, Other Key Players Customization Scope Customization for segments, region/country-level will be provided. Moreover, additional customization can be done based on the requirements. Purchase Options We have three licenses to opt for Single User License, Multi-User License (Up to 5 Users), Corporate Use License (Unlimited User and Printable PDF) -
- 1. Executive Summary
- 1.1. Definition
- 1.2. Taxonomy
- 1.3. Research Scope
- 1.4. Key Analysis
- 1.5. Key Findings by Major Segments
- 1.6. Top strategies by Major Players
- 2. Global Generative AI in Energy Market Overview
- 2.1. Generative AI in Energy Market Dynamics
- 2.1.1. Drivers
- 2.1.2. Opportunities
- 2.1.3. Restraints
- 2.1.4. Challenges
- 2.2. Macro-economic Factors
- 2.3. Regulatory Framework
- 2.4. Market Investment Feasibility Index
- 2.5. PEST Analysis
- 2.6. PORTER’S Five Force Analysis
- 2.7. Drivers & Restraints Impact Analysis
- 2.8. Industry Chain Analysis
- 2.9. Cost Structure Analysis
- 2.10. Marketing Strategy
- 2.11. Russia-Ukraine War Impact Analysis
- 2.12. Opportunity Map Analysis
- 2.13. Market Competition Scenario Analysis
- 2.14. Product Life Cycle Analysis
- 2.15. Opportunity Orbits
- 2.16. Manufacturer Intensity Map
- 2.17. Major Companies sales by Value & Volume
- 2.1. Generative AI in Energy Market Dynamics
- 3. Global Generative AI in Energy Market Analysis, Opportunity and Forecast, 2016-2032
- 3.1. Global Generative AI in Energy Market Analysis, 2016-2021
- 3.2. Global Generative AI in Energy Market Opportunity and Forecast, 2023-2032
- 3.3. Global Generative AI in Energy Market Analysis, Opportunity and Forecast, By Based on Component Type, 2016-2032
- 3.3.1. Global Generative AI in Energy Market Analysis by Based on Component Type: Introduction
- 3.3.2. Market Size Absolute $ Opportunity Analysis and Forecast, By Based on Component Type, 2016-2032
- 3.3.3. Services
- 3.3.4. Solution
- 3.4. Global Generative AI in Energy Market Analysis, Opportunity and Forecast, By Based on Application, 2016-2032
- 3.4.1. Global Generative AI in Energy Market Analysis by Based on Application: Introduction
- 3.4.2. Market Size Absolute $ Opportunity Analysis and Forecast, By Based on Application, 2016-2032
- 3.4.3. Demand Forecasting
- 3.4.4. Robotics
- 3.4.5. Renewables Management
- 3.4.6. Safety and Security
- 3.4.7. Other Applications
- 3.5. Global Generative AI in Energy Market Analysis, Opportunity and Forecast, By Based on End-Use Vertical, 2016-2032
- 3.5.1. Global Generative AI in Energy Market Analysis by Based on End-Use Vertical: Introduction
- 3.5.2. Market Size Absolute $ Opportunity Analysis and Forecast, By Based on End-Use Vertical, 2016-2032
- 3.5.3. Energy Generation
- 3.5.4. Energy Transmission
- 3.5.5. Energy Distribution
- 3.5.6. Utilities
- 3.5.7. Other End-Use Verticals
- 4. North America Generative AI in Energy Market Analysis, Opportunity and Forecast, 2016-2032
- 4.1. North America Generative AI in Energy Market Analysis, 2016-2021
- 4.2. North America Generative AI in Energy Market Opportunity and Forecast, 2023-2032
- 4.3. North America Generative AI in Energy Market Analysis, Opportunity and Forecast, By Based on Component Type, 2016-2032
- 4.3.1. North America Generative AI in Energy Market Analysis by Based on Component Type: Introduction
- 4.3.2. Market Size Absolute $ Opportunity Analysis and Forecast, By Based on Component Type, 2016-2032
- 4.3.3. Services
- 4.3.4. Solution
- 4.4. North America Generative AI in Energy Market Analysis, Opportunity and Forecast, By Based on Application, 2016-2032
- 4.4.1. North America Generative AI in Energy Market Analysis by Based on Application: Introduction
- 4.4.2. Market Size Absolute $ Opportunity Analysis and Forecast, By Based on Application, 2016-2032
- 4.4.3. Demand Forecasting
- 4.4.4. Robotics
- 4.4.5. Renewables Management
- 4.4.6. Safety and Security
- 4.4.7. Other Applications
- 4.5. North America Generative AI in Energy Market Analysis, Opportunity and Forecast, By Based on End-Use Vertical, 2016-2032
- 4.5.1. North America Generative AI in Energy Market Analysis by Based on End-Use Vertical: Introduction
- 4.5.2. Market Size Absolute $ Opportunity Analysis and Forecast, By Based on End-Use Vertical, 2016-2032
- 4.5.3. Energy Generation
- 4.5.4. Energy Transmission
- 4.5.5. Energy Distribution
- 4.5.6. Utilities
- 4.5.7. Other End-Use Verticals
- 4.6. North America Generative AI in Energy Market Analysis, Opportunity and Forecast, By Country , 2016-2032
- 4.6.1. North America Generative AI in Energy Market Analysis by Country : Introduction
- 4.6.2. Market Size Absolute $ Opportunity Analysis and Forecast, Country , 2016-2032
- 4.6.2.1. The US
- 4.6.2.2. Canada
- 4.6.2.3. Mexico
- 5. Western Europe Generative AI in Energy Market Analysis, Opportunity and Forecast, 2016-2032
- 5.1. Western Europe Generative AI in Energy Market Analysis, 2016-2021
- 5.2. Western Europe Generative AI in Energy Market Opportunity and Forecast, 2023-2032
- 5.3. Western Europe Generative AI in Energy Market Analysis, Opportunity and Forecast, By Based on Component Type, 2016-2032
- 5.3.1. Western Europe Generative AI in Energy Market Analysis by Based on Component Type: Introduction
- 5.3.2. Market Size Absolute $ Opportunity Analysis and Forecast, By Based on Component Type, 2016-2032
- 5.3.3. Services
- 5.3.4. Solution
- 5.4. Western Europe Generative AI in Energy Market Analysis, Opportunity and Forecast, By Based on Application, 2016-2032
- 5.4.1. Western Europe Generative AI in Energy Market Analysis by Based on Application: Introduction
- 5.4.2. Market Size Absolute $ Opportunity Analysis and Forecast, By Based on Application, 2016-2032
- 5.4.3. Demand Forecasting
- 5.4.4. Robotics
- 5.4.5. Renewables Management
- 5.4.6. Safety and Security
- 5.4.7. Other Applications
- 5.5. Western Europe Generative AI in Energy Market Analysis, Opportunity and Forecast, By Based on End-Use Vertical, 2016-2032
- 5.5.1. Western Europe Generative AI in Energy Market Analysis by Based on End-Use Vertical: Introduction
- 5.5.2. Market Size Absolute $ Opportunity Analysis and Forecast, By Based on End-Use Vertical, 2016-2032
- 5.5.3. Energy Generation
- 5.5.4. Energy Transmission
- 5.5.5. Energy Distribution
- 5.5.6. Utilities
- 5.5.7. Other End-Use Verticals
- 5.6. Western Europe Generative AI in Energy Market Analysis, Opportunity and Forecast, By Country , 2016-2032
- 5.6.1. Western Europe Generative AI in Energy Market Analysis by Country : Introduction
- 5.6.2. Market Size Absolute $ Opportunity Analysis and Forecast, Country , 2016-2032
- 5.6.2.1. Germany
- 5.6.2.2. France
- 5.6.2.3. The UK
- 5.6.2.4. Spain
- 5.6.2.5. Italy
- 5.6.2.6. Portugal
- 5.6.2.7. Ireland
- 5.6.2.8. Austria
- 5.6.2.9. Switzerland
- 5.6.2.10. Benelux
- 5.6.2.11. Nordic
- 5.6.2.12. Rest of Western Europe
- 6. Eastern Europe Generative AI in Energy Market Analysis, Opportunity and Forecast, 2016-2032
- 6.1. Eastern Europe Generative AI in Energy Market Analysis, 2016-2021
- 6.2. Eastern Europe Generative AI in Energy Market Opportunity and Forecast, 2023-2032
- 6.3. Eastern Europe Generative AI in Energy Market Analysis, Opportunity and Forecast, By Based on Component Type, 2016-2032
- 6.3.1. Eastern Europe Generative AI in Energy Market Analysis by Based on Component Type: Introduction
- 6.3.2. Market Size Absolute $ Opportunity Analysis and Forecast, By Based on Component Type, 2016-2032
- 6.3.3. Services
- 6.3.4. Solution
- 6.4. Eastern Europe Generative AI in Energy Market Analysis, Opportunity and Forecast, By Based on Application, 2016-2032
- 6.4.1. Eastern Europe Generative AI in Energy Market Analysis by Based on Application: Introduction
- 6.4.2. Market Size Absolute $ Opportunity Analysis and Forecast, By Based on Application, 2016-2032
- 6.4.3. Demand Forecasting
- 6.4.4. Robotics
- 6.4.5. Renewables Management
- 6.4.6. Safety and Security
- 6.4.7. Other Applications
- 6.5. Eastern Europe Generative AI in Energy Market Analysis, Opportunity and Forecast, By Based on End-Use Vertical, 2016-2032
- 6.5.1. Eastern Europe Generative AI in Energy Market Analysis by Based on End-Use Vertical: Introduction
- 6.5.2. Market Size Absolute $ Opportunity Analysis and Forecast, By Based on End-Use Vertical, 2016-2032
- 6.5.3. Energy Generation
- 6.5.4. Energy Transmission
- 6.5.5. Energy Distribution
- 6.5.6. Utilities
- 6.5.7. Other End-Use Verticals
- 6.6. Eastern Europe Generative AI in Energy Market Analysis, Opportunity and Forecast, By Country , 2016-2032
- 6.6.1. Eastern Europe Generative AI in Energy Market Analysis by Country : Introduction
- 6.6.2. Market Size Absolute $ Opportunity Analysis and Forecast, Country , 2016-2032
- 6.6.2.1. Russia
- 6.6.2.2. Poland
- 6.6.2.3. The Czech Republic
- 6.6.2.4. Greece
- 6.6.2.5. Rest of Eastern Europe
- 7. APAC Generative AI in Energy Market Analysis, Opportunity and Forecast, 2016-2032
- 7.1. APAC Generative AI in Energy Market Analysis, 2016-2021
- 7.2. APAC Generative AI in Energy Market Opportunity and Forecast, 2023-2032
- 7.3. APAC Generative AI in Energy Market Analysis, Opportunity and Forecast, By Based on Component Type, 2016-2032
- 7.3.1. APAC Generative AI in Energy Market Analysis by Based on Component Type: Introduction
- 7.3.2. Market Size Absolute $ Opportunity Analysis and Forecast, By Based on Component Type, 2016-2032
- 7.3.3. Services
- 7.3.4. Solution
- 7.4. APAC Generative AI in Energy Market Analysis, Opportunity and Forecast, By Based on Application, 2016-2032
- 7.4.1. APAC Generative AI in Energy Market Analysis by Based on Application: Introduction
- 7.4.2. Market Size Absolute $ Opportunity Analysis and Forecast, By Based on Application, 2016-2032
- 7.4.3. Demand Forecasting
- 7.4.4. Robotics
- 7.4.5. Renewables Management
- 7.4.6. Safety and Security
- 7.4.7. Other Applications
- 7.5. APAC Generative AI in Energy Market Analysis, Opportunity and Forecast, By Based on End-Use Vertical, 2016-2032
- 7.5.1. APAC Generative AI in Energy Market Analysis by Based on End-Use Vertical: Introduction
- 7.5.2. Market Size Absolute $ Opportunity Analysis and Forecast, By Based on End-Use Vertical, 2016-2032
- 7.5.3. Energy Generation
- 7.5.4. Energy Transmission
- 7.5.5. Energy Distribution
- 7.5.6. Utilities
- 7.5.7. Other End-Use Verticals
- 7.6. APAC Generative AI in Energy Market Analysis, Opportunity and Forecast, By Country , 2016-2032
- 7.6.1. APAC Generative AI in Energy Market Analysis by Country : Introduction
- 7.6.2. Market Size Absolute $ Opportunity Analysis and Forecast, Country , 2016-2032
- 7.6.2.1. China
- 7.6.2.2. Japan
- 7.6.2.3. South Korea
- 7.6.2.4. India
- 7.6.2.5. Australia & New Zeland
- 7.6.2.6. Indonesia
- 7.6.2.7. Malaysia
- 7.6.2.8. Philippines
- 7.6.2.9. Singapore
- 7.6.2.10. Thailand
- 7.6.2.11. Vietnam
- 7.6.2.12. Rest of APAC
- 8. Latin America Generative AI in Energy Market Analysis, Opportunity and Forecast, 2016-2032
- 8.1. Latin America Generative AI in Energy Market Analysis, 2016-2021
- 8.2. Latin America Generative AI in Energy Market Opportunity and Forecast, 2023-2032
- 8.3. Latin America Generative AI in Energy Market Analysis, Opportunity and Forecast, By Based on Component Type, 2016-2032
- 8.3.1. Latin America Generative AI in Energy Market Analysis by Based on Component Type: Introduction
- 8.3.2. Market Size Absolute $ Opportunity Analysis and Forecast, By Based on Component Type, 2016-2032
- 8.3.3. Services
- 8.3.4. Solution
- 8.4. Latin America Generative AI in Energy Market Analysis, Opportunity and Forecast, By Based on Application, 2016-2032
- 8.4.1. Latin America Generative AI in Energy Market Analysis by Based on Application: Introduction
- 8.4.2. Market Size Absolute $ Opportunity Analysis and Forecast, By Based on Application, 2016-2032
- 8.4.3. Demand Forecasting
- 8.4.4. Robotics
- 8.4.5. Renewables Management
- 8.4.6. Safety and Security
- 8.4.7. Other Applications
- 8.5. Latin America Generative AI in Energy Market Analysis, Opportunity and Forecast, By Based on End-Use Vertical, 2016-2032
- 8.5.1. Latin America Generative AI in Energy Market Analysis by Based on End-Use Vertical: Introduction
- 8.5.2. Market Size Absolute $ Opportunity Analysis and Forecast, By Based on End-Use Vertical, 2016-2032
- 8.5.3. Energy Generation
- 8.5.4. Energy Transmission
- 8.5.5. Energy Distribution
- 8.5.6. Utilities
- 8.5.7. Other End-Use Verticals
- 8.6. Latin America Generative AI in Energy Market Analysis, Opportunity and Forecast, By Country , 2016-2032
- 8.6.1. Latin America Generative AI in Energy Market Analysis by Country : Introduction
- 8.6.2. Market Size Absolute $ Opportunity Analysis and Forecast, Country , 2016-2032
- 8.6.2.1. Brazil
- 8.6.2.2. Colombia
- 8.6.2.3. Chile
- 8.6.2.4. Argentina
- 8.6.2.5. Costa Rica
- 8.6.2.6. Rest of Latin America
- 9. Middle East & Africa Generative AI in Energy Market Analysis, Opportunity and Forecast, 2016-2032
- 9.1. Middle East & Africa Generative AI in Energy Market Analysis, 2016-2021
- 9.2. Middle East & Africa Generative AI in Energy Market Opportunity and Forecast, 2023-2032
- 9.3. Middle East & Africa Generative AI in Energy Market Analysis, Opportunity and Forecast, By Based on Component Type, 2016-2032
- 9.3.1. Middle East & Africa Generative AI in Energy Market Analysis by Based on Component Type: Introduction
- 9.3.2. Market Size Absolute $ Opportunity Analysis and Forecast, By Based on Component Type, 2016-2032
- 9.3.3. Services
- 9.3.4. Solution
- 9.4. Middle East & Africa Generative AI in Energy Market Analysis, Opportunity and Forecast, By Based on Application, 2016-2032
- 9.4.1. Middle East & Africa Generative AI in Energy Market Analysis by Based on Application: Introduction
- 9.4.2. Market Size Absolute $ Opportunity Analysis and Forecast, By Based on Application, 2016-2032
- 9.4.3. Demand Forecasting
- 9.4.4. Robotics
- 9.4.5. Renewables Management
- 9.4.6. Safety and Security
- 9.4.7. Other Applications
- 9.5. Middle East & Africa Generative AI in Energy Market Analysis, Opportunity and Forecast, By Based on End-Use Vertical, 2016-2032
- 9.5.1. Middle East & Africa Generative AI in Energy Market Analysis by Based on End-Use Vertical: Introduction
- 9.5.2. Market Size Absolute $ Opportunity Analysis and Forecast, By Based on End-Use Vertical, 2016-2032
- 9.5.3. Energy Generation
- 9.5.4. Energy Transmission
- 9.5.5. Energy Distribution
- 9.5.6. Utilities
- 9.5.7. Other End-Use Verticals
- 9.6. Middle East & Africa Generative AI in Energy Market Analysis, Opportunity and Forecast, By Country , 2016-2032
- 9.6.1. Middle East & Africa Generative AI in Energy Market Analysis by Country : Introduction
- 9.6.2. Market Size Absolute $ Opportunity Analysis and Forecast, Country , 2016-2032
- 9.6.2.1. Algeria
- 9.6.2.2. Egypt
- 9.6.2.3. Israel
- 9.6.2.4. Kuwait
- 9.6.2.5. Nigeria
- 9.6.2.6. Saudi Arabia
- 9.6.2.7. South Africa
- 9.6.2.8. Turkey
- 9.6.2.9. The UAE
- 9.6.2.10. Rest of MEA
- 10. Global Generative AI in Energy Market Analysis, Opportunity and Forecast, By Region , 2016-2032
- 10.1. Global Generative AI in Energy Market Analysis by Region : Introduction
- 10.2. Market Size Absolute $ Opportunity Analysis and Forecast, By Region , 2016-2032
- 10.2.1. North America
- 10.2.2. Western Europe
- 10.2.3. Eastern Europe
- 10.2.4. APAC
- 10.2.5. Latin America
- 10.2.6. Middle East & Africa
- 11. Global Generative AI in Energy Market Competitive Landscape, Market Share Analysis, and Company Profiles
- 11.1. Market Share Analysis
- 11.2. Company Profiles
- 11.3. SmartCloud Inc.
- 11.3.1. Company Overview
- 11.3.2. Financial Highlights
- 11.3.3. Product Portfolio
- 11.3.4. SWOT Analysis
- 11.3.5. Key Strategies and Developments
- 11.4. Siemens AG
- 11.4.1. Company Overview
- 11.4.2. Financial Highlights
- 11.4.3. Product Portfolio
- 11.4.4. SWOT Analysis
- 11.4.5. Key Strategies and Developments
- 11.5. ATOS SE
- 11.5.1. Company Overview
- 11.5.2. Financial Highlights
- 11.5.3. Product Portfolio
- 11.5.4. SWOT Analysis
- 11.5.5. Key Strategies and Developments
- 11.6. Alpiq AG
- 11.6.1. Company Overview
- 11.6.2. Financial Highlights
- 11.6.3. Product Portfolio
- 11.6.4. SWOT Analysis
- 11.6.5. Key Strategies and Developments
- 11.7. AppOrchid Inc
- 11.7.1. Company Overview
- 11.7.2. Financial Highlights
- 11.7.3. Product Portfolio
- 11.7.4. SWOT Analysis
- 11.7.5. Key Strategies and Developments
- 11.8. General Electric
- 11.8.1. Company Overview
- 11.8.2. Financial Highlights
- 11.8.3. Product Portfolio
- 11.8.4. SWOT Analysis
- 11.8.5. Key Strategies and Developments
- 11.9. Schneider Electric
- 11.9.1. Company Overview
- 11.9.2. Financial Highlights
- 11.9.3. Product Portfolio
- 11.9.4. SWOT Analysis
- 11.9.5. Key Strategies and Developments
- 11.10. Zen Robotics Ltd
- 11.10.1. Company Overview
- 11.10.2. Financial Highlights
- 11.10.3. Product Portfolio
- 11.10.4. SWOT Analysis
- 11.10.5. Key Strategies and Developments
- 11.11. Other Key Players
- 11.11.1. Company Overview
- 11.11.2. Financial Highlights
- 11.11.3. Product Portfolio
- 11.11.4. SWOT Analysis
- 11.11.5. Key Strategies and Developments
- 11.13.1. Company Overview
- 11.13.2. Financial Highlights
- 11.13.3. Product Portfolio
- 11.13.4. SWOT Analysis
- 11.13.5. Key Strategies and Developments
- 12. Assumptions and Acronyms
- 13. Research Methodology
- 14. Contact
"
- List of Figures
- "
- Figure 1: Global Generative AI in Energy Market Revenue (US$ Mn) Market Share by Based on Component Type in 2022
- Figure 2: Global Generative AI in Energy Market Market Attractiveness Analysis by Based on Component Type, 2016-2032
- Figure 3: Global Generative AI in Energy Market Revenue (US$ Mn) Market Share by Based on Applicationin 2022
- Figure 4: Global Generative AI in Energy Market Market Attractiveness Analysis by Based on Application, 2016-2032
- Figure 5: Global Generative AI in Energy Market Revenue (US$ Mn) Market Share by Based on End-Use Verticalin 2022
- Figure 6: Global Generative AI in Energy Market Market Attractiveness Analysis by Based on End-Use Vertical, 2016-2032
- Figure 7: Global Generative AI in Energy Market Revenue (US$ Mn) Market Share by Region in 2022
- Figure 8: Global Generative AI in Energy Market Market Attractiveness Analysis by Region, 2016-2032
- Figure 9: Global Generative AI in Energy Market Market Revenue (US$ Mn) (2016-2032)
- Figure 10: Global Generative AI in Energy Market Market Revenue (US$ Mn) Comparison by Region (2016-2032)
- Figure 11: Global Generative AI in Energy Market Market Revenue (US$ Mn) Comparison by Based on Component Type (2016-2032)
- Figure 12: Global Generative AI in Energy Market Market Revenue (US$ Mn) Comparison by Based on Application (2016-2032)
- Figure 13: Global Generative AI in Energy Market Market Revenue (US$ Mn) Comparison by Based on End-Use Vertical (2016-2032)
- Figure 14: Global Generative AI in Energy Market Market Y-o-Y Growth Rate Comparison by Region (2016-2032)
- Figure 15: Global Generative AI in Energy Market Market Y-o-Y Growth Rate Comparison by Based on Component Type (2016-2032)
- Figure 16: Global Generative AI in Energy Market Market Y-o-Y Growth Rate Comparison by Based on Application (2016-2032)
- Figure 17: Global Generative AI in Energy Market Market Y-o-Y Growth Rate Comparison by Based on End-Use Vertical (2016-2032)
- Figure 18: Global Generative AI in Energy Market Market Share Comparison by Region (2016-2032)
- Figure 19: Global Generative AI in Energy Market Market Share Comparison by Based on Component Type (2016-2032)
- Figure 20: Global Generative AI in Energy Market Market Share Comparison by Based on Application (2016-2032)
- Figure 21: Global Generative AI in Energy Market Market Share Comparison by Based on End-Use Vertical (2016-2032)
- Figure 22: North America Generative AI in Energy Market Revenue (US$ Mn) Market Share by Based on Component Typein 2022
- Figure 23: North America Generative AI in Energy Market Market Attractiveness Analysis by Based on Component Type, 2016-2032
- Figure 24: North America Generative AI in Energy Market Revenue (US$ Mn) Market Share by Based on Applicationin 2022
- Figure 25: North America Generative AI in Energy Market Market Attractiveness Analysis by Based on Application, 2016-2032
- Figure 26: North America Generative AI in Energy Market Revenue (US$ Mn) Market Share by Based on End-Use Verticalin 2022
- Figure 27: North America Generative AI in Energy Market Market Attractiveness Analysis by Based on End-Use Vertical, 2016-2032
- Figure 28: North America Generative AI in Energy Market Revenue (US$ Mn) Market Share by Country in 2022
- Figure 29: North America Generative AI in Energy Market Market Attractiveness Analysis by Country, 2016-2032
- Figure 30: North America Generative AI in Energy Market Market Revenue (US$ Mn) (2016-2032)
- Figure 31: North America Generative AI in Energy Market Market Revenue (US$ Mn) Comparison by Country (2016-2032)
- Figure 32: North America Generative AI in Energy Market Market Revenue (US$ Mn) Comparison by Based on Component Type (2016-2032)
- Figure 33: North America Generative AI in Energy Market Market Revenue (US$ Mn) Comparison by Based on Application (2016-2032)
- Figure 34: North America Generative AI in Energy Market Market Revenue (US$ Mn) Comparison by Based on End-Use Vertical (2016-2032)
- Figure 35: North America Generative AI in Energy Market Market Y-o-Y Growth Rate Comparison by Country (2016-2032)
- Figure 36: North America Generative AI in Energy Market Market Y-o-Y Growth Rate Comparison by Based on Component Type (2016-2032)
- Figure 37: North America Generative AI in Energy Market Market Y-o-Y Growth Rate Comparison by Based on Application (2016-2032)
- Figure 38: North America Generative AI in Energy Market Market Y-o-Y Growth Rate Comparison by Based on End-Use Vertical (2016-2032)
- Figure 39: North America Generative AI in Energy Market Market Share Comparison by Country (2016-2032)
- Figure 40: North America Generative AI in Energy Market Market Share Comparison by Based on Component Type (2016-2032)
- Figure 41: North America Generative AI in Energy Market Market Share Comparison by Based on Application (2016-2032)
- Figure 42: North America Generative AI in Energy Market Market Share Comparison by Based on End-Use Vertical (2016-2032)
- Figure 43: Western Europe Generative AI in Energy Market Revenue (US$ Mn) Market Share by Based on Component Typein 2022
- Figure 44: Western Europe Generative AI in Energy Market Market Attractiveness Analysis by Based on Component Type, 2016-2032
- Figure 45: Western Europe Generative AI in Energy Market Revenue (US$ Mn) Market Share by Based on Applicationin 2022
- Figure 46: Western Europe Generative AI in Energy Market Market Attractiveness Analysis by Based on Application, 2016-2032
- Figure 47: Western Europe Generative AI in Energy Market Revenue (US$ Mn) Market Share by Based on End-Use Verticalin 2022
- Figure 48: Western Europe Generative AI in Energy Market Market Attractiveness Analysis by Based on End-Use Vertical, 2016-2032
- Figure 49: Western Europe Generative AI in Energy Market Revenue (US$ Mn) Market Share by Country in 2022
- Figure 50: Western Europe Generative AI in Energy Market Market Attractiveness Analysis by Country, 2016-2032
- Figure 51: Western Europe Generative AI in Energy Market Market Revenue (US$ Mn) (2016-2032)
- Figure 52: Western Europe Generative AI in Energy Market Market Revenue (US$ Mn) Comparison by Country (2016-2032)
- Figure 53: Western Europe Generative AI in Energy Market Market Revenue (US$ Mn) Comparison by Based on Component Type (2016-2032)
- Figure 54: Western Europe Generative AI in Energy Market Market Revenue (US$ Mn) Comparison by Based on Application (2016-2032)
- Figure 55: Western Europe Generative AI in Energy Market Market Revenue (US$ Mn) Comparison by Based on End-Use Vertical (2016-2032)
- Figure 56: Western Europe Generative AI in Energy Market Market Y-o-Y Growth Rate Comparison by Country (2016-2032)
- Figure 57: Western Europe Generative AI in Energy Market Market Y-o-Y Growth Rate Comparison by Based on Component Type (2016-2032)
- Figure 58: Western Europe Generative AI in Energy Market Market Y-o-Y Growth Rate Comparison by Based on Application (2016-2032)
- Figure 59: Western Europe Generative AI in Energy Market Market Y-o-Y Growth Rate Comparison by Based on End-Use Vertical (2016-2032)
- Figure 60: Western Europe Generative AI in Energy Market Market Share Comparison by Country (2016-2032)
- Figure 61: Western Europe Generative AI in Energy Market Market Share Comparison by Based on Component Type (2016-2032)
- Figure 62: Western Europe Generative AI in Energy Market Market Share Comparison by Based on Application (2016-2032)
- Figure 63: Western Europe Generative AI in Energy Market Market Share Comparison by Based on End-Use Vertical (2016-2032)
- Figure 64: Eastern Europe Generative AI in Energy Market Revenue (US$ Mn) Market Share by Based on Component Typein 2022
- Figure 65: Eastern Europe Generative AI in Energy Market Market Attractiveness Analysis by Based on Component Type, 2016-2032
- Figure 66: Eastern Europe Generative AI in Energy Market Revenue (US$ Mn) Market Share by Based on Applicationin 2022
- Figure 67: Eastern Europe Generative AI in Energy Market Market Attractiveness Analysis by Based on Application, 2016-2032
- Figure 68: Eastern Europe Generative AI in Energy Market Revenue (US$ Mn) Market Share by Based on End-Use Verticalin 2022
- Figure 69: Eastern Europe Generative AI in Energy Market Market Attractiveness Analysis by Based on End-Use Vertical, 2016-2032
- Figure 70: Eastern Europe Generative AI in Energy Market Revenue (US$ Mn) Market Share by Country in 2022
- Figure 71: Eastern Europe Generative AI in Energy Market Market Attractiveness Analysis by Country, 2016-2032
- Figure 72: Eastern Europe Generative AI in Energy Market Market Revenue (US$ Mn) (2016-2032)
- Figure 73: Eastern Europe Generative AI in Energy Market Market Revenue (US$ Mn) Comparison by Country (2016-2032)
- Figure 74: Eastern Europe Generative AI in Energy Market Market Revenue (US$ Mn) Comparison by Based on Component Type (2016-2032)
- Figure 75: Eastern Europe Generative AI in Energy Market Market Revenue (US$ Mn) Comparison by Based on Application (2016-2032)
- Figure 76: Eastern Europe Generative AI in Energy Market Market Revenue (US$ Mn) Comparison by Based on End-Use Vertical (2016-2032)
- Figure 77: Eastern Europe Generative AI in Energy Market Market Y-o-Y Growth Rate Comparison by Country (2016-2032)
- Figure 78: Eastern Europe Generative AI in Energy Market Market Y-o-Y Growth Rate Comparison by Based on Component Type (2016-2032)
- Figure 79: Eastern Europe Generative AI in Energy Market Market Y-o-Y Growth Rate Comparison by Based on Application (2016-2032)
- Figure 80: Eastern Europe Generative AI in Energy Market Market Y-o-Y Growth Rate Comparison by Based on End-Use Vertical (2016-2032)
- Figure 81: Eastern Europe Generative AI in Energy Market Market Share Comparison by Country (2016-2032)
- Figure 82: Eastern Europe Generative AI in Energy Market Market Share Comparison by Based on Component Type (2016-2032)
- Figure 83: Eastern Europe Generative AI in Energy Market Market Share Comparison by Based on Application (2016-2032)
- Figure 84: Eastern Europe Generative AI in Energy Market Market Share Comparison by Based on End-Use Vertical (2016-2032)
- Figure 85: APAC Generative AI in Energy Market Revenue (US$ Mn) Market Share by Based on Component Typein 2022
- Figure 86: APAC Generative AI in Energy Market Market Attractiveness Analysis by Based on Component Type, 2016-2032
- Figure 87: APAC Generative AI in Energy Market Revenue (US$ Mn) Market Share by Based on Applicationin 2022
- Figure 88: APAC Generative AI in Energy Market Market Attractiveness Analysis by Based on Application, 2016-2032
- Figure 89: APAC Generative AI in Energy Market Revenue (US$ Mn) Market Share by Based on End-Use Verticalin 2022
- Figure 90: APAC Generative AI in Energy Market Market Attractiveness Analysis by Based on End-Use Vertical, 2016-2032
- Figure 91: APAC Generative AI in Energy Market Revenue (US$ Mn) Market Share by Country in 2022
- Figure 92: APAC Generative AI in Energy Market Market Attractiveness Analysis by Country, 2016-2032
- Figure 93: APAC Generative AI in Energy Market Market Revenue (US$ Mn) (2016-2032)
- Figure 94: APAC Generative AI in Energy Market Market Revenue (US$ Mn) Comparison by Country (2016-2032)
- Figure 95: APAC Generative AI in Energy Market Market Revenue (US$ Mn) Comparison by Based on Component Type (2016-2032)
- Figure 96: APAC Generative AI in Energy Market Market Revenue (US$ Mn) Comparison by Based on Application (2016-2032)
- Figure 97: APAC Generative AI in Energy Market Market Revenue (US$ Mn) Comparison by Based on End-Use Vertical (2016-2032)
- Figure 98: APAC Generative AI in Energy Market Market Y-o-Y Growth Rate Comparison by Country (2016-2032)
- Figure 99: APAC Generative AI in Energy Market Market Y-o-Y Growth Rate Comparison by Based on Component Type (2016-2032)
- Figure 100: APAC Generative AI in Energy Market Market Y-o-Y Growth Rate Comparison by Based on Application (2016-2032)
- Figure 101: APAC Generative AI in Energy Market Market Y-o-Y Growth Rate Comparison by Based on End-Use Vertical (2016-2032)
- Figure 102: APAC Generative AI in Energy Market Market Share Comparison by Country (2016-2032)
- Figure 103: APAC Generative AI in Energy Market Market Share Comparison by Based on Component Type (2016-2032)
- Figure 104: APAC Generative AI in Energy Market Market Share Comparison by Based on Application (2016-2032)
- Figure 105: APAC Generative AI in Energy Market Market Share Comparison by Based on End-Use Vertical (2016-2032)
- Figure 106: Latin America Generative AI in Energy Market Revenue (US$ Mn) Market Share by Based on Component Typein 2022
- Figure 107: Latin America Generative AI in Energy Market Market Attractiveness Analysis by Based on Component Type, 2016-2032
- Figure 108: Latin America Generative AI in Energy Market Revenue (US$ Mn) Market Share by Based on Applicationin 2022
- Figure 109: Latin America Generative AI in Energy Market Market Attractiveness Analysis by Based on Application, 2016-2032
- Figure 110: Latin America Generative AI in Energy Market Revenue (US$ Mn) Market Share by Based on End-Use Verticalin 2022
- Figure 111: Latin America Generative AI in Energy Market Market Attractiveness Analysis by Based on End-Use Vertical, 2016-2032
- Figure 112: Latin America Generative AI in Energy Market Revenue (US$ Mn) Market Share by Country in 2022
- Figure 113: Latin America Generative AI in Energy Market Market Attractiveness Analysis by Country, 2016-2032
- Figure 114: Latin America Generative AI in Energy Market Market Revenue (US$ Mn) (2016-2032)
- Figure 115: Latin America Generative AI in Energy Market Market Revenue (US$ Mn) Comparison by Country (2016-2032)
- Figure 116: Latin America Generative AI in Energy Market Market Revenue (US$ Mn) Comparison by Based on Component Type (2016-2032)
- Figure 117: Latin America Generative AI in Energy Market Market Revenue (US$ Mn) Comparison by Based on Application (2016-2032)
- Figure 118: Latin America Generative AI in Energy Market Market Revenue (US$ Mn) Comparison by Based on End-Use Vertical (2016-2032)
- Figure 119: Latin America Generative AI in Energy Market Market Y-o-Y Growth Rate Comparison by Country (2016-2032)
- Figure 120: Latin America Generative AI in Energy Market Market Y-o-Y Growth Rate Comparison by Based on Component Type (2016-2032)
- Figure 121: Latin America Generative AI in Energy Market Market Y-o-Y Growth Rate Comparison by Based on Application (2016-2032)
- Figure 122: Latin America Generative AI in Energy Market Market Y-o-Y Growth Rate Comparison by Based on End-Use Vertical (2016-2032)
- Figure 123: Latin America Generative AI in Energy Market Market Share Comparison by Country (2016-2032)
- Figure 124: Latin America Generative AI in Energy Market Market Share Comparison by Based on Component Type (2016-2032)
- Figure 125: Latin America Generative AI in Energy Market Market Share Comparison by Based on Application (2016-2032)
- Figure 126: Latin America Generative AI in Energy Market Market Share Comparison by Based on End-Use Vertical (2016-2032)
- Figure 127: Middle East & Africa Generative AI in Energy Market Revenue (US$ Mn) Market Share by Based on Component Typein 2022
- Figure 128: Middle East & Africa Generative AI in Energy Market Market Attractiveness Analysis by Based on Component Type, 2016-2032
- Figure 129: Middle East & Africa Generative AI in Energy Market Revenue (US$ Mn) Market Share by Based on Applicationin 2022
- Figure 130: Middle East & Africa Generative AI in Energy Market Market Attractiveness Analysis by Based on Application, 2016-2032
- Figure 131: Middle East & Africa Generative AI in Energy Market Revenue (US$ Mn) Market Share by Based on End-Use Verticalin 2022
- Figure 132: Middle East & Africa Generative AI in Energy Market Market Attractiveness Analysis by Based on End-Use Vertical, 2016-2032
- Figure 133: Middle East & Africa Generative AI in Energy Market Revenue (US$ Mn) Market Share by Country in 2022
- Figure 134: Middle East & Africa Generative AI in Energy Market Market Attractiveness Analysis by Country, 2016-2032
- Figure 135: Middle East & Africa Generative AI in Energy Market Market Revenue (US$ Mn) (2016-2032)
- Figure 136: Middle East & Africa Generative AI in Energy Market Market Revenue (US$ Mn) Comparison by Country (2016-2032)
- Figure 137: Middle East & Africa Generative AI in Energy Market Market Revenue (US$ Mn) Comparison by Based on Component Type (2016-2032)
- Figure 138: Middle East & Africa Generative AI in Energy Market Market Revenue (US$ Mn) Comparison by Based on Application (2016-2032)
- Figure 139: Middle East & Africa Generative AI in Energy Market Market Revenue (US$ Mn) Comparison by Based on End-Use Vertical (2016-2032)
- Figure 140: Middle East & Africa Generative AI in Energy Market Market Y-o-Y Growth Rate Comparison by Country (2016-2032)
- Figure 141: Middle East & Africa Generative AI in Energy Market Market Y-o-Y Growth Rate Comparison by Based on Component Type (2016-2032)
- Figure 142: Middle East & Africa Generative AI in Energy Market Market Y-o-Y Growth Rate Comparison by Based on Application (2016-2032)
- Figure 143: Middle East & Africa Generative AI in Energy Market Market Y-o-Y Growth Rate Comparison by Based on End-Use Vertical (2016-2032)
- Figure 144: Middle East & Africa Generative AI in Energy Market Market Share Comparison by Country (2016-2032)
- Figure 145: Middle East & Africa Generative AI in Energy Market Market Share Comparison by Based on Component Type (2016-2032)
- Figure 146: Middle East & Africa Generative AI in Energy Market Market Share Comparison by Based on Application (2016-2032)
- Figure 147: Middle East & Africa Generative AI in Energy Market Market Share Comparison by Based on End-Use Vertical (2016-2032)
"
- List of Tables
- "
- Table 1: Global Generative AI in Energy Market Market Comparison by Based on Component Type (2016-2032)
- Table 2: Global Generative AI in Energy Market Market Comparison by Based on Application (2016-2032)
- Table 3: Global Generative AI in Energy Market Market Comparison by Based on End-Use Vertical (2016-2032)
- Table 4: Global Generative AI in Energy Market Revenue (US$ Mn) Comparison by Region (2016-2032)
- Table 5: Global Generative AI in Energy Market Market Revenue (US$ Mn) (2016-2032)
- Table 6: Global Generative AI in Energy Market Market Revenue (US$ Mn) Comparison by Region (2016-2032)
- Table 7: Global Generative AI in Energy Market Market Revenue (US$ Mn) Comparison by Based on Component Type (2016-2032)
- Table 8: Global Generative AI in Energy Market Market Revenue (US$ Mn) Comparison by Based on Application (2016-2032)
- Table 9: Global Generative AI in Energy Market Market Revenue (US$ Mn) Comparison by Based on End-Use Vertical (2016-2032)
- Table 10: Global Generative AI in Energy Market Market Y-o-Y Growth Rate Comparison by Region (2016-2032)
- Table 11: Global Generative AI in Energy Market Market Y-o-Y Growth Rate Comparison by Based on Component Type (2016-2032)
- Table 12: Global Generative AI in Energy Market Market Y-o-Y Growth Rate Comparison by Based on Application (2016-2032)
- Table 13: Global Generative AI in Energy Market Market Y-o-Y Growth Rate Comparison by Based on End-Use Vertical (2016-2032)
- Table 14: Global Generative AI in Energy Market Market Share Comparison by Region (2016-2032)
- Table 15: Global Generative AI in Energy Market Market Share Comparison by Based on Component Type (2016-2032)
- Table 16: Global Generative AI in Energy Market Market Share Comparison by Based on Application (2016-2032)
- Table 17: Global Generative AI in Energy Market Market Share Comparison by Based on End-Use Vertical (2016-2032)
- Table 18: North America Generative AI in Energy Market Market Comparison by Based on Application (2016-2032)
- Table 19: North America Generative AI in Energy Market Market Comparison by Based on End-Use Vertical (2016-2032)
- Table 20: North America Generative AI in Energy Market Revenue (US$ Mn) Comparison by Country (2016-2032)
- Table 21: North America Generative AI in Energy Market Market Revenue (US$ Mn) (2016-2032)
- Table 22: North America Generative AI in Energy Market Market Revenue (US$ Mn) Comparison by Country (2016-2032)
- Table 23: North America Generative AI in Energy Market Market Revenue (US$ Mn) Comparison by Based on Component Type (2016-2032)
- Table 24: North America Generative AI in Energy Market Market Revenue (US$ Mn) Comparison by Based on Application (2016-2032)
- Table 25: North America Generative AI in Energy Market Market Revenue (US$ Mn) Comparison by Based on End-Use Vertical (2016-2032)
- Table 26: North America Generative AI in Energy Market Market Y-o-Y Growth Rate Comparison by Country (2016-2032)
- Table 27: North America Generative AI in Energy Market Market Y-o-Y Growth Rate Comparison by Based on Component Type (2016-2032)
- Table 28: North America Generative AI in Energy Market Market Y-o-Y Growth Rate Comparison by Based on Application (2016-2032)
- Table 29: North America Generative AI in Energy Market Market Y-o-Y Growth Rate Comparison by Based on End-Use Vertical (2016-2032)
- Table 30: North America Generative AI in Energy Market Market Share Comparison by Country (2016-2032)
- Table 31: North America Generative AI in Energy Market Market Share Comparison by Based on Component Type (2016-2032)
- Table 32: North America Generative AI in Energy Market Market Share Comparison by Based on Application (2016-2032)
- Table 33: North America Generative AI in Energy Market Market Share Comparison by Based on End-Use Vertical (2016-2032)
- Table 34: Western Europe Generative AI in Energy Market Market Comparison by Based on Component Type (2016-2032)
- Table 35: Western Europe Generative AI in Energy Market Market Comparison by Based on Application (2016-2032)
- Table 36: Western Europe Generative AI in Energy Market Market Comparison by Based on End-Use Vertical (2016-2032)
- Table 37: Western Europe Generative AI in Energy Market Revenue (US$ Mn) Comparison by Country (2016-2032)
- Table 38: Western Europe Generative AI in Energy Market Market Revenue (US$ Mn) (2016-2032)
- Table 39: Western Europe Generative AI in Energy Market Market Revenue (US$ Mn) Comparison by Country (2016-2032)
- Table 40: Western Europe Generative AI in Energy Market Market Revenue (US$ Mn) Comparison by Based on Component Type (2016-2032)
- Table 41: Western Europe Generative AI in Energy Market Market Revenue (US$ Mn) Comparison by Based on Application (2016-2032)
- Table 42: Western Europe Generative AI in Energy Market Market Revenue (US$ Mn) Comparison by Based on End-Use Vertical (2016-2032)
- Table 43: Western Europe Generative AI in Energy Market Market Y-o-Y Growth Rate Comparison by Country (2016-2032)
- Table 44: Western Europe Generative AI in Energy Market Market Y-o-Y Growth Rate Comparison by Based on Component Type (2016-2032)
- Table 45: Western Europe Generative AI in Energy Market Market Y-o-Y Growth Rate Comparison by Based on Application (2016-2032)
- Table 46: Western Europe Generative AI in Energy Market Market Y-o-Y Growth Rate Comparison by Based on End-Use Vertical (2016-2032)
- Table 47: Western Europe Generative AI in Energy Market Market Share Comparison by Country (2016-2032)
- Table 48: Western Europe Generative AI in Energy Market Market Share Comparison by Based on Component Type (2016-2032)
- Table 49: Western Europe Generative AI in Energy Market Market Share Comparison by Based on Application (2016-2032)
- Table 50: Western Europe Generative AI in Energy Market Market Share Comparison by Based on End-Use Vertical (2016-2032)
- Table 51: Eastern Europe Generative AI in Energy Market Market Comparison by Based on Component Type (2016-2032)
- Table 52: Eastern Europe Generative AI in Energy Market Market Comparison by Based on Application (2016-2032)
- Table 53: Eastern Europe Generative AI in Energy Market Market Comparison by Based on End-Use Vertical (2016-2032)
- Table 54: Eastern Europe Generative AI in Energy Market Revenue (US$ Mn) Comparison by Country (2016-2032)
- Table 55: Eastern Europe Generative AI in Energy Market Market Revenue (US$ Mn) (2016-2032)
- Table 56: Eastern Europe Generative AI in Energy Market Market Revenue (US$ Mn) Comparison by Country (2016-2032)
- Table 57: Eastern Europe Generative AI in Energy Market Market Revenue (US$ Mn) Comparison by Based on Component Type (2016-2032)
- Table 58: Eastern Europe Generative AI in Energy Market Market Revenue (US$ Mn) Comparison by Based on Application (2016-2032)
- Table 59: Eastern Europe Generative AI in Energy Market Market Revenue (US$ Mn) Comparison by Based on End-Use Vertical (2016-2032)
- Table 60: Eastern Europe Generative AI in Energy Market Market Y-o-Y Growth Rate Comparison by Country (2016-2032)
- Table 61: Eastern Europe Generative AI in Energy Market Market Y-o-Y Growth Rate Comparison by Based on Component Type (2016-2032)
- Table 62: Eastern Europe Generative AI in Energy Market Market Y-o-Y Growth Rate Comparison by Based on Application (2016-2032)
- Table 63: Eastern Europe Generative AI in Energy Market Market Y-o-Y Growth Rate Comparison by Based on End-Use Vertical (2016-2032)
- Table 64: Eastern Europe Generative AI in Energy Market Market Share Comparison by Country (2016-2032)
- Table 65: Eastern Europe Generative AI in Energy Market Market Share Comparison by Based on Component Type (2016-2032)
- Table 66: Eastern Europe Generative AI in Energy Market Market Share Comparison by Based on Application (2016-2032)
- Table 67: Eastern Europe Generative AI in Energy Market Market Share Comparison by Based on End-Use Vertical (2016-2032)
- Table 68: APAC Generative AI in Energy Market Market Comparison by Based on Component Type (2016-2032)
- Table 69: APAC Generative AI in Energy Market Market Comparison by Based on Application (2016-2032)
- Table 70: APAC Generative AI in Energy Market Market Comparison by Based on End-Use Vertical (2016-2032)
- Table 71: APAC Generative AI in Energy Market Revenue (US$ Mn) Comparison by Country (2016-2032)
- Table 72: APAC Generative AI in Energy Market Market Revenue (US$ Mn) (2016-2032)
- Table 73: APAC Generative AI in Energy Market Market Revenue (US$ Mn) Comparison by Country (2016-2032)
- Table 74: APAC Generative AI in Energy Market Market Revenue (US$ Mn) Comparison by Based on Component Type (2016-2032)
- Table 75: APAC Generative AI in Energy Market Market Revenue (US$ Mn) Comparison by Based on Application (2016-2032)
- Table 76: APAC Generative AI in Energy Market Market Revenue (US$ Mn) Comparison by Based on End-Use Vertical (2016-2032)
- Table 77: APAC Generative AI in Energy Market Market Y-o-Y Growth Rate Comparison by Country (2016-2032)
- Table 78: APAC Generative AI in Energy Market Market Y-o-Y Growth Rate Comparison by Based on Component Type (2016-2032)
- Table 79: APAC Generative AI in Energy Market Market Y-o-Y Growth Rate Comparison by Based on Application (2016-2032)
- Table 80: APAC Generative AI in Energy Market Market Y-o-Y Growth Rate Comparison by Based on End-Use Vertical (2016-2032)
- Table 81: APAC Generative AI in Energy Market Market Share Comparison by Country (2016-2032)
- Table 82: APAC Generative AI in Energy Market Market Share Comparison by Based on Component Type (2016-2032)
- Table 83: APAC Generative AI in Energy Market Market Share Comparison by Based on Application (2016-2032)
- Table 84: APAC Generative AI in Energy Market Market Share Comparison by Based on End-Use Vertical (2016-2032)
- Table 85: Latin America Generative AI in Energy Market Market Comparison by Based on Component Type (2016-2032)
- Table 86: Latin America Generative AI in Energy Market Market Comparison by Based on Application (2016-2032)
- Table 87: Latin America Generative AI in Energy Market Market Comparison by Based on End-Use Vertical (2016-2032)
- Table 88: Latin America Generative AI in Energy Market Revenue (US$ Mn) Comparison by Country (2016-2032)
- Table 89: Latin America Generative AI in Energy Market Market Revenue (US$ Mn) (2016-2032)
- Table 90: Latin America Generative AI in Energy Market Market Revenue (US$ Mn) Comparison by Country (2016-2032)
- Table 91: Latin America Generative AI in Energy Market Market Revenue (US$ Mn) Comparison by Based on Component Type (2016-2032)
- Table 92: Latin America Generative AI in Energy Market Market Revenue (US$ Mn) Comparison by Based on Application (2016-2032)
- Table 93: Latin America Generative AI in Energy Market Market Revenue (US$ Mn) Comparison by Based on End-Use Vertical (2016-2032)
- Table 94: Latin America Generative AI in Energy Market Market Y-o-Y Growth Rate Comparison by Country (2016-2032)
- Table 95: Latin America Generative AI in Energy Market Market Y-o-Y Growth Rate Comparison by Based on Component Type (2016-2032)
- Table 96: Latin America Generative AI in Energy Market Market Y-o-Y Growth Rate Comparison by Based on Application (2016-2032)
- Table 97: Latin America Generative AI in Energy Market Market Y-o-Y Growth Rate Comparison by Based on End-Use Vertical (2016-2032)
- Table 98: Latin America Generative AI in Energy Market Market Share Comparison by Country (2016-2032)
- Table 99: Latin America Generative AI in Energy Market Market Share Comparison by Based on Component Type (2016-2032)
- Table 100: Latin America Generative AI in Energy Market Market Share Comparison by Based on Application (2016-2032)
- Table 101: Latin America Generative AI in Energy Market Market Share Comparison by Based on End-Use Vertical (2016-2032)
- Table 102: Middle East & Africa Generative AI in Energy Market Market Comparison by Based on Component Type (2016-2032)
- Table 103: Middle East & Africa Generative AI in Energy Market Market Comparison by Based on Application (2016-2032)
- Table 104: Middle East & Africa Generative AI in Energy Market Market Comparison by Based on End-Use Vertical (2016-2032)
- Table 105: Middle East & Africa Generative AI in Energy Market Revenue (US$ Mn) Comparison by Country (2016-2032)
- Table 106: Middle East & Africa Generative AI in Energy Market Market Revenue (US$ Mn) (2016-2032)
- Table 107: Middle East & Africa Generative AI in Energy Market Market Revenue (US$ Mn) Comparison by Country (2016-2032)
- Table 108: Middle East & Africa Generative AI in Energy Market Market Revenue (US$ Mn) Comparison by Based on Component Type (2016-2032)
- Table 109: Middle East & Africa Generative AI in Energy Market Market Revenue (US$ Mn) Comparison by Based on Application (2016-2032)
- Table 110: Middle East & Africa Generative AI in Energy Market Market Revenue (US$ Mn) Comparison by Based on End-Use Vertical (2016-2032)
- Table 111: Middle East & Africa Generative AI in Energy Market Market Y-o-Y Growth Rate Comparison by Country (2016-2032)
- Table 112: Middle East & Africa Generative AI in Energy Market Market Y-o-Y Growth Rate Comparison by Based on Component Type (2016-2032)
- Table 113: Middle East & Africa Generative AI in Energy Market Market Y-o-Y Growth Rate Comparison by Based on Application (2016-2032)
- Table 114: Middle East & Africa Generative AI in Energy Market Market Y-o-Y Growth Rate Comparison by Based on End-Use Vertical (2016-2032)
- Table 115: Middle East & Africa Generative AI in Energy Market Market Share Comparison by Country (2016-2032)
- Table 116: Middle East & Africa Generative AI in Energy Market Market Share Comparison by Based on Component Type (2016-2032)
- Table 117: Middle East & Africa Generative AI in Energy Market Market Share Comparison by Based on Application (2016-2032)
- Table 118: Middle East & Africa Generative AI in Energy Market Market Share Comparison by Based on End-Use Vertical (2016-2032)
- 1. Executive Summary
-
- SmartCloud Inc.
- Siemens AG
- ATOS SE
- Alpiq AG
- AppOrchid Inc
- General Electric
- Schneider Electric
- Zen Robotics Ltd
- Other Key Players
Our Clients


View Our Licence Options
