
Generative AI in Autonomous Vehicles Market By Component:(Solution, Services), By Application:(Training & data augmentation, Simulation and Testing, Perception Systems Enhancement & Sensing, Localization and Mapping, Safety Verification & Testing, Behavior Prediction & decision making, Others), Vehicle Type:(Passenger Vehicles, Commercial Vehicles), End Users:(Automotive Manufacturers, Research & Development Organizations) , By Region And Companies - Industry Segment Outlook, Market Assessment, Competition Scenario, Trends, And Forecast 2024-2033
-
43628
-
March 2024
-
178
-


-
This report was compiled by Kalyani Khudsange Kalyani Khudsange is a Research Analyst at Prudour Pvt. Ltd. with 2.5 years of experience in market research and a strong technical background in Chemical Engineering and manufacturing. Correspondence Sr. Research Analyst Linkedin | Detailed Market research Methodology Our methodology involves a mix of primary research, including interviews with leading mental health experts, and secondary research from reputable medical journals and databases. View Detailed Methodology Page
-
Quick Navigation
- Report Overview
- Key Takeaways
- Driving factors
- Restraining Factors
- By Component Analysis
- By Application Analysis
- By Vehicle Type Analysis
- By End-User Analysis
- Generative AI in Autonomous Vehicles Industry Segments
- Generative AI in Autonomous Vehicles Market Growth Opportunities
- Generative AI in Autonomous Vehicles Market Trending Factors
- Generative AI in Autonomous Vehicles Market Regional Analysis
- Generative AI in Autonomous Vehicles Industry By Region
- Generative AI in Autonomous Vehicles Market Competitive Analysis
- Generative AI in Autonomous Vehicles Industry Key Players
- Generative AI in Autonomous Vehicles Market Recent Development
- Report Scope
Report Overview
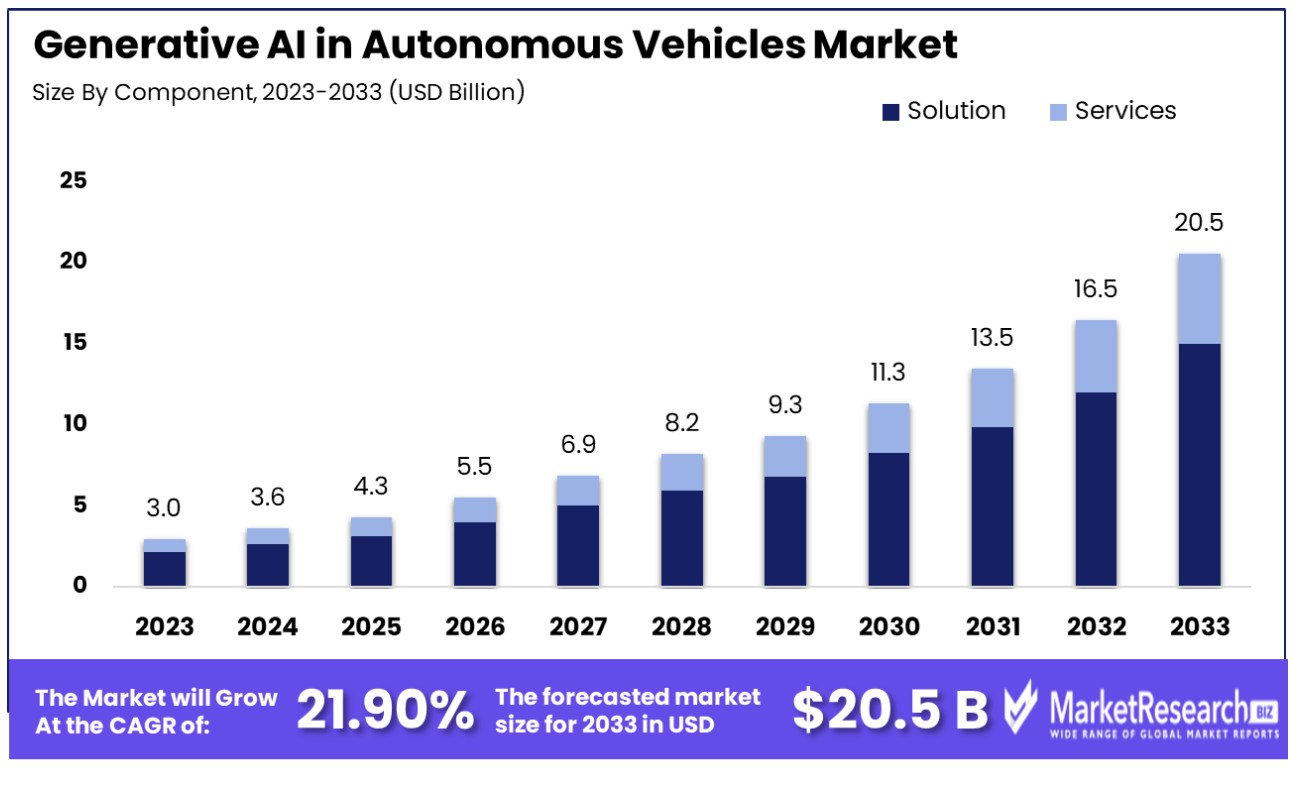
The Generative AI in Autonomous Vehicles Market was valued at USD 3 Billion in 2023, It is expected to reach USD 20.5 Billion by 2033, with a CAGR of 21.90% during the forecast period from 2024 to 2033.
Integrating Generative Artificial Intelligence (AI) within the autonomous vehicles market represents a pivotal advancement in the intersection of AI technologies and autonomous driving. Generative AI encompasses the deployment of sophisticated algorithms that enable vehicles to dynamically perceive and respond to their environment, thereby enhancing their self-learning and adaptive capabilities. This segment is dedicated to developing AI systems capable of generating new data, behaviors, and solutions, significantly improving the efficiency, safety, and reliability of autonomous vehicles. Through relentless innovation and refinement, Generative AI is propelling the evolution of autonomous driving, transforming transportation, and delineating the future of mobility with its transformative potential and unparalleled opportunities for growth and optimization.
The automotive industry has witnessed profound transformations with the advent of disruptive technologies such as electric vehicles, autonomous driving capabilities, and advanced safety features. These advancements have precipitated a demand for more intricate and intelligent systems to navigate the evolving automotive landscape. Among the technologies spearheading these changes, Generative AI emerges as a rapidly evolving force that is reshaping the sector.
The implementation of Generative AI is poised to result in a 10-20% reduction in development timelines for automobile parts, illustrating its significant impact on automotive businesses. Generative AI's role in autonomous vehicles entails the application of AI technologies capable of generating new data or simulations from extensive datasets. This function is critical for autonomous vehicles, which must navigate an endless array of real-world scenarios safely and efficiently. Generative AI enables these vehicles to simulate and predict outcomes in myriad situations, thereby enhancing their decision-making processes.
Leveraging generative models allows autonomous vehicles to more accurately comprehend their environment, predict potential hazards, and make informed decisions in real time. This technology is instrumental in the development of more sophisticated and adaptable autonomous driving systems, improving safety, efficiency, and reliability. Furthermore, Generative AI is vital in the training and testing of autonomous vehicles, facilitating the creation of realistic and diverse driving scenarios that may not be readily obtainable through conventional data collection methods.
Generative AI holds the promise of facilitating the safe introduction of autonomous vehicles (AVs) without compromising public safety as the technology matures. It achieves this by generating images and videos that can be used to construct lifelike scenarios, enabling autonomous vehicles to learn and adapt to various environments within a controlled setting. Automotive companies such as Mercedes are exploring the potential of mixed reality systems powered by Generative AI to enhance the quality of navigation and infotainment systems.
Key Takeaways
- Market Growth: The Generative AI in Autonomous Vehicles Market was valued at USD 3 Billion in 2023, It is expected to reach USD 20.5 Billion by 2033, with a CAGR of 21.90% during the forecast period from 2024 to 2033
- By Component Analysis: In the Generative AI in Autonomous Vehicles Market, the 'Solution' segment dominates with a substantial 73% market share.
- By Application Analysis: The 'Training & Data Augmentation' application segment holds the largest share, accounting for 25% of the market.
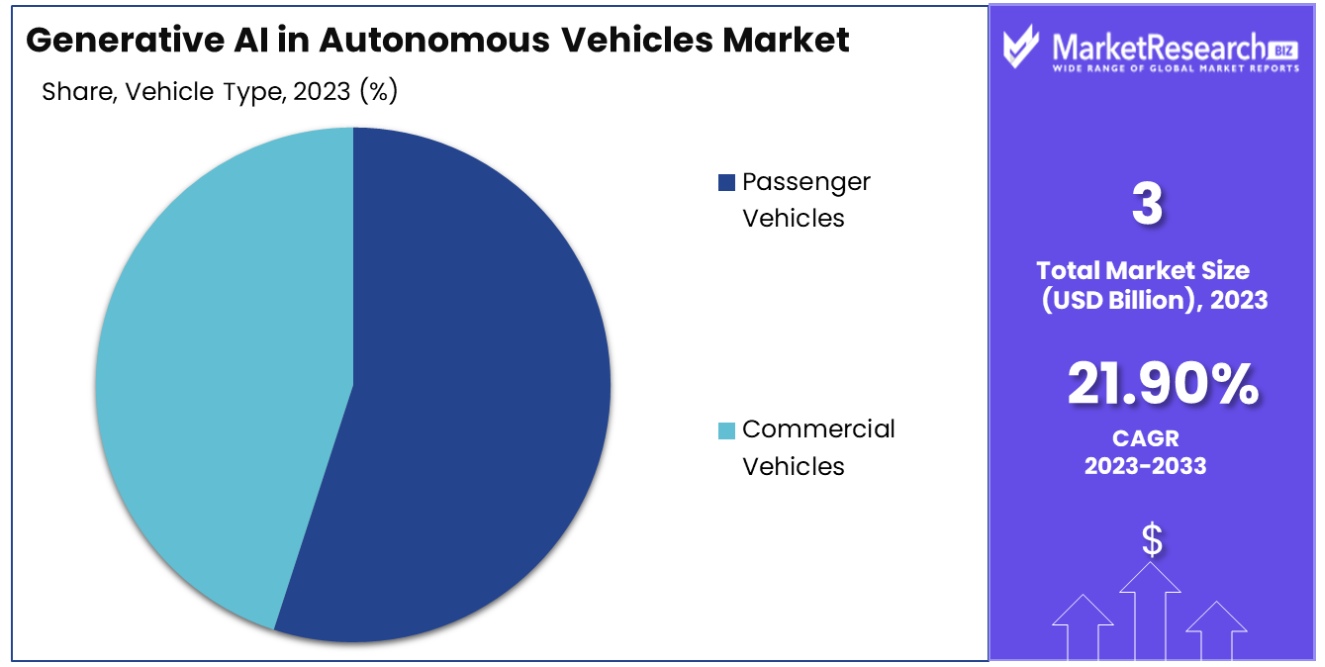
- By Vehicle Type Analysis: The 'Passenger Vehicles' segment leads the Generative AI in Autonomous Vehicles Market, holding a commanding 55% share.
- By End-User Analysis: Automotive manufacturers represent the largest end-user segment for Generative AI in Autonomous Vehicles, accounting for 70% of the market.
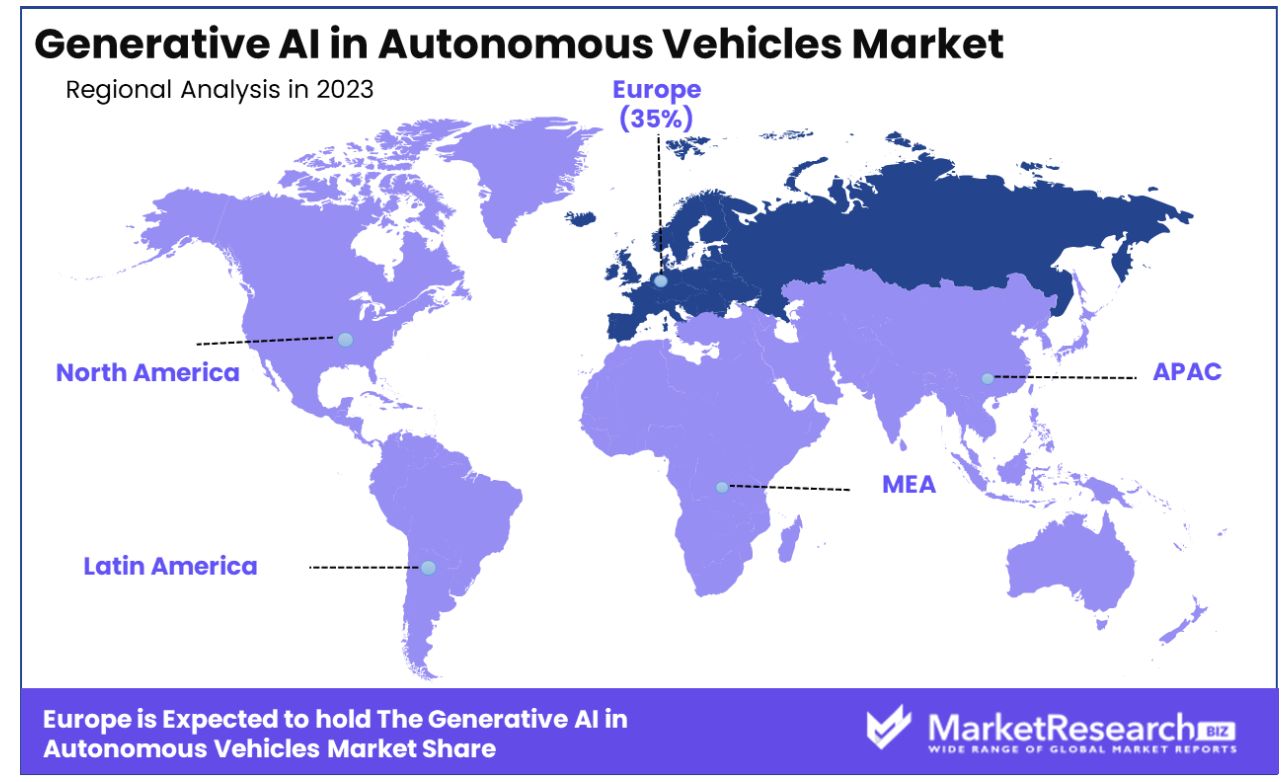
- Regional Dominance: Europe Dominates with a 35% Market Share
Driving factors
Investment in AI R&D Drives Market Growth
The surge in investments by leading automakers and tech giants in autonomous vehicle research and development marks a pivotal growth catalyst for the Generative AI in Autonomous Vehicles Market. Companies like Tesla, Waymo, GM, Ford, and Uber are channeling substantial resources into advancing AI technologies, particularly generative AI.
The commitment to generative AI research underscores a strategic pursuit of higher automation levels, positioning these firms at the forefront of the autonomous driving revolution. This influx of investment signifies robust confidence in generative AI's potential to redefine vehicle autonomy, promising a transformative impact on market dynamics and setting a solid foundation for future growth.
Technological Advancements in AI Models Propel Market Expansion
Rapid progress in deep learning and generative models, such as Generative Adversarial Networks (GANs), Variational Autoencoders (VAEs), and Diffusion models, is a significant driver for the Generative AI in Autonomous Vehicles Market.
These models' ability to generate synthetic sensor data for training autonomous systems allows for the utilization of extensive simulated datasets. This technological evolution enhances the training efficiency and effectiveness of autonomous driving algorithms, facilitating a leap in the development of autonomous vehicles. By enabling more sophisticated and comprehensive training scenarios, these advancements ensure autonomous systems can handle a wider range of driving conditions, thereby improving safety and reliability.
Enhanced Perception and Prediction Capabilities Fuel Market Growth
The growing need for advanced perception, prediction, and planning capabilities in self-driving cars is a significant growth driver for the Generative AI in Autonomous Vehicles Market. Generative AI plays a crucial role in meeting this demand by generating diverse driving scenarios and edge cases, which are essential for the robust training of autonomous systems.
This capacity to simulate a wide array of driving conditions ensures that autonomous vehicles are well-prepared for real-world challenges, significantly enhancing their safety and reliability. The integration of generative AI into the development of autonomous vehicles not only advances their operational capabilities but also boosts consumer confidence in this technology.
Restraining Factors
Regulatory Uncertainty Restrains Market Growth
The absence of comprehensive regulations and standards specifically tailored to the testing and validation of autonomous vehicles, especially those utilizing generative AI, significantly hampers market expansion. The current regulatory landscape struggles to keep pace with the rapid advancements in AI technology, creating a void that undermines consumer and stakeholder confidence.
Without stringent, clear, and universally accepted guidelines, the path to widespread adoption of autonomous vehicles becomes fraught with legal and safety concerns. This regulatory ambiguity not only slows down the commercialization of autonomous vehicles but also stifles innovation, as manufacturers and developers face uncertainties regarding compliance and future legal expectations.
Real-World Complexity Challenges AI Capability
The concerns surrounding the ability of generative AI models to adequately handle complex real-world driving situations act as a major restraint on the market's growth. While generative models are proficient in creating diverse and simulated driving scenarios for training purposes, their effectiveness in mimicking the unpredictability and variability of real-world environments is still under scrutiny.
The reliance on synthetic data necessitates a complementary integration with real-world driving data to ensure that autonomous vehicles can navigate safely and efficiently in all conditions. This gap between simulated training environments and real-world applicability raises questions about the readiness and reliability of generative AI-driven autonomous vehicles, curbing enthusiasm among potential users and investors.
By Component Analysis
In the Generative AI in Autonomous Vehicles Market, the 'Solution' segment, encompassing software and hardware solutions tailored for generative AI applications, dominates with a substantial 73% market share. This dominance is attributable to the critical need for sophisticated software solutions that leverage generative AI to enhance autonomous vehicle functionalities.
Solutions in this segment include advanced algorithms and models like GANs (Generative Adversarial Networks), VAEs (Variational Autoencoders), and Diffusion models, which are pivotal in generating synthetic data for training and testing autonomous systems. The high demand for these solutions stems from their ability to create vast, diverse datasets that mimic real-world scenarios, enabling more effective and comprehensive training of autonomous vehicles.
Software solutions, in particular, play a fundamental role in the development and operational efficiency of autonomous vehicles, offering capabilities for simulation, perception system enhancement, behavior prediction, and decision-making processes. The reliance on generative AI software is increasing as it provides a scalable, cost-effective method for improving the AI models that drive autonomous vehicles, without the need for exhaustive real-world data collection.
The 'Services' sub-segment, though not the dominant market share holder, is instrumental in supporting the deployment, maintenance, and optimization of generative AI solutions. Services include consultancy, integration, and support, which are essential for ensuring that the solutions are effectively implemented and yield the desired outcomes in autonomous vehicle development.
By Application Analysis
The 'Training & Data Augmentation' application segment holds the largest share, accounting for 25% of the market. This segment's prominence is driven by the indispensable role of generative AI in creating synthetic data to train autonomous driving systems.
The ability to augment real-world data with synthetic, yet realistic, scenarios enables the development of more robust, adaptable, and intelligent autonomous driving technologies. Training and data augmentation using generative AI significantly reduce the time and resources required to collect and label vast amounts of driving data, accelerating the pace of autonomous vehicle development.
This application is crucial for addressing the challenges associated with acquiring diverse and comprehensive datasets needed to train autonomous systems to handle various driving conditions and scenarios. By generating synthetic data that mimics edge cases and rare occurrences, generative AI enhances the perception, prediction, and decision-making capabilities of autonomous vehicles, leading to safer and more reliable navigation.
Other segments within the application category, such as 'Simulation and Testing,' 'Perception Systems Enhancement & Sensing,' 'Localization and Mapping,' 'Safety Verification & Testing,' 'Behavior Prediction & Decision Making,' and 'Others,' contribute to the overall growth by addressing specific needs in the development and deployment of autonomous vehicles.
By Vehicle Type Analysis
The 'Passenger Vehicles' segment leads the Generative AI in Autonomous Vehicles Market, holding a commanding 55% share. This dominance is underpinned by the increasing consumer demand for safer, more efficient, and technologically advanced vehicles.
Generative AI plays a pivotal role in meeting these demands by enhancing various aspects of autonomous driving technology, from perception and decision-making to safety verification and behavior prediction. The integration of generative AI into passenger vehicles is seen as a key factor in improving road safety, reducing accidents, and offering an enhanced driving experience, thereby driving consumer adoption.
The application of generative AI in passenger vehicles extends beyond safety, impacting environmental concerns through optimized driving patterns that potentially reduce fuel consumption and emissions. Moreover, the technology's ability to generate realistic driving scenarios for training and testing purposes accelerates the development and validation of autonomous driving systems, making passenger vehicles more appealing to a broader audience.
The 'Commercial Vehicles' segment, while not as large as passenger vehicles, is also a crucial area of growth. Generative AI in commercial vehicles focuses on improving logistics and transportation efficiency, reducing operational costs, and enhancing safety. This segment benefits from generative AI by optimizing route planning, cargo handling, and predictive maintenance, showcasing the technology's versatility across different vehicle applications.
By End-User Analysis
Automotive manufacturers represent the largest end-user segment for Generative AI in Autonomous Vehicles, accounting for 70% of the market. This group's primary focus is on incorporating generative AI into the design, development, and production stages of autonomous vehicles.
Automotive manufacturers leverage generative AI to streamline the R&D process, from conceptualization to simulation and testing, significantly reducing time-to-market for new models. This technology enables the creation of complex, varied datasets for training autonomous systems, ensuring that vehicles can navigate a wide range of driving conditions.
The role of generative AI in enhancing manufacturing processes, such as predictive maintenance and quality control, further solidifies its value to automotive manufacturers. By adopting generative AI, manufacturers can not only improve the safety and reliability of their vehicles but also gain a competitive edge in the rapidly evolving automotive market.
'Research & Development Organizations' form the other key segment, focusing on the foundational and innovative aspects of generative AI in autonomous vehicles. This segment's contributions are critical for advancing the underlying technologies and exploring new applications of generative AI in the automotive industry. Collaborations between R&D organizations and automotive manufacturers are essential for translating cutting-edge research into practical, market-ready solutions that drive the future of autonomous driving.
Generative AI in Autonomous Vehicles Industry Segments
By Component:
- Solution
- Services
By Application:
- Training & data augmentation
- Simulation and Testing
- Perception Systems Enhancement & Sensing
- Localization and Mapping
- Safety Verification & Testing
- Behavior Prediction & decision making
- Others
Vehicle Type:
- Passenger Vehicles
- Commercial Vehicles
End Users:
- Automotive Manufacturers
- Research & Development Organizations
Generative AI in Autonomous Vehicles Market Growth Opportunities
Virtual Testing and Validation Offers Growth Opportunity
Leveraging generative AI for virtual testing and validation of autonomous vehicles presents a significant growth opportunity in the market. This approach enables scalable testing environments where countless scenarios, including rare and hazardous conditions, can be simulated efficiently.
Such capabilities drastically reduce the time and resources required for bringing autonomous vehicles to market, as it allows for extensive testing without the need for physical prototypes in the early stages. Moreover, exploring a broader array of scenarios enhances the safety and reliability of autonomous vehicles, addressing one of the primary concerns of consumers and regulators alike.
Personalization in Autonomous Vehicles Drives Market Differentiation
The use of generative AI to create personalized in-cabin interfaces and experiences represents a unique avenue for differentiation in the autonomous vehicles market. By tailoring the in-cabin experience to individual preferences and needs, automakers can enhance rider satisfaction and loyalty. Personalized settings can range from adjusting the vehicle's driving style to entertainment and comfort features, making each journey more enjoyable and tailored to the rider's desires.
Generative AI in Autonomous Vehicles Market Trending Factors
Collaboration for Innovation Is Trending
Automakers collaborating with AI startups and tech firms to enhance their generative AI capabilities, as seen in partnerships like Mercedes-Benz and OpenAI, underscore a strategic growth opportunity.
These collaborations bring together automotive engineering expertise with cutting-edge AI research, accelerating the development of advanced autonomous driving technologies. By pooling resources and knowledge, these partnerships enable the rapid iteration and integration of generative AI into vehicles, pushing the boundaries of what's possible in autonomous driving.
Standardization in Generative AI Boosts Market Confidence
The focus on developing standardized benchmarks, metrics, and guidelines for evaluating the quality and safety of generative models for autonomous vehicles is crucial for market expansion. Standardization efforts contribute to a more transparent and predictable regulatory environment, making it easier for companies to navigate compliance and for consumers to trust the safety of autonomous vehicles.
By establishing clear criteria for generative AI applications in the automotive industry, stakeholders can ensure consistency, reliability, and safety across products, fostering consumer confidence and facilitating broader market adoption. This focus on standardization not only mitigates risks but also streamlines the path to market for new autonomous vehicle innovations.
Generative AI in Autonomous Vehicles Market Regional Analysis
Europe Dominates with a 35% Market Share
Europe's commanding 35% share in the Generative AI in Autonomous Vehicles Market is attributable to several key factors, including robust regulatory frameworks, significant investments in research and development, and a strong emphasis on safety and environmental standards.
The region's approach to regulating autonomous vehicle technology, with a focus on safety and data protection, has created a conducive environment for innovation and testing. Additionally, Europe's history of automotive excellence and the presence of leading automotive manufacturers have fueled advancements in generative AI applications. The collaboration between governments, academia, and the private sector in Europe further supports the region's leading position by fostering innovation ecosystems that drive the development of autonomous vehicle technologies.
North America: A Close Contender in the Market
With a significant market share, North America stands as a close contender in the Generative AI in Autonomous Vehicles Market. The region's strong performance is supported by its technological prowess, leading tech companies, and substantial investments in autonomous vehicle technology. North America benefits from a vibrant startup ecosystem, with numerous firms focusing on AI and autonomous driving innovations. Additionally, the presence of major technology firms that invest heavily in R&D contributes to the region's advancements in generative AI applications for autonomous vehicles.
Asia-Pacific: Emerging Powerhouse in Generative AI
Asia-Pacific is rapidly emerging as a powerhouse in the Generative AI in Autonomous Vehicles Market, driven by its fast-paced technological advancements, expanding automotive manufacturing base, and aggressive government initiatives aimed at smart transportation solutions. Countries like China, Japan, and South Korea are leading the charge, with significant investments in AI research and development, and a keen focus on integrating autonomous vehicles into public transportation systems.
Generative AI in Autonomous Vehicles Industry By Region
Key Regions and Countries
North America
- The US
- Canada
- Rest of North America
Europe
- Germany
- France
- The UK
- Spain
- Netherlands
- Russia
- Italy
- Rest of Europe
Asia-Pacific
- China
- Japan
- Singapore
- Thailand
- South Korea
- Vietnam
- India
- New Zealand
- Rest of Asia Pacific
Latin America
- Mexico
- Brazil
- Rest of Latin America
Middle East & Africa
- Saudi Arabia
- South Africa
- UAE
- Rest of the Middle East & Africa
Generative AI in Autonomous Vehicles Market Competitive Analysis
In the Generative AI in Autonomous Vehicles Market, companies such as NVIDIA, OpenAI, Waymo (Alphabet Inc.), and Baidu Apollo are at the forefront, driving technological advancements and market growth. NVIDIA's powerful GPUs and AI platforms provide the computational horsepower essential for training generative AI models.
OpenAI's research in AI and machine learning algorithms contributes to the foundational technologies enabling autonomous driving systems. Waymo, a leader in autonomous driving technologies, leverages generative AI for scenario simulation and decision-making processes, setting a high benchmark in operational safety and efficiency. Baidu Apollo, with its open-source platform, fosters collaboration and innovation in autonomous driving technologies across the global automotive industry.
Other notable players like Aptiv, Aurora, Motional, and TuSimple contribute specialized expertise in sensor integration, software development, and vehicle automation, enhancing the ecosystem's diversity and technological depth. Companies such as Zenuity, AI Motive, Applied Intuition, and DeepMap focus on specific niches within the autonomous driving domain, including navigation, simulation software, and cognitive vehicle systems, further enriching the market landscape.
Generative AI in Autonomous Vehicles Industry Key Players
- NVIDIA
- OpenAI
- Waymo (Alphabet Inc.)
- Baidu Apollo
- Aptiv
- Aurora
- Motional
- TuSimple
- Zenuity
- AI Motive
- Applied Intuition
- Ridecell
- Perceptive Automata
- DeepMap
- Idriverplus
- Other key players
Generative AI in Autonomous Vehicles Market Recent Development
- In December 2023 Waymo Announced plans to expand Waymo One service to other cities in 2024, demonstrating confidence in their AV technology, potentially driven by advancements in generative AI.
- In October 2023 NVIDIA Partnered with Mercedes-Benz to develop end-to-end AV solutions, leveraging NVIDIA’s AI hardware and software, which could involve generative components.
Report Scope
Report Features Description Market Value (2023) USD 3.0 Billion Forecast Revenue (2033) USD 21.90 Billion CAGR (2024-2032) 21.90% Base Year for Estimation 2023 Historic Period 2016-2023 Forecast Period 2024-2033 Report Coverage Revenue Forecast, Market Dynamics, COVID-19 Impact, Competitive Landscape, Recent Developments Segments Covered By Component:(Solution, Services), By Application:(Training & data augmentation, Simulation and Testing, Perception Systems Enhancement & Sensing, Localization and Mapping, Safety Verification & Testing, Behavior Prediction & decision making, Others), Vehicle Type:(Passenger Vehicles, Commercial Vehicles), End Users:(Automotive Manufacturers, Research & Development Organizations) Regional Analysis North America - The US, Canada, Rest of North America, Europe - Germany, France, The UK, Spain, Italy, Russia, Netherlands, Rest of Europe, Asia-Pacific - China, Japan, South Korea, India, New Zealand, Singapore, Thailand, Vietnam, Rest of Asia Pacific, Latin America - Brazil, Mexico, Rest of Latin America, Middle East & Africa - South Africa, Saudi Arabia, UAE, Rest of Middle East & Africa Competitive Landscape NVIDIA, OpenAI, Waymo (Alphabet Inc.), Baidu Apollo, Aptiv, Aurora, Motional, TuSimple, Zenuity, AI Motive, Applied Intuition, Ridecell, Perceptive Automata, DeepMap, Idriverplus, Other key players Customization Scope Customization for segments, region/country-level will be provided. Moreover, additional customization can be done based on the requirements. Purchase Options We have three licenses to opt for Single User License, Multi-User License (Up to 5 Users), Corporate Use License (Unlimited User and Printable PDF) -
- 1. Executive Summary
- 1.1. Definition
- 1.2. Taxonomy
- 1.3. Research Scope
- 1.4. Key Analysis
- 1.5. Key Findings by Major Segments
- 1.6. Top strategies by Major Players
- 2. Global Structural Health Monitoring Market Overview
- 2.1. Structural Health Monitoring Market Dynamics
- 2.1.1. Drivers
- 2.1.2. Opportunities
- 2.1.3. Restraints
- 2.1.4. Challenges
- 2.2. Macro-economic Factors
- 2.3. Regulatory Framework
- 2.4. Market Investment Feasibility Index
- 2.5. PEST Analysis
- 2.6. PORTER’S Five Force Analysis
- 2.7. Drivers & Restraints Impact Analysis
- 2.8. Industry Chain Analysis
- 2.9. Cost Structure Analysis
- 2.10. Marketing Strategy
- 2.11. Russia-Ukraine War Impact Analysis
- 2.12. Opportunity Map Analysis
- 2.13. Market Competition Scenario Analysis
- 2.14. Product Life Cycle Analysis
- 2.15. Opportunity Orbits
- 2.16. Manufacturer Intensity Map
- 2.17. Major Companies sales by Value & Volume
- 2.1. Structural Health Monitoring Market Dynamics
- 3. Global Structural Health Monitoring Market Analysis, Opportunity and Forecast, 2016-2032
- 3.1. Global Structural Health Monitoring Market Analysis, 2016-2021
- 3.2. Global Structural Health Monitoring Market Opportunity and Forecast, 2023-2032
- 3.3. Global Structural Health Monitoring Market Analysis, Opportunity and Forecast, By By Component, 2016-2032
- 3.3.1. Global Structural Health Monitoring Market Analysis by By Component: Introduction
- 3.3.2. Market Size Absolute $ Opportunity Analysis and Forecast, By By Component, 2016-2032
- 3.3.3. Solution
- 3.3.4. Services
- 3.4. Global Structural Health Monitoring Market Analysis, Opportunity and Forecast, By By Application, 2016-2032
- 3.4.1. Global Structural Health Monitoring Market Analysis by By Application: Introduction
- 3.4.2. Market Size Absolute $ Opportunity Analysis and Forecast, By By Application, 2016-2032
- 3.4.3. Training & data augmentation
- 3.4.4. Simulation and Testing
- 3.4.5. Perception Systems Enhancement & Sensing
- 3.4.6. Localization and Mapping
- 3.4.7. Safety Verification & Testing
- 3.4.8. Behavior Prediction & decision making
- 3.4.9. Others
- 3.5. Global Structural Health Monitoring Market Analysis, Opportunity and Forecast, By Vehicle Type, 2016-2032
- 3.5.1. Global Structural Health Monitoring Market Analysis by Vehicle Type: Introduction
- 3.5.2. Market Size Absolute $ Opportunity Analysis and Forecast, By Vehicle Type, 2016-2032
- 3.5.3. Passenger Vehicles
- 3.5.4. Commercial Vehicles
- 3.6. Global Structural Health Monitoring Market Analysis, Opportunity and Forecast, By End Users, 2016-2032
- 3.6.1. Global Structural Health Monitoring Market Analysis by End Users: Introduction
- 3.6.2. Market Size Absolute $ Opportunity Analysis and Forecast, By End Users, 2016-2032
- 3.6.3. Automotive Manufacturers
- 3.6.4. Research & Development Organizations
- 4. North America Structural Health Monitoring Market Analysis, Opportunity and Forecast, 2016-2032
- 4.1. North America Structural Health Monitoring Market Analysis, 2016-2021
- 4.2. North America Structural Health Monitoring Market Opportunity and Forecast, 2023-2032
- 4.3. North America Structural Health Monitoring Market Analysis, Opportunity and Forecast, By By Component, 2016-2032
- 4.3.1. North America Structural Health Monitoring Market Analysis by By Component: Introduction
- 4.3.2. Market Size Absolute $ Opportunity Analysis and Forecast, By By Component, 2016-2032
- 4.3.3. Solution
- 4.3.4. Services
- 4.4. North America Structural Health Monitoring Market Analysis, Opportunity and Forecast, By By Application, 2016-2032
- 4.4.1. North America Structural Health Monitoring Market Analysis by By Application: Introduction
- 4.4.2. Market Size Absolute $ Opportunity Analysis and Forecast, By By Application, 2016-2032
- 4.4.3. Training & data augmentation
- 4.4.4. Simulation and Testing
- 4.4.5. Perception Systems Enhancement & Sensing
- 4.4.6. Localization and Mapping
- 4.4.7. Safety Verification & Testing
- 4.4.8. Behavior Prediction & decision making
- 4.4.9. Others
- 4.5. North America Structural Health Monitoring Market Analysis, Opportunity and Forecast, By Vehicle Type, 2016-2032
- 4.5.1. North America Structural Health Monitoring Market Analysis by Vehicle Type: Introduction
- 4.5.2. Market Size Absolute $ Opportunity Analysis and Forecast, By Vehicle Type, 2016-2032
- 4.5.3. Passenger Vehicles
- 4.5.4. Commercial Vehicles
- 4.6. North America Structural Health Monitoring Market Analysis, Opportunity and Forecast, By End Users, 2016-2032
- 4.6.1. North America Structural Health Monitoring Market Analysis by End Users: Introduction
- 4.6.2. Market Size Absolute $ Opportunity Analysis and Forecast, By End Users, 2016-2032
- 4.6.3. Automotive Manufacturers
- 4.6.4. Research & Development Organizations
- 4.7. North America Structural Health Monitoring Market Analysis, Opportunity and Forecast, By Country , 2016-2032
- 4.7.1. North America Structural Health Monitoring Market Analysis by Country : Introduction
- 4.7.2. Market Size Absolute $ Opportunity Analysis and Forecast, Country , 2016-2032
- 4.7.2.1. The US
- 4.7.2.2. Canada
- 4.7.2.3. Mexico
- 5. Western Europe Structural Health Monitoring Market Analysis, Opportunity and Forecast, 2016-2032
- 5.1. Western Europe Structural Health Monitoring Market Analysis, 2016-2021
- 5.2. Western Europe Structural Health Monitoring Market Opportunity and Forecast, 2023-2032
- 5.3. Western Europe Structural Health Monitoring Market Analysis, Opportunity and Forecast, By By Component, 2016-2032
- 5.3.1. Western Europe Structural Health Monitoring Market Analysis by By Component: Introduction
- 5.3.2. Market Size Absolute $ Opportunity Analysis and Forecast, By By Component, 2016-2032
- 5.3.3. Solution
- 5.3.4. Services
- 5.4. Western Europe Structural Health Monitoring Market Analysis, Opportunity and Forecast, By By Application, 2016-2032
- 5.4.1. Western Europe Structural Health Monitoring Market Analysis by By Application: Introduction
- 5.4.2. Market Size Absolute $ Opportunity Analysis and Forecast, By By Application, 2016-2032
- 5.4.3. Training & data augmentation
- 5.4.4. Simulation and Testing
- 5.4.5. Perception Systems Enhancement & Sensing
- 5.4.6. Localization and Mapping
- 5.4.7. Safety Verification & Testing
- 5.4.8. Behavior Prediction & decision making
- 5.4.9. Others
- 5.5. Western Europe Structural Health Monitoring Market Analysis, Opportunity and Forecast, By Vehicle Type, 2016-2032
- 5.5.1. Western Europe Structural Health Monitoring Market Analysis by Vehicle Type: Introduction
- 5.5.2. Market Size Absolute $ Opportunity Analysis and Forecast, By Vehicle Type, 2016-2032
- 5.5.3. Passenger Vehicles
- 5.5.4. Commercial Vehicles
- 5.6. Western Europe Structural Health Monitoring Market Analysis, Opportunity and Forecast, By End Users, 2016-2032
- 5.6.1. Western Europe Structural Health Monitoring Market Analysis by End Users: Introduction
- 5.6.2. Market Size Absolute $ Opportunity Analysis and Forecast, By End Users, 2016-2032
- 5.6.3. Automotive Manufacturers
- 5.6.4. Research & Development Organizations
- 5.7. Western Europe Structural Health Monitoring Market Analysis, Opportunity and Forecast, By Country , 2016-2032
- 5.7.1. Western Europe Structural Health Monitoring Market Analysis by Country : Introduction
- 5.7.2. Market Size Absolute $ Opportunity Analysis and Forecast, Country , 2016-2032
- 5.7.2.1. Germany
- 5.7.2.2. France
- 5.7.2.3. The UK
- 5.7.2.4. Spain
- 5.7.2.5. Italy
- 5.7.2.6. Portugal
- 5.7.2.7. Ireland
- 5.7.2.8. Austria
- 5.7.2.9. Switzerland
- 5.7.2.10. Benelux
- 5.7.2.11. Nordic
- 5.7.2.12. Rest of Western Europe
- 6. Eastern Europe Structural Health Monitoring Market Analysis, Opportunity and Forecast, 2016-2032
- 6.1. Eastern Europe Structural Health Monitoring Market Analysis, 2016-2021
- 6.2. Eastern Europe Structural Health Monitoring Market Opportunity and Forecast, 2023-2032
- 6.3. Eastern Europe Structural Health Monitoring Market Analysis, Opportunity and Forecast, By By Component, 2016-2032
- 6.3.1. Eastern Europe Structural Health Monitoring Market Analysis by By Component: Introduction
- 6.3.2. Market Size Absolute $ Opportunity Analysis and Forecast, By By Component, 2016-2032
- 6.3.3. Solution
- 6.3.4. Services
- 6.4. Eastern Europe Structural Health Monitoring Market Analysis, Opportunity and Forecast, By By Application, 2016-2032
- 6.4.1. Eastern Europe Structural Health Monitoring Market Analysis by By Application: Introduction
- 6.4.2. Market Size Absolute $ Opportunity Analysis and Forecast, By By Application, 2016-2032
- 6.4.3. Training & data augmentation
- 6.4.4. Simulation and Testing
- 6.4.5. Perception Systems Enhancement & Sensing
- 6.4.6. Localization and Mapping
- 6.4.7. Safety Verification & Testing
- 6.4.8. Behavior Prediction & decision making
- 6.4.9. Others
- 6.5. Eastern Europe Structural Health Monitoring Market Analysis, Opportunity and Forecast, By Vehicle Type, 2016-2032
- 6.5.1. Eastern Europe Structural Health Monitoring Market Analysis by Vehicle Type: Introduction
- 6.5.2. Market Size Absolute $ Opportunity Analysis and Forecast, By Vehicle Type, 2016-2032
- 6.5.3. Passenger Vehicles
- 6.5.4. Commercial Vehicles
- 6.6. Eastern Europe Structural Health Monitoring Market Analysis, Opportunity and Forecast, By End Users, 2016-2032
- 6.6.1. Eastern Europe Structural Health Monitoring Market Analysis by End Users: Introduction
- 6.6.2. Market Size Absolute $ Opportunity Analysis and Forecast, By End Users, 2016-2032
- 6.6.3. Automotive Manufacturers
- 6.6.4. Research & Development Organizations
- 6.7. Eastern Europe Structural Health Monitoring Market Analysis, Opportunity and Forecast, By Country , 2016-2032
- 6.7.1. Eastern Europe Structural Health Monitoring Market Analysis by Country : Introduction
- 6.7.2. Market Size Absolute $ Opportunity Analysis and Forecast, Country , 2016-2032
- 6.7.2.1. Russia
- 6.7.2.2. Poland
- 6.7.2.3. The Czech Republic
- 6.7.2.4. Greece
- 6.7.2.5. Rest of Eastern Europe
- 7. APAC Structural Health Monitoring Market Analysis, Opportunity and Forecast, 2016-2032
- 7.1. APAC Structural Health Monitoring Market Analysis, 2016-2021
- 7.2. APAC Structural Health Monitoring Market Opportunity and Forecast, 2023-2032
- 7.3. APAC Structural Health Monitoring Market Analysis, Opportunity and Forecast, By By Component, 2016-2032
- 7.3.1. APAC Structural Health Monitoring Market Analysis by By Component: Introduction
- 7.3.2. Market Size Absolute $ Opportunity Analysis and Forecast, By By Component, 2016-2032
- 7.3.3. Solution
- 7.3.4. Services
- 7.4. APAC Structural Health Monitoring Market Analysis, Opportunity and Forecast, By By Application, 2016-2032
- 7.4.1. APAC Structural Health Monitoring Market Analysis by By Application: Introduction
- 7.4.2. Market Size Absolute $ Opportunity Analysis and Forecast, By By Application, 2016-2032
- 7.4.3. Training & data augmentation
- 7.4.4. Simulation and Testing
- 7.4.5. Perception Systems Enhancement & Sensing
- 7.4.6. Localization and Mapping
- 7.4.7. Safety Verification & Testing
- 7.4.8. Behavior Prediction & decision making
- 7.4.9. Others
- 7.5. APAC Structural Health Monitoring Market Analysis, Opportunity and Forecast, By Vehicle Type, 2016-2032
- 7.5.1. APAC Structural Health Monitoring Market Analysis by Vehicle Type: Introduction
- 7.5.2. Market Size Absolute $ Opportunity Analysis and Forecast, By Vehicle Type, 2016-2032
- 7.5.3. Passenger Vehicles
- 7.5.4. Commercial Vehicles
- 7.6. APAC Structural Health Monitoring Market Analysis, Opportunity and Forecast, By End Users, 2016-2032
- 7.6.1. APAC Structural Health Monitoring Market Analysis by End Users: Introduction
- 7.6.2. Market Size Absolute $ Opportunity Analysis and Forecast, By End Users, 2016-2032
- 7.6.3. Automotive Manufacturers
- 7.6.4. Research & Development Organizations
- 7.7. APAC Structural Health Monitoring Market Analysis, Opportunity and Forecast, By Country , 2016-2032
- 7.7.1. APAC Structural Health Monitoring Market Analysis by Country : Introduction
- 7.7.2. Market Size Absolute $ Opportunity Analysis and Forecast, Country , 2016-2032
- 7.7.2.1. China
- 7.7.2.2. Japan
- 7.7.2.3. South Korea
- 7.7.2.4. India
- 7.7.2.5. Australia & New Zeland
- 7.7.2.6. Indonesia
- 7.7.2.7. Malaysia
- 7.7.2.8. Philippines
- 7.7.2.9. Singapore
- 7.7.2.10. Thailand
- 7.7.2.11. Vietnam
- 7.7.2.12. Rest of APAC
- 8. Latin America Structural Health Monitoring Market Analysis, Opportunity and Forecast, 2016-2032
- 8.1. Latin America Structural Health Monitoring Market Analysis, 2016-2021
- 8.2. Latin America Structural Health Monitoring Market Opportunity and Forecast, 2023-2032
- 8.3. Latin America Structural Health Monitoring Market Analysis, Opportunity and Forecast, By By Component, 2016-2032
- 8.3.1. Latin America Structural Health Monitoring Market Analysis by By Component: Introduction
- 8.3.2. Market Size Absolute $ Opportunity Analysis and Forecast, By By Component, 2016-2032
- 8.3.3. Solution
- 8.3.4. Services
- 8.4. Latin America Structural Health Monitoring Market Analysis, Opportunity and Forecast, By By Application, 2016-2032
- 8.4.1. Latin America Structural Health Monitoring Market Analysis by By Application: Introduction
- 8.4.2. Market Size Absolute $ Opportunity Analysis and Forecast, By By Application, 2016-2032
- 8.4.3. Training & data augmentation
- 8.4.4. Simulation and Testing
- 8.4.5. Perception Systems Enhancement & Sensing
- 8.4.6. Localization and Mapping
- 8.4.7. Safety Verification & Testing
- 8.4.8. Behavior Prediction & decision making
- 8.4.9. Others
- 8.5. Latin America Structural Health Monitoring Market Analysis, Opportunity and Forecast, By Vehicle Type, 2016-2032
- 8.5.1. Latin America Structural Health Monitoring Market Analysis by Vehicle Type: Introduction
- 8.5.2. Market Size Absolute $ Opportunity Analysis and Forecast, By Vehicle Type, 2016-2032
- 8.5.3. Passenger Vehicles
- 8.5.4. Commercial Vehicles
- 8.6. Latin America Structural Health Monitoring Market Analysis, Opportunity and Forecast, By End Users, 2016-2032
- 8.6.1. Latin America Structural Health Monitoring Market Analysis by End Users: Introduction
- 8.6.2. Market Size Absolute $ Opportunity Analysis and Forecast, By End Users, 2016-2032
- 8.6.3. Automotive Manufacturers
- 8.6.4. Research & Development Organizations
- 8.7. Latin America Structural Health Monitoring Market Analysis, Opportunity and Forecast, By Country , 2016-2032
- 8.7.1. Latin America Structural Health Monitoring Market Analysis by Country : Introduction
- 8.7.2. Market Size Absolute $ Opportunity Analysis and Forecast, Country , 2016-2032
- 8.7.2.1. Brazil
- 8.7.2.2. Colombia
- 8.7.2.3. Chile
- 8.7.2.4. Argentina
- 8.7.2.5. Costa Rica
- 8.7.2.6. Rest of Latin America
- 9. Middle East & Africa Structural Health Monitoring Market Analysis, Opportunity and Forecast, 2016-2032
- 9.1. Middle East & Africa Structural Health Monitoring Market Analysis, 2016-2021
- 9.2. Middle East & Africa Structural Health Monitoring Market Opportunity and Forecast, 2023-2032
- 9.3. Middle East & Africa Structural Health Monitoring Market Analysis, Opportunity and Forecast, By By Component, 2016-2032
- 9.3.1. Middle East & Africa Structural Health Monitoring Market Analysis by By Component: Introduction
- 9.3.2. Market Size Absolute $ Opportunity Analysis and Forecast, By By Component, 2016-2032
- 9.3.3. Solution
- 9.3.4. Services
- 9.4. Middle East & Africa Structural Health Monitoring Market Analysis, Opportunity and Forecast, By By Application, 2016-2032
- 9.4.1. Middle East & Africa Structural Health Monitoring Market Analysis by By Application: Introduction
- 9.4.2. Market Size Absolute $ Opportunity Analysis and Forecast, By By Application, 2016-2032
- 9.4.3. Training & data augmentation
- 9.4.4. Simulation and Testing
- 9.4.5. Perception Systems Enhancement & Sensing
- 9.4.6. Localization and Mapping
- 9.4.7. Safety Verification & Testing
- 9.4.8. Behavior Prediction & decision making
- 9.4.9. Others
- 9.5. Middle East & Africa Structural Health Monitoring Market Analysis, Opportunity and Forecast, By Vehicle Type, 2016-2032
- 9.5.1. Middle East & Africa Structural Health Monitoring Market Analysis by Vehicle Type: Introduction
- 9.5.2. Market Size Absolute $ Opportunity Analysis and Forecast, By Vehicle Type, 2016-2032
- 9.5.3. Passenger Vehicles
- 9.5.4. Commercial Vehicles
- 9.6. Middle East & Africa Structural Health Monitoring Market Analysis, Opportunity and Forecast, By End Users, 2016-2032
- 9.6.1. Middle East & Africa Structural Health Monitoring Market Analysis by End Users: Introduction
- 9.6.2. Market Size Absolute $ Opportunity Analysis and Forecast, By End Users, 2016-2032
- 9.6.3. Automotive Manufacturers
- 9.6.4. Research & Development Organizations
- 9.7. Middle East & Africa Structural Health Monitoring Market Analysis, Opportunity and Forecast, By Country , 2016-2032
- 9.7.1. Middle East & Africa Structural Health Monitoring Market Analysis by Country : Introduction
- 9.7.2. Market Size Absolute $ Opportunity Analysis and Forecast, Country , 2016-2032
- 9.7.2.1. Algeria
- 9.7.2.2. Egypt
- 9.7.2.3. Israel
- 9.7.2.4. Kuwait
- 9.7.2.5. Nigeria
- 9.7.2.6. Saudi Arabia
- 9.7.2.7. South Africa
- 9.7.2.8. Turkey
- 9.7.2.9. The UAE
- 9.7.2.10. Rest of MEA
- 10. Global Structural Health Monitoring Market Analysis, Opportunity and Forecast, By Region , 2016-2032
- 10.1. Global Structural Health Monitoring Market Analysis by Region : Introduction
- 10.2. Market Size Absolute $ Opportunity Analysis and Forecast, By Region , 2016-2032
- 10.2.1. North America
- 10.2.2. Western Europe
- 10.2.3. Eastern Europe
- 10.2.4. APAC
- 10.2.5. Latin America
- 10.2.6. Middle East & Africa
- 11. Global Structural Health Monitoring Market Competitive Landscape, Market Share Analysis, and Company Profiles
- 11.1. Market Share Analysis
- 11.2. Company Profiles
- 11.3. NVIDIA
- 11.3.1. Company Overview
- 11.3.2. Financial Highlights
- 11.3.3. Product Portfolio
- 11.3.4. SWOT Analysis
- 11.3.5. Key Strategies and Developments
- 11.4. OpenAI
- 11.4.1. Company Overview
- 11.4.2. Financial Highlights
- 11.4.3. Product Portfolio
- 11.4.4. SWOT Analysis
- 11.4.5. Key Strategies and Developments
- 11.5. Waymo (Alphabet Inc.)
- 11.5.1. Company Overview
- 11.5.2. Financial Highlights
- 11.5.3. Product Portfolio
- 11.5.4. SWOT Analysis
- 11.5.5. Key Strategies and Developments
- 11.6. Baidu Apollo
- 11.6.1. Company Overview
- 11.6.2. Financial Highlights
- 11.6.3. Product Portfolio
- 11.6.4. SWOT Analysis
- 11.6.5. Key Strategies and Developments
- 11.7. Aptiv
- 11.7.1. Company Overview
- 11.7.2. Financial Highlights
- 11.7.3. Product Portfolio
- 11.7.4. SWOT Analysis
- 11.7.5. Key Strategies and Developments
- 11.8. Aurora
- 11.8.1. Company Overview
- 11.8.2. Financial Highlights
- 11.8.3. Product Portfolio
- 11.8.4. SWOT Analysis
- 11.8.5. Key Strategies and Developments
- 11.9. Motional
- 11.9.1. Company Overview
- 11.9.2. Financial Highlights
- 11.9.3. Product Portfolio
- 11.9.4. SWOT Analysis
- 11.9.5. Key Strategies and Developments
- 11.10. TuSimple
- 11.10.1. Company Overview
- 11.10.2. Financial Highlights
- 11.10.3. Product Portfolio
- 11.10.4. SWOT Analysis
- 11.10.5. Key Strategies and Developments
- 11.11. Zenuity
- 11.11.1. Company Overview
- 11.11.2. Financial Highlights
- 11.11.3. Product Portfolio
- 11.11.4. SWOT Analysis
- 11.11.5. Key Strategies and Developments
- 11.12. AI Motive
- 11.12.1. Company Overview
- 11.12.2. Financial Highlights
- 11.12.3. Product Portfolio
- 11.12.4. SWOT Analysis
- 11.12.5. Key Strategies and Developments
- 11.13.1. Company Overview
- 11.13.2. Financial Highlights
- 11.13.3. Product Portfolio
- 11.13.4. SWOT Analysis
- 11.13.5. Key Strategies and Developments
- 11.14. Applied Intuition
- 11.14.1. Company Overview
- 11.14.2. Financial Highlights
- 11.14.3. Product Portfolio
- 11.14.4. SWOT Analysis
- 11.14.5. Key Strategies and Developments
- 11.15. Perceptive Automata
- 11.15.1. Company Overview
- 11.15.2. Financial Highlights
- 11.15.3. Product Portfolio
- 11.15.4. SWOT Analysis
- 11.15.5. Key Strategies and Developments
- 11.16. DeepMap
- 11.16.1. Company Overview
- 11.16.2. Financial Highlights
- 11.16.3. Product Portfolio
- 11.16.4. SWOT Analysis
- 11.16.5. Key Strategies and Developments
- 11.17. Idriverplus
- 11.17.1. Company Overview
- 11.17.2. Financial Highlights
- 11.17.3. Product Portfolio
- 11.17.4. SWOT Analysis
- 11.17.5. Key Strategies and Developments
- 11.18. Other key players
- 11.18.1. Company Overview
- 11.18.2. Financial Highlights
- 11.18.3. Product Portfolio
- 11.18.4. SWOT Analysis
- 11.18.5. Key Strategies and Developments
- 12. Assumptions and Acronyms
- 13. Research Methodology
- 14. Contact
"
- List of Figures
- "
- Figure 1: Global Structural Health Monitoring Market Revenue (US$ Mn) Market Share by By Component in 2022
- Figure 2: Global Structural Health Monitoring Market Market Attractiveness Analysis by By Component, 2016-2032
- Figure 3: Global Structural Health Monitoring Market Revenue (US$ Mn) Market Share by By Applicationin 2022
- Figure 4: Global Structural Health Monitoring Market Market Attractiveness Analysis by By Application, 2016-2032
- Figure 5: Global Structural Health Monitoring Market Revenue (US$ Mn) Market Share by Vehicle Typein 2022
- Figure 6: Global Structural Health Monitoring Market Market Attractiveness Analysis by Vehicle Type, 2016-2032
- Figure 7: Global Structural Health Monitoring Market Revenue (US$ Mn) Market Share by End Usersin 2022
- Figure 8: Global Structural Health Monitoring Market Market Attractiveness Analysis by End Users, 2016-2032
- Figure 9: Global Structural Health Monitoring Market Revenue (US$ Mn) Market Share by Region in 2022
- Figure 10: Global Structural Health Monitoring Market Market Attractiveness Analysis by Region, 2016-2032
- Figure 11: Global Structural Health Monitoring Market Market Revenue (US$ Mn) (2016-2032)
- Figure 12: Global Structural Health Monitoring Market Market Revenue (US$ Mn) Comparison by Region (2016-2032)
- Figure 13: Global Structural Health Monitoring Market Market Revenue (US$ Mn) Comparison by By Component (2016-2032)
- Figure 14: Global Structural Health Monitoring Market Market Revenue (US$ Mn) Comparison by By Application (2016-2032)
- Figure 15: Global Structural Health Monitoring Market Market Revenue (US$ Mn) Comparison by Vehicle Type (2016-2032)
- Figure 16: Global Structural Health Monitoring Market Market Revenue (US$ Mn) Comparison by End Users (2016-2032)
- Figure 17: Global Structural Health Monitoring Market Market Y-o-Y Growth Rate Comparison by Region (2016-2032)
- Figure 18: Global Structural Health Monitoring Market Market Y-o-Y Growth Rate Comparison by By Component (2016-2032)
- Figure 19: Global Structural Health Monitoring Market Market Y-o-Y Growth Rate Comparison by By Application (2016-2032)
- Figure 20: Global Structural Health Monitoring Market Market Y-o-Y Growth Rate Comparison by Vehicle Type (2016-2032)
- Figure 21: Global Structural Health Monitoring Market Market Y-o-Y Growth Rate Comparison by End Users (2016-2032)
- Figure 22: Global Structural Health Monitoring Market Market Share Comparison by Region (2016-2032)
- Figure 23: Global Structural Health Monitoring Market Market Share Comparison by By Component (2016-2032)
- Figure 24: Global Structural Health Monitoring Market Market Share Comparison by By Application (2016-2032)
- Figure 25: Global Structural Health Monitoring Market Market Share Comparison by Vehicle Type (2016-2032)
- Figure 26: Global Structural Health Monitoring Market Market Share Comparison by End Users (2016-2032)
- Figure 27: North America Structural Health Monitoring Market Revenue (US$ Mn) Market Share by By Componentin 2022
- Figure 28: North America Structural Health Monitoring Market Market Attractiveness Analysis by By Component, 2016-2032
- Figure 29: North America Structural Health Monitoring Market Revenue (US$ Mn) Market Share by By Applicationin 2022
- Figure 30: North America Structural Health Monitoring Market Market Attractiveness Analysis by By Application, 2016-2032
- Figure 31: North America Structural Health Monitoring Market Revenue (US$ Mn) Market Share by Vehicle Typein 2022
- Figure 32: North America Structural Health Monitoring Market Market Attractiveness Analysis by Vehicle Type, 2016-2032
- Figure 33: North America Structural Health Monitoring Market Revenue (US$ Mn) Market Share by End Usersin 2022
- Figure 34: North America Structural Health Monitoring Market Market Attractiveness Analysis by End Users, 2016-2032
- Figure 35: North America Structural Health Monitoring Market Revenue (US$ Mn) Market Share by Country in 2022
- Figure 36: North America Structural Health Monitoring Market Market Attractiveness Analysis by Country, 2016-2032
- Figure 37: North America Structural Health Monitoring Market Market Revenue (US$ Mn) (2016-2032)
- Figure 38: North America Structural Health Monitoring Market Market Revenue (US$ Mn) Comparison by Country (2016-2032)
- Figure 39: North America Structural Health Monitoring Market Market Revenue (US$ Mn) Comparison by By Component (2016-2032)
- Figure 40: North America Structural Health Monitoring Market Market Revenue (US$ Mn) Comparison by By Application (2016-2032)
- Figure 41: North America Structural Health Monitoring Market Market Revenue (US$ Mn) Comparison by Vehicle Type (2016-2032)
- Figure 42: North America Structural Health Monitoring Market Market Revenue (US$ Mn) Comparison by End Users (2016-2032)
- Figure 43: North America Structural Health Monitoring Market Market Y-o-Y Growth Rate Comparison by Country (2016-2032)
- Figure 44: North America Structural Health Monitoring Market Market Y-o-Y Growth Rate Comparison by By Component (2016-2032)
- Figure 45: North America Structural Health Monitoring Market Market Y-o-Y Growth Rate Comparison by By Application (2016-2032)
- Figure 46: North America Structural Health Monitoring Market Market Y-o-Y Growth Rate Comparison by Vehicle Type (2016-2032)
- Figure 47: North America Structural Health Monitoring Market Market Y-o-Y Growth Rate Comparison by End Users (2016-2032)
- Figure 48: North America Structural Health Monitoring Market Market Share Comparison by Country (2016-2032)
- Figure 49: North America Structural Health Monitoring Market Market Share Comparison by By Component (2016-2032)
- Figure 50: North America Structural Health Monitoring Market Market Share Comparison by By Application (2016-2032)
- Figure 51: North America Structural Health Monitoring Market Market Share Comparison by Vehicle Type (2016-2032)
- Figure 52: North America Structural Health Monitoring Market Market Share Comparison by End Users (2016-2032)
- Figure 53: Western Europe Structural Health Monitoring Market Revenue (US$ Mn) Market Share by By Componentin 2022
- Figure 54: Western Europe Structural Health Monitoring Market Market Attractiveness Analysis by By Component, 2016-2032
- Figure 55: Western Europe Structural Health Monitoring Market Revenue (US$ Mn) Market Share by By Applicationin 2022
- Figure 56: Western Europe Structural Health Monitoring Market Market Attractiveness Analysis by By Application, 2016-2032
- Figure 57: Western Europe Structural Health Monitoring Market Revenue (US$ Mn) Market Share by Vehicle Typein 2022
- Figure 58: Western Europe Structural Health Monitoring Market Market Attractiveness Analysis by Vehicle Type, 2016-2032
- Figure 59: Western Europe Structural Health Monitoring Market Revenue (US$ Mn) Market Share by End Usersin 2022
- Figure 60: Western Europe Structural Health Monitoring Market Market Attractiveness Analysis by End Users, 2016-2032
- Figure 61: Western Europe Structural Health Monitoring Market Revenue (US$ Mn) Market Share by Country in 2022
- Figure 62: Western Europe Structural Health Monitoring Market Market Attractiveness Analysis by Country, 2016-2032
- Figure 63: Western Europe Structural Health Monitoring Market Market Revenue (US$ Mn) (2016-2032)
- Figure 64: Western Europe Structural Health Monitoring Market Market Revenue (US$ Mn) Comparison by Country (2016-2032)
- Figure 65: Western Europe Structural Health Monitoring Market Market Revenue (US$ Mn) Comparison by By Component (2016-2032)
- Figure 66: Western Europe Structural Health Monitoring Market Market Revenue (US$ Mn) Comparison by By Application (2016-2032)
- Figure 67: Western Europe Structural Health Monitoring Market Market Revenue (US$ Mn) Comparison by Vehicle Type (2016-2032)
- Figure 68: Western Europe Structural Health Monitoring Market Market Revenue (US$ Mn) Comparison by End Users (2016-2032)
- Figure 69: Western Europe Structural Health Monitoring Market Market Y-o-Y Growth Rate Comparison by Country (2016-2032)
- Figure 70: Western Europe Structural Health Monitoring Market Market Y-o-Y Growth Rate Comparison by By Component (2016-2032)
- Figure 71: Western Europe Structural Health Monitoring Market Market Y-o-Y Growth Rate Comparison by By Application (2016-2032)
- Figure 72: Western Europe Structural Health Monitoring Market Market Y-o-Y Growth Rate Comparison by Vehicle Type (2016-2032)
- Figure 73: Western Europe Structural Health Monitoring Market Market Y-o-Y Growth Rate Comparison by End Users (2016-2032)
- Figure 74: Western Europe Structural Health Monitoring Market Market Share Comparison by Country (2016-2032)
- Figure 75: Western Europe Structural Health Monitoring Market Market Share Comparison by By Component (2016-2032)
- Figure 76: Western Europe Structural Health Monitoring Market Market Share Comparison by By Application (2016-2032)
- Figure 77: Western Europe Structural Health Monitoring Market Market Share Comparison by Vehicle Type (2016-2032)
- Figure 78: Western Europe Structural Health Monitoring Market Market Share Comparison by End Users (2016-2032)
- Figure 79: Eastern Europe Structural Health Monitoring Market Revenue (US$ Mn) Market Share by By Componentin 2022
- Figure 80: Eastern Europe Structural Health Monitoring Market Market Attractiveness Analysis by By Component, 2016-2032
- Figure 81: Eastern Europe Structural Health Monitoring Market Revenue (US$ Mn) Market Share by By Applicationin 2022
- Figure 82: Eastern Europe Structural Health Monitoring Market Market Attractiveness Analysis by By Application, 2016-2032
- Figure 83: Eastern Europe Structural Health Monitoring Market Revenue (US$ Mn) Market Share by Vehicle Typein 2022
- Figure 84: Eastern Europe Structural Health Monitoring Market Market Attractiveness Analysis by Vehicle Type, 2016-2032
- Figure 85: Eastern Europe Structural Health Monitoring Market Revenue (US$ Mn) Market Share by End Usersin 2022
- Figure 86: Eastern Europe Structural Health Monitoring Market Market Attractiveness Analysis by End Users, 2016-2032
- Figure 87: Eastern Europe Structural Health Monitoring Market Revenue (US$ Mn) Market Share by Country in 2022
- Figure 88: Eastern Europe Structural Health Monitoring Market Market Attractiveness Analysis by Country, 2016-2032
- Figure 89: Eastern Europe Structural Health Monitoring Market Market Revenue (US$ Mn) (2016-2032)
- Figure 90: Eastern Europe Structural Health Monitoring Market Market Revenue (US$ Mn) Comparison by Country (2016-2032)
- Figure 91: Eastern Europe Structural Health Monitoring Market Market Revenue (US$ Mn) Comparison by By Component (2016-2032)
- Figure 92: Eastern Europe Structural Health Monitoring Market Market Revenue (US$ Mn) Comparison by By Application (2016-2032)
- Figure 93: Eastern Europe Structural Health Monitoring Market Market Revenue (US$ Mn) Comparison by Vehicle Type (2016-2032)
- Figure 94: Eastern Europe Structural Health Monitoring Market Market Revenue (US$ Mn) Comparison by End Users (2016-2032)
- Figure 95: Eastern Europe Structural Health Monitoring Market Market Y-o-Y Growth Rate Comparison by Country (2016-2032)
- Figure 96: Eastern Europe Structural Health Monitoring Market Market Y-o-Y Growth Rate Comparison by By Component (2016-2032)
- Figure 97: Eastern Europe Structural Health Monitoring Market Market Y-o-Y Growth Rate Comparison by By Application (2016-2032)
- Figure 98: Eastern Europe Structural Health Monitoring Market Market Y-o-Y Growth Rate Comparison by Vehicle Type (2016-2032)
- Figure 99: Eastern Europe Structural Health Monitoring Market Market Y-o-Y Growth Rate Comparison by End Users (2016-2032)
- Figure 100: Eastern Europe Structural Health Monitoring Market Market Share Comparison by Country (2016-2032)
- Figure 101: Eastern Europe Structural Health Monitoring Market Market Share Comparison by By Component (2016-2032)
- Figure 102: Eastern Europe Structural Health Monitoring Market Market Share Comparison by By Application (2016-2032)
- Figure 103: Eastern Europe Structural Health Monitoring Market Market Share Comparison by Vehicle Type (2016-2032)
- Figure 104: Eastern Europe Structural Health Monitoring Market Market Share Comparison by End Users (2016-2032)
- Figure 105: APAC Structural Health Monitoring Market Revenue (US$ Mn) Market Share by By Componentin 2022
- Figure 106: APAC Structural Health Monitoring Market Market Attractiveness Analysis by By Component, 2016-2032
- Figure 107: APAC Structural Health Monitoring Market Revenue (US$ Mn) Market Share by By Applicationin 2022
- Figure 108: APAC Structural Health Monitoring Market Market Attractiveness Analysis by By Application, 2016-2032
- Figure 109: APAC Structural Health Monitoring Market Revenue (US$ Mn) Market Share by Vehicle Typein 2022
- Figure 110: APAC Structural Health Monitoring Market Market Attractiveness Analysis by Vehicle Type, 2016-2032
- Figure 111: APAC Structural Health Monitoring Market Revenue (US$ Mn) Market Share by End Usersin 2022
- Figure 112: APAC Structural Health Monitoring Market Market Attractiveness Analysis by End Users, 2016-2032
- Figure 113: APAC Structural Health Monitoring Market Revenue (US$ Mn) Market Share by Country in 2022
- Figure 114: APAC Structural Health Monitoring Market Market Attractiveness Analysis by Country, 2016-2032
- Figure 115: APAC Structural Health Monitoring Market Market Revenue (US$ Mn) (2016-2032)
- Figure 116: APAC Structural Health Monitoring Market Market Revenue (US$ Mn) Comparison by Country (2016-2032)
- Figure 117: APAC Structural Health Monitoring Market Market Revenue (US$ Mn) Comparison by By Component (2016-2032)
- Figure 118: APAC Structural Health Monitoring Market Market Revenue (US$ Mn) Comparison by By Application (2016-2032)
- Figure 119: APAC Structural Health Monitoring Market Market Revenue (US$ Mn) Comparison by Vehicle Type (2016-2032)
- Figure 120: APAC Structural Health Monitoring Market Market Revenue (US$ Mn) Comparison by End Users (2016-2032)
- Figure 121: APAC Structural Health Monitoring Market Market Y-o-Y Growth Rate Comparison by Country (2016-2032)
- Figure 122: APAC Structural Health Monitoring Market Market Y-o-Y Growth Rate Comparison by By Component (2016-2032)
- Figure 123: APAC Structural Health Monitoring Market Market Y-o-Y Growth Rate Comparison by By Application (2016-2032)
- Figure 124: APAC Structural Health Monitoring Market Market Y-o-Y Growth Rate Comparison by Vehicle Type (2016-2032)
- Figure 125: APAC Structural Health Monitoring Market Market Y-o-Y Growth Rate Comparison by End Users (2016-2032)
- Figure 126: APAC Structural Health Monitoring Market Market Share Comparison by Country (2016-2032)
- Figure 127: APAC Structural Health Monitoring Market Market Share Comparison by By Component (2016-2032)
- Figure 128: APAC Structural Health Monitoring Market Market Share Comparison by By Application (2016-2032)
- Figure 129: APAC Structural Health Monitoring Market Market Share Comparison by Vehicle Type (2016-2032)
- Figure 130: APAC Structural Health Monitoring Market Market Share Comparison by End Users (2016-2032)
- Figure 131: Latin America Structural Health Monitoring Market Revenue (US$ Mn) Market Share by By Componentin 2022
- Figure 132: Latin America Structural Health Monitoring Market Market Attractiveness Analysis by By Component, 2016-2032
- Figure 133: Latin America Structural Health Monitoring Market Revenue (US$ Mn) Market Share by By Applicationin 2022
- Figure 134: Latin America Structural Health Monitoring Market Market Attractiveness Analysis by By Application, 2016-2032
- Figure 135: Latin America Structural Health Monitoring Market Revenue (US$ Mn) Market Share by Vehicle Typein 2022
- Figure 136: Latin America Structural Health Monitoring Market Market Attractiveness Analysis by Vehicle Type, 2016-2032
- Figure 137: Latin America Structural Health Monitoring Market Revenue (US$ Mn) Market Share by End Usersin 2022
- Figure 138: Latin America Structural Health Monitoring Market Market Attractiveness Analysis by End Users, 2016-2032
- Figure 139: Latin America Structural Health Monitoring Market Revenue (US$ Mn) Market Share by Country in 2022
- Figure 140: Latin America Structural Health Monitoring Market Market Attractiveness Analysis by Country, 2016-2032
- Figure 141: Latin America Structural Health Monitoring Market Market Revenue (US$ Mn) (2016-2032)
- Figure 142: Latin America Structural Health Monitoring Market Market Revenue (US$ Mn) Comparison by Country (2016-2032)
- Figure 143: Latin America Structural Health Monitoring Market Market Revenue (US$ Mn) Comparison by By Component (2016-2032)
- Figure 144: Latin America Structural Health Monitoring Market Market Revenue (US$ Mn) Comparison by By Application (2016-2032)
- Figure 145: Latin America Structural Health Monitoring Market Market Revenue (US$ Mn) Comparison by Vehicle Type (2016-2032)
- Figure 146: Latin America Structural Health Monitoring Market Market Revenue (US$ Mn) Comparison by End Users (2016-2032)
- Figure 147: Latin America Structural Health Monitoring Market Market Y-o-Y Growth Rate Comparison by Country (2016-2032)
- Figure 148: Latin America Structural Health Monitoring Market Market Y-o-Y Growth Rate Comparison by By Component (2016-2032)
- Figure 149: Latin America Structural Health Monitoring Market Market Y-o-Y Growth Rate Comparison by By Application (2016-2032)
- Figure 150: Latin America Structural Health Monitoring Market Market Y-o-Y Growth Rate Comparison by Vehicle Type (2016-2032)
- Figure 151: Latin America Structural Health Monitoring Market Market Y-o-Y Growth Rate Comparison by End Users (2016-2032)
- Figure 152: Latin America Structural Health Monitoring Market Market Share Comparison by Country (2016-2032)
- Figure 153: Latin America Structural Health Monitoring Market Market Share Comparison by By Component (2016-2032)
- Figure 154: Latin America Structural Health Monitoring Market Market Share Comparison by By Application (2016-2032)
- Figure 155: Latin America Structural Health Monitoring Market Market Share Comparison by Vehicle Type (2016-2032)
- Figure 156: Latin America Structural Health Monitoring Market Market Share Comparison by End Users (2016-2032)
- Figure 157: Middle East & Africa Structural Health Monitoring Market Revenue (US$ Mn) Market Share by By Componentin 2022
- Figure 158: Middle East & Africa Structural Health Monitoring Market Market Attractiveness Analysis by By Component, 2016-2032
- Figure 159: Middle East & Africa Structural Health Monitoring Market Revenue (US$ Mn) Market Share by By Applicationin 2022
- Figure 160: Middle East & Africa Structural Health Monitoring Market Market Attractiveness Analysis by By Application, 2016-2032
- Figure 161: Middle East & Africa Structural Health Monitoring Market Revenue (US$ Mn) Market Share by Vehicle Typein 2022
- Figure 162: Middle East & Africa Structural Health Monitoring Market Market Attractiveness Analysis by Vehicle Type, 2016-2032
- Figure 163: Middle East & Africa Structural Health Monitoring Market Revenue (US$ Mn) Market Share by End Usersin 2022
- Figure 164: Middle East & Africa Structural Health Monitoring Market Market Attractiveness Analysis by End Users, 2016-2032
- Figure 165: Middle East & Africa Structural Health Monitoring Market Revenue (US$ Mn) Market Share by Country in 2022
- Figure 166: Middle East & Africa Structural Health Monitoring Market Market Attractiveness Analysis by Country, 2016-2032
- Figure 167: Middle East & Africa Structural Health Monitoring Market Market Revenue (US$ Mn) (2016-2032)
- Figure 168: Middle East & Africa Structural Health Monitoring Market Market Revenue (US$ Mn) Comparison by Country (2016-2032)
- Figure 169: Middle East & Africa Structural Health Monitoring Market Market Revenue (US$ Mn) Comparison by By Component (2016-2032)
- Figure 170: Middle East & Africa Structural Health Monitoring Market Market Revenue (US$ Mn) Comparison by By Application (2016-2032)
- Figure 171: Middle East & Africa Structural Health Monitoring Market Market Revenue (US$ Mn) Comparison by Vehicle Type (2016-2032)
- Figure 172: Middle East & Africa Structural Health Monitoring Market Market Revenue (US$ Mn) Comparison by End Users (2016-2032)
- Figure 173: Middle East & Africa Structural Health Monitoring Market Market Y-o-Y Growth Rate Comparison by Country (2016-2032)
- Figure 174: Middle East & Africa Structural Health Monitoring Market Market Y-o-Y Growth Rate Comparison by By Component (2016-2032)
- Figure 175: Middle East & Africa Structural Health Monitoring Market Market Y-o-Y Growth Rate Comparison by By Application (2016-2032)
- Figure 176: Middle East & Africa Structural Health Monitoring Market Market Y-o-Y Growth Rate Comparison by Vehicle Type (2016-2032)
- Figure 177: Middle East & Africa Structural Health Monitoring Market Market Y-o-Y Growth Rate Comparison by End Users (2016-2032)
- Figure 178: Middle East & Africa Structural Health Monitoring Market Market Share Comparison by Country (2016-2032)
- Figure 179: Middle East & Africa Structural Health Monitoring Market Market Share Comparison by By Component (2016-2032)
- Figure 180: Middle East & Africa Structural Health Monitoring Market Market Share Comparison by By Application (2016-2032)
- Figure 181: Middle East & Africa Structural Health Monitoring Market Market Share Comparison by Vehicle Type (2016-2032)
- Figure 182: Middle East & Africa Structural Health Monitoring Market Market Share Comparison by End Users (2016-2032)
"
- List of Tables
- "
- Table 1: Global Structural Health Monitoring Market Market Comparison by By Component (2016-2032)
- Table 2: Global Structural Health Monitoring Market Market Comparison by By Application (2016-2032)
- Table 3: Global Structural Health Monitoring Market Market Comparison by Vehicle Type (2016-2032)
- Table 4: Global Structural Health Monitoring Market Market Comparison by End Users (2016-2032)
- Table 5: Global Structural Health Monitoring Market Revenue (US$ Mn) Comparison by Region (2016-2032)
- Table 6: Global Structural Health Monitoring Market Market Revenue (US$ Mn) (2016-2032)
- Table 7: Global Structural Health Monitoring Market Market Revenue (US$ Mn) Comparison by Region (2016-2032)
- Table 8: Global Structural Health Monitoring Market Market Revenue (US$ Mn) Comparison by By Component (2016-2032)
- Table 9: Global Structural Health Monitoring Market Market Revenue (US$ Mn) Comparison by By Application (2016-2032)
- Table 10: Global Structural Health Monitoring Market Market Revenue (US$ Mn) Comparison by Vehicle Type (2016-2032)
- Table 11: Global Structural Health Monitoring Market Market Revenue (US$ Mn) Comparison by End Users (2016-2032)
- Table 12: Global Structural Health Monitoring Market Market Y-o-Y Growth Rate Comparison by Region (2016-2032)
- Table 13: Global Structural Health Monitoring Market Market Y-o-Y Growth Rate Comparison by By Component (2016-2032)
- Table 14: Global Structural Health Monitoring Market Market Y-o-Y Growth Rate Comparison by By Application (2016-2032)
- Table 15: Global Structural Health Monitoring Market Market Y-o-Y Growth Rate Comparison by Vehicle Type (2016-2032)
- Table 16: Global Structural Health Monitoring Market Market Y-o-Y Growth Rate Comparison by End Users (2016-2032)
- Table 17: Global Structural Health Monitoring Market Market Share Comparison by Region (2016-2032)
- Table 18: Global Structural Health Monitoring Market Market Share Comparison by By Component (2016-2032)
- Table 19: Global Structural Health Monitoring Market Market Share Comparison by By Application (2016-2032)
- Table 20: Global Structural Health Monitoring Market Market Share Comparison by Vehicle Type (2016-2032)
- Table 21: Global Structural Health Monitoring Market Market Share Comparison by End Users (2016-2032)
- Table 22: North America Structural Health Monitoring Market Market Comparison by By Application (2016-2032)
- Table 23: North America Structural Health Monitoring Market Market Comparison by Vehicle Type (2016-2032)
- Table 24: North America Structural Health Monitoring Market Market Comparison by End Users (2016-2032)
- Table 25: North America Structural Health Monitoring Market Revenue (US$ Mn) Comparison by Country (2016-2032)
- Table 26: North America Structural Health Monitoring Market Market Revenue (US$ Mn) (2016-2032)
- Table 27: North America Structural Health Monitoring Market Market Revenue (US$ Mn) Comparison by Country (2016-2032)
- Table 28: North America Structural Health Monitoring Market Market Revenue (US$ Mn) Comparison by By Component (2016-2032)
- Table 29: North America Structural Health Monitoring Market Market Revenue (US$ Mn) Comparison by By Application (2016-2032)
- Table 30: North America Structural Health Monitoring Market Market Revenue (US$ Mn) Comparison by Vehicle Type (2016-2032)
- Table 31: North America Structural Health Monitoring Market Market Revenue (US$ Mn) Comparison by End Users (2016-2032)
- Table 32: North America Structural Health Monitoring Market Market Y-o-Y Growth Rate Comparison by Country (2016-2032)
- Table 33: North America Structural Health Monitoring Market Market Y-o-Y Growth Rate Comparison by By Component (2016-2032)
- Table 34: North America Structural Health Monitoring Market Market Y-o-Y Growth Rate Comparison by By Application (2016-2032)
- Table 35: North America Structural Health Monitoring Market Market Y-o-Y Growth Rate Comparison by Vehicle Type (2016-2032)
- Table 36: North America Structural Health Monitoring Market Market Y-o-Y Growth Rate Comparison by End Users (2016-2032)
- Table 37: North America Structural Health Monitoring Market Market Share Comparison by Country (2016-2032)
- Table 38: North America Structural Health Monitoring Market Market Share Comparison by By Component (2016-2032)
- Table 39: North America Structural Health Monitoring Market Market Share Comparison by By Application (2016-2032)
- Table 40: North America Structural Health Monitoring Market Market Share Comparison by Vehicle Type (2016-2032)
- Table 41: North America Structural Health Monitoring Market Market Share Comparison by End Users (2016-2032)
- Table 42: Western Europe Structural Health Monitoring Market Market Comparison by By Component (2016-2032)
- Table 43: Western Europe Structural Health Monitoring Market Market Comparison by By Application (2016-2032)
- Table 44: Western Europe Structural Health Monitoring Market Market Comparison by Vehicle Type (2016-2032)
- Table 45: Western Europe Structural Health Monitoring Market Market Comparison by End Users (2016-2032)
- Table 46: Western Europe Structural Health Monitoring Market Revenue (US$ Mn) Comparison by Country (2016-2032)
- Table 47: Western Europe Structural Health Monitoring Market Market Revenue (US$ Mn) (2016-2032)
- Table 48: Western Europe Structural Health Monitoring Market Market Revenue (US$ Mn) Comparison by Country (2016-2032)
- Table 49: Western Europe Structural Health Monitoring Market Market Revenue (US$ Mn) Comparison by By Component (2016-2032)
- Table 50: Western Europe Structural Health Monitoring Market Market Revenue (US$ Mn) Comparison by By Application (2016-2032)
- Table 51: Western Europe Structural Health Monitoring Market Market Revenue (US$ Mn) Comparison by Vehicle Type (2016-2032)
- Table 52: Western Europe Structural Health Monitoring Market Market Revenue (US$ Mn) Comparison by End Users (2016-2032)
- Table 53: Western Europe Structural Health Monitoring Market Market Y-o-Y Growth Rate Comparison by Country (2016-2032)
- Table 54: Western Europe Structural Health Monitoring Market Market Y-o-Y Growth Rate Comparison by By Component (2016-2032)
- Table 55: Western Europe Structural Health Monitoring Market Market Y-o-Y Growth Rate Comparison by By Application (2016-2032)
- Table 56: Western Europe Structural Health Monitoring Market Market Y-o-Y Growth Rate Comparison by Vehicle Type (2016-2032)
- Table 57: Western Europe Structural Health Monitoring Market Market Y-o-Y Growth Rate Comparison by End Users (2016-2032)
- Table 58: Western Europe Structural Health Monitoring Market Market Share Comparison by Country (2016-2032)
- Table 59: Western Europe Structural Health Monitoring Market Market Share Comparison by By Component (2016-2032)
- Table 60: Western Europe Structural Health Monitoring Market Market Share Comparison by By Application (2016-2032)
- Table 61: Western Europe Structural Health Monitoring Market Market Share Comparison by Vehicle Type (2016-2032)
- Table 62: Western Europe Structural Health Monitoring Market Market Share Comparison by End Users (2016-2032)
- Table 63: Eastern Europe Structural Health Monitoring Market Market Comparison by By Component (2016-2032)
- Table 64: Eastern Europe Structural Health Monitoring Market Market Comparison by By Application (2016-2032)
- Table 65: Eastern Europe Structural Health Monitoring Market Market Comparison by Vehicle Type (2016-2032)
- Table 66: Eastern Europe Structural Health Monitoring Market Market Comparison by End Users (2016-2032)
- Table 67: Eastern Europe Structural Health Monitoring Market Revenue (US$ Mn) Comparison by Country (2016-2032)
- Table 68: Eastern Europe Structural Health Monitoring Market Market Revenue (US$ Mn) (2016-2032)
- Table 69: Eastern Europe Structural Health Monitoring Market Market Revenue (US$ Mn) Comparison by Country (2016-2032)
- Table 70: Eastern Europe Structural Health Monitoring Market Market Revenue (US$ Mn) Comparison by By Component (2016-2032)
- Table 71: Eastern Europe Structural Health Monitoring Market Market Revenue (US$ Mn) Comparison by By Application (2016-2032)
- Table 72: Eastern Europe Structural Health Monitoring Market Market Revenue (US$ Mn) Comparison by Vehicle Type (2016-2032)
- Table 73: Eastern Europe Structural Health Monitoring Market Market Revenue (US$ Mn) Comparison by End Users (2016-2032)
- Table 74: Eastern Europe Structural Health Monitoring Market Market Y-o-Y Growth Rate Comparison by Country (2016-2032)
- Table 75: Eastern Europe Structural Health Monitoring Market Market Y-o-Y Growth Rate Comparison by By Component (2016-2032)
- Table 76: Eastern Europe Structural Health Monitoring Market Market Y-o-Y Growth Rate Comparison by By Application (2016-2032)
- Table 77: Eastern Europe Structural Health Monitoring Market Market Y-o-Y Growth Rate Comparison by Vehicle Type (2016-2032)
- Table 78: Eastern Europe Structural Health Monitoring Market Market Y-o-Y Growth Rate Comparison by End Users (2016-2032)
- Table 79: Eastern Europe Structural Health Monitoring Market Market Share Comparison by Country (2016-2032)
- Table 80: Eastern Europe Structural Health Monitoring Market Market Share Comparison by By Component (2016-2032)
- Table 81: Eastern Europe Structural Health Monitoring Market Market Share Comparison by By Application (2016-2032)
- Table 82: Eastern Europe Structural Health Monitoring Market Market Share Comparison by Vehicle Type (2016-2032)
- Table 83: Eastern Europe Structural Health Monitoring Market Market Share Comparison by End Users (2016-2032)
- Table 84: APAC Structural Health Monitoring Market Market Comparison by By Component (2016-2032)
- Table 85: APAC Structural Health Monitoring Market Market Comparison by By Application (2016-2032)
- Table 86: APAC Structural Health Monitoring Market Market Comparison by Vehicle Type (2016-2032)
- Table 87: APAC Structural Health Monitoring Market Market Comparison by End Users (2016-2032)
- Table 88: APAC Structural Health Monitoring Market Revenue (US$ Mn) Comparison by Country (2016-2032)
- Table 89: APAC Structural Health Monitoring Market Market Revenue (US$ Mn) (2016-2032)
- Table 90: APAC Structural Health Monitoring Market Market Revenue (US$ Mn) Comparison by Country (2016-2032)
- Table 91: APAC Structural Health Monitoring Market Market Revenue (US$ Mn) Comparison by By Component (2016-2032)
- Table 92: APAC Structural Health Monitoring Market Market Revenue (US$ Mn) Comparison by By Application (2016-2032)
- Table 93: APAC Structural Health Monitoring Market Market Revenue (US$ Mn) Comparison by Vehicle Type (2016-2032)
- Table 94: APAC Structural Health Monitoring Market Market Revenue (US$ Mn) Comparison by End Users (2016-2032)
- Table 95: APAC Structural Health Monitoring Market Market Y-o-Y Growth Rate Comparison by Country (2016-2032)
- Table 96: APAC Structural Health Monitoring Market Market Y-o-Y Growth Rate Comparison by By Component (2016-2032)
- Table 97: APAC Structural Health Monitoring Market Market Y-o-Y Growth Rate Comparison by By Application (2016-2032)
- Table 98: APAC Structural Health Monitoring Market Market Y-o-Y Growth Rate Comparison by Vehicle Type (2016-2032)
- Table 99: APAC Structural Health Monitoring Market Market Y-o-Y Growth Rate Comparison by End Users (2016-2032)
- Table 100: APAC Structural Health Monitoring Market Market Share Comparison by Country (2016-2032)
- Table 101: APAC Structural Health Monitoring Market Market Share Comparison by By Component (2016-2032)
- Table 102: APAC Structural Health Monitoring Market Market Share Comparison by By Application (2016-2032)
- Table 103: APAC Structural Health Monitoring Market Market Share Comparison by Vehicle Type (2016-2032)
- Table 104: APAC Structural Health Monitoring Market Market Share Comparison by End Users (2016-2032)
- Table 105: Latin America Structural Health Monitoring Market Market Comparison by By Component (2016-2032)
- Table 106: Latin America Structural Health Monitoring Market Market Comparison by By Application (2016-2032)
- Table 107: Latin America Structural Health Monitoring Market Market Comparison by Vehicle Type (2016-2032)
- Table 108: Latin America Structural Health Monitoring Market Market Comparison by End Users (2016-2032)
- Table 109: Latin America Structural Health Monitoring Market Revenue (US$ Mn) Comparison by Country (2016-2032)
- Table 110: Latin America Structural Health Monitoring Market Market Revenue (US$ Mn) (2016-2032)
- Table 111: Latin America Structural Health Monitoring Market Market Revenue (US$ Mn) Comparison by Country (2016-2032)
- Table 112: Latin America Structural Health Monitoring Market Market Revenue (US$ Mn) Comparison by By Component (2016-2032)
- Table 113: Latin America Structural Health Monitoring Market Market Revenue (US$ Mn) Comparison by By Application (2016-2032)
- Table 114: Latin America Structural Health Monitoring Market Market Revenue (US$ Mn) Comparison by Vehicle Type (2016-2032)
- Table 115: Latin America Structural Health Monitoring Market Market Revenue (US$ Mn) Comparison by End Users (2016-2032)
- Table 116: Latin America Structural Health Monitoring Market Market Y-o-Y Growth Rate Comparison by Country (2016-2032)
- Table 117: Latin America Structural Health Monitoring Market Market Y-o-Y Growth Rate Comparison by By Component (2016-2032)
- Table 118: Latin America Structural Health Monitoring Market Market Y-o-Y Growth Rate Comparison by By Application (2016-2032)
- Table 119: Latin America Structural Health Monitoring Market Market Y-o-Y Growth Rate Comparison by Vehicle Type (2016-2032)
- Table 120: Latin America Structural Health Monitoring Market Market Y-o-Y Growth Rate Comparison by End Users (2016-2032)
- Table 121: Latin America Structural Health Monitoring Market Market Share Comparison by Country (2016-2032)
- Table 122: Latin America Structural Health Monitoring Market Market Share Comparison by By Component (2016-2032)
- Table 123: Latin America Structural Health Monitoring Market Market Share Comparison by By Application (2016-2032)
- Table 124: Latin America Structural Health Monitoring Market Market Share Comparison by Vehicle Type (2016-2032)
- Table 125: Latin America Structural Health Monitoring Market Market Share Comparison by End Users (2016-2032)
- Table 126: Middle East & Africa Structural Health Monitoring Market Market Comparison by By Component (2016-2032)
- Table 127: Middle East & Africa Structural Health Monitoring Market Market Comparison by By Application (2016-2032)
- Table 128: Middle East & Africa Structural Health Monitoring Market Market Comparison by Vehicle Type (2016-2032)
- Table 129: Middle East & Africa Structural Health Monitoring Market Market Comparison by End Users (2016-2032)
- Table 130: Middle East & Africa Structural Health Monitoring Market Revenue (US$ Mn) Comparison by Country (2016-2032)
- Table 131: Middle East & Africa Structural Health Monitoring Market Market Revenue (US$ Mn) (2016-2032)
- Table 132: Middle East & Africa Structural Health Monitoring Market Market Revenue (US$ Mn) Comparison by Country (2016-2032)
- Table 133: Middle East & Africa Structural Health Monitoring Market Market Revenue (US$ Mn) Comparison by By Component (2016-2032)
- Table 134: Middle East & Africa Structural Health Monitoring Market Market Revenue (US$ Mn) Comparison by By Application (2016-2032)
- Table 135: Middle East & Africa Structural Health Monitoring Market Market Revenue (US$ Mn) Comparison by Vehicle Type (2016-2032)
- Table 136: Middle East & Africa Structural Health Monitoring Market Market Revenue (US$ Mn) Comparison by End Users (2016-2032)
- Table 137: Middle East & Africa Structural Health Monitoring Market Market Y-o-Y Growth Rate Comparison by Country (2016-2032)
- Table 138: Middle East & Africa Structural Health Monitoring Market Market Y-o-Y Growth Rate Comparison by By Component (2016-2032)
- Table 139: Middle East & Africa Structural Health Monitoring Market Market Y-o-Y Growth Rate Comparison by By Application (2016-2032)
- Table 140: Middle East & Africa Structural Health Monitoring Market Market Y-o-Y Growth Rate Comparison by Vehicle Type (2016-2032)
- Table 141: Middle East & Africa Structural Health Monitoring Market Market Y-o-Y Growth Rate Comparison by End Users (2016-2032)
- Table 142: Middle East & Africa Structural Health Monitoring Market Market Share Comparison by Country (2016-2032)
- Table 143: Middle East & Africa Structural Health Monitoring Market Market Share Comparison by By Component (2016-2032)
- Table 144: Middle East & Africa Structural Health Monitoring Market Market Share Comparison by By Application (2016-2032)
- Table 145: Middle East & Africa Structural Health Monitoring Market Market Share Comparison by Vehicle Type (2016-2032)
- Table 146: Middle East & Africa Structural Health Monitoring Market Market Share Comparison by End Users (2016-2032)
- 1. Executive Summary
-
- NVIDIA
- OpenAI
- Waymo (Alphabet Inc.)
- Baidu Apollo
- Aptiv
- Aurora
- Motional
- TuSimple
- Zenuity
- AI Motive
- Applied Intuition
- Ridecell
- Perceptive Automata
- DeepMap
- Idriverplus
- Other key players
Our Clients


View Our Licence Options
