
Generative AI in Architecture Market Deployment(Cloud-based ,On-premises), Application(Architectural Design, Urban Planning, Interior Design), Technology(Machine Learning Algorithms, Software Platforms, Hardware Infrastructure), End-User(Architectural Firms, Real Estate Developers, Government and Municipalities, Construction Companies) By Region And Companies - Industry Segment Outlook, Market Assessment, Competition Scenario, Trends, And Forecast 2023-2032
-
42775
-
Jan 2024
-
174
-


-
This report was compiled by Vishwa Gaul Vishwa is an experienced market research and consulting professional with over 8 years of expertise in the ICT industry, contributing to over 700 reports across telecommunications, software, hardware, and digital solutions. Correspondence Team Lead- ICT Linkedin | Detailed Market research Methodology Our methodology involves a mix of primary research, including interviews with leading mental health experts, and secondary research from reputable medical journals and databases. View Detailed Methodology Page
-
Quick Navigation
- Generative AI in Architecture Market Size, Share, Trends Analysis
- Driving Factors
- Restraining Factors
- Generative AI in Architecture Market Segmentation Analysis
- Generative AI in Architecture Industry Segments
- Growth Opportunities
- Generative AI in Architecture Market Regional Analysis
- Generative AI in Architecture Market Industry By Region
- Generative AI in Architecture Market Key Player Analysis
- Generative AI in Architecture Industry Key Players
- Generative AI in Architecture Market Recent Development
- Report Scope
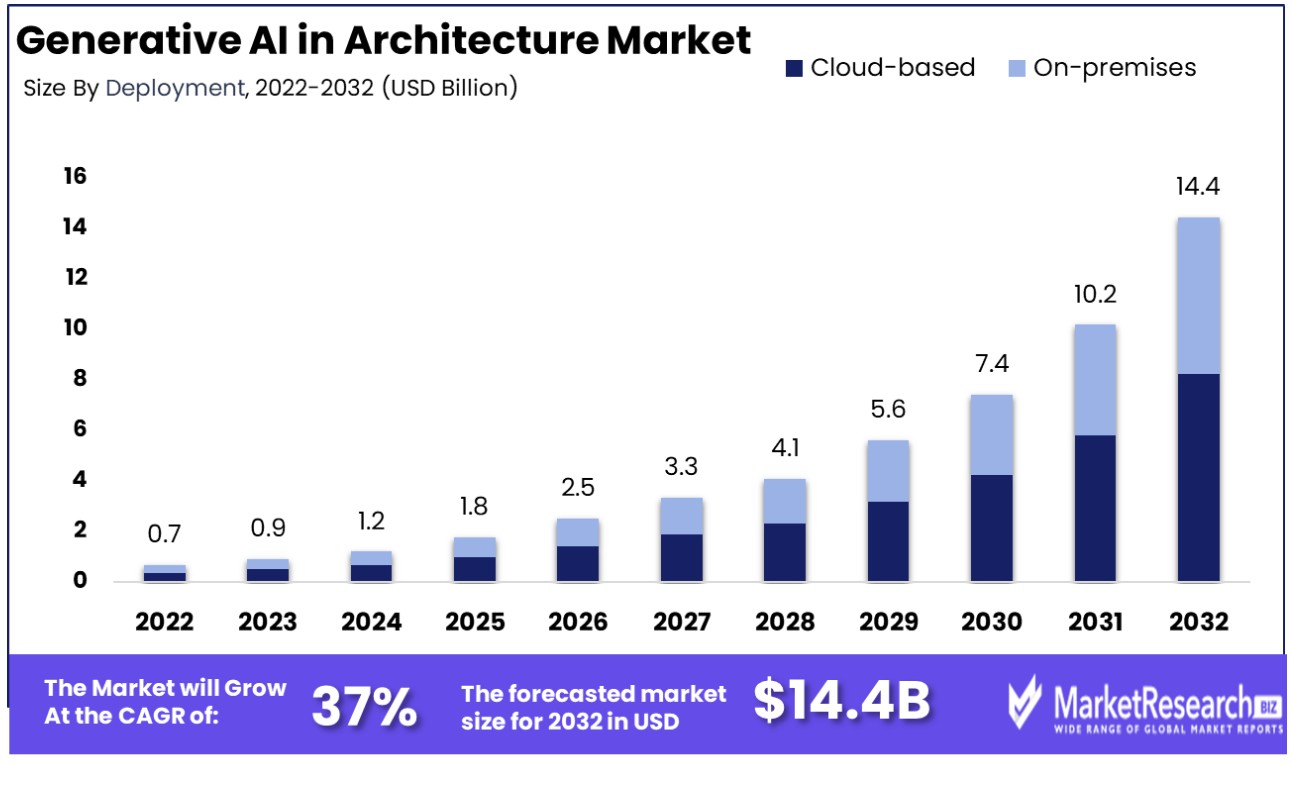
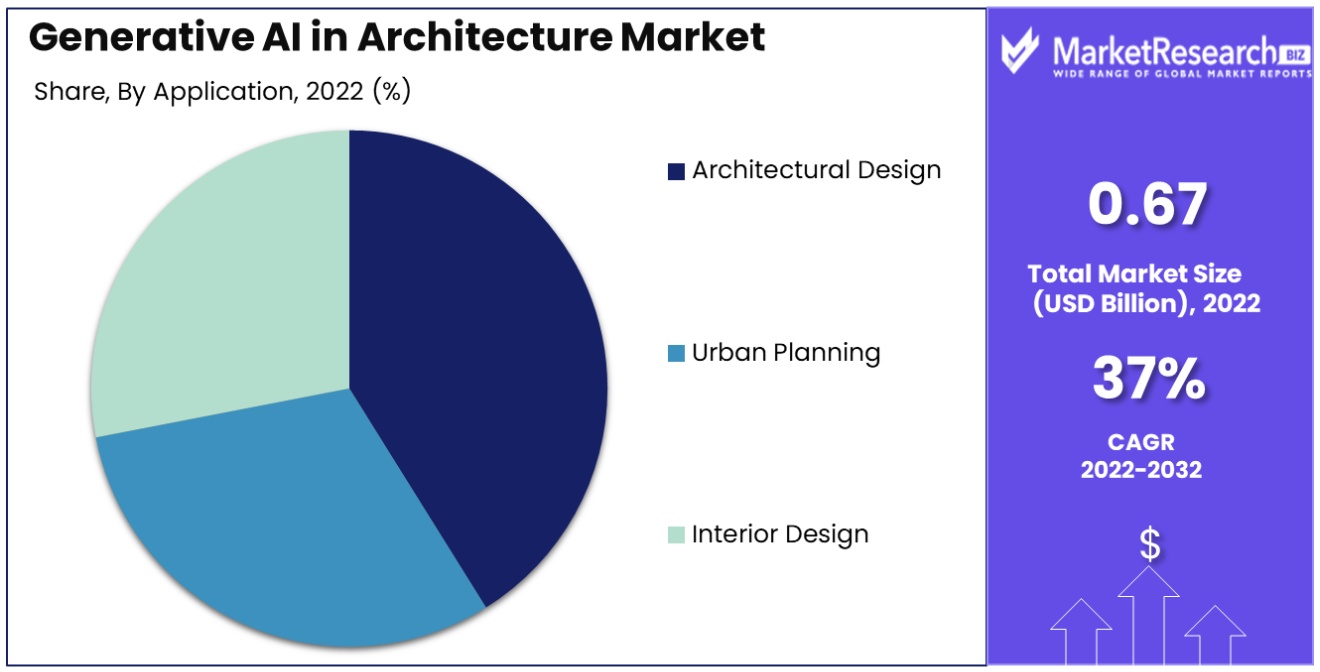
The Generative AI in Architecture Market was valued at USD 0.67 Billion in 2023. It is expected to reach USD 15.7 Billion by 2033, with a CAGR of 37% during the forecast period from 2024 to 2033.
The surge in demand for infrastructure development projects and the changing lifestyles are some of the main driving factors for generative AI in the architecture market. Generative AI has been making its pivotal market presence in different sectors, and the architectural industry is one of them.
Generative AI is a type of machine learning technology that changes new innovative ideas based on the collection of input parameters and restrictions. In the field of architectural design, this means that Generative AI can be utilized to discover more design alternatives quickly, which permits architects to think more innovatively, considering many more chances than they would be able to with the old methodology without having any time restrictions or resources.
Several architects are adopting GenAI as a tool to boost their creativity and productivity. Generative AI helps architects discover a wider range of design options, enhance performance and efficacy, and build new and adaptive solutions. According to PixelCaryons in October 2023, the implementation of AI-powered tools in architectural companies has been an upsurge, with 64% of firms adopting AI-driven solutions into their workflow productivity.
There are some of the most popular GenAI technologies in architecture, such as Dall-E2, which helps architects visualize high-end design options. This AI model is powered by OpenAI, which produces amazing and innovative visualizations based on text descriptions. Not only this, but Dall-E has gathered almost 1.5 million users. In 2023, Dall-E is anticipated to collect and process as much as 4 petabytes of data. Additionally, in March 2023, approx. 70,000 firms will have implemented Dall-E for their multiple requirements, as per the article produced by MarketSplash in November 2023.
The architecture sector is very rich in having lots of datasets, which would provide information to offer as the building block of GenAI. Using GenAI in architecture helps to gather and examine information on a large scale, which can help to decrease expenses, boost sustainability, enable mass customization, and enable large-scale 3D printing. It has proven to be an effective modern technology that can help in consuming time and also offers enormous chances for easy personalization.
There are several advantages to implementing GenAI in architecture, such as that it boosts efficiency, offers better customer experiences, and continues to encourage new innovative ideas in the field of architectural design. The demand for the generative artificial intelligence market will increase due to its requirement for architectural designs, which will help in market expansion in the coming years.
Driving Factors
Enhanced Computing Power Catalyzes Architectural Innovation
The surge in computing capabilities, particularly through advanced GPUs and neural networks, is revolutionizing generative AI in architecture. Companies like Arup leverage computational design to enhance project outcomes, exemplified by their successful application in the Turkey hospital project featuring advanced base isolators. This increased power allows architects to create more complex, precise, and innovative designs. As computational power continues to grow, so will the potential for intricate and optimized structures, pushing the boundaries of architectural design and efficiency. This trend is likely to attract more investment and research into generative AI, cementing its role as an indispensable tool in modern architecture.
Realistic Visualization Shapes Decision-Making
The ability of AI to produce photorealistic 3D renderings revolutionizes client presentations and decision-making processes in architecture. Tools like Open AI's ChatGPT and DALL-E provide professionals with previously unattainable visualization capabilities. This technological advancement enables architects to quickly iterate and refine designs, presenting clients with a vivid representation of the final product. As firms and architects explore AI's potential to generate real-time design visuals during client conversations, the market sees a shift towards more interactive and responsive design processes. This trend not only enhances client satisfaction but also encourages innovation and efficiency, likely resulting in a more dynamic, client-centric market.
Customization Meets Modern Expectations
Generative AI's ability to tailor design elements to individual client needs addresses the modern market's demand for personalization. For Instance, Perkins & Will's initiative to develop real-time, AI-generated images during client discussions exemplifies this trend. Such technology allows architects to offer unique, bespoke designs more efficiently, enhancing client engagement and satisfaction. As customization becomes increasingly feasible and expected, generative AI positions itself as a key differentiator in the competitive architecture landscape. Firms that harness this capability effectively will likely see growth in client base and market share, driving the overall expansion of Generative AI in the Architecture Market.
Restraining Factors
Liability Concerns Impede Generative AI Adoption in Architecture
The ambiguity over who holds responsibility if an AI-generated design fails poses a major legal and ethical dilemma. As AI takes a more active role in the design process, the lines of accountability between human architects, firms, and AI developers blur. Without clear regulations and liability frameworks, professionals may be hesitant to fully integrate or rely on AI-generated designs, fearing repercussions for malfunctions or failures. This concern stifles innovation and adoption, as the industry awaits clearer guidelines and legal structures.
Expense of Large Models Restrains Generative AI Market Expansion
The cost of developing and running larger generative models can be prohibitive, particularly for smaller architecture firms or individual practitioners. While these advanced models offer powerful capabilities for design generation and simulation, the financial investment in the necessary computing power, data storage, and technical expertise is substantial. Although progress in making these models more efficient is ongoing, the current expense remains a significant barrier. This cost issue restricts the accessibility and scalability of generative AI in architecture, limiting its market growth to those who can afford the hefty investment.
Generative AI in Architecture Market Segmentation Analysis
By Deployment
The Cloud-based deployment model is the dominating segment in the Generative AI in Architecture Market, holding a significant 65% share. This prominence is attributed to the cloud's scalability, flexibility, and cost-effectiveness, which are especially beneficial for computational and data-intensive tasks associated with generative AI. Cloud platforms enable architects and designers to access powerful AI tools and large data sets without the need for substantial upfront investment in hardware. This democratizes access to advanced AI capabilities, allowing even smaller firms to leverage these technologies.
The cloud-based model also facilitates easier collaboration and data sharing, which is crucial in the iterative and collaborative nature of architectural design. While the cloud-based model leads, On-premises deployment still holds relevance, particularly for organizations with specific security requirements or those who prefer to have direct control over their AI infrastructure and data.
By Application
In terms of application, Architectural Design emerges as the dominating segment with a 40% market share in Generative AI. This dominance stems from AI’s ability to significantly enhance the creativity, efficiency, and accuracy of architectural design processes. AI algorithms can analyze vast arrays of design possibilities, optimize for various parameters, and even generate novel design concepts. This revolutionizes the traditional design process, enabling architects to explore more innovative and sustainable solutions.
Urban Planning and Interior Design are also significant applications of Generative AI. Urban Planning benefits from AI's ability to simulate and analyze complex urban environments, while Interior Design uses AI for creating personalized and optimized living spaces. However, the impact of AI in transforming architectural design, particularly in conceptualization and visualization, underlines its dominant role in this segment.
By Technology
Machine Learning Algorithms hold a 50% dominating share in the technology segment of Generative AI in Architecture. An example of this is Togal.AI, launched by Coastal Construction, which utilizes machine learning for efficient area calculation in bidding processes, saving significant time and costs. These algorithms are at the forefront of generative AI, offering unparalleled capabilities in data analysis, pattern recognition, and predictive modeling. This technology enhances decision-making and design optimization, proving invaluable in handling complex architectural challenges.
Software Platforms and Hardware Infrastructure also play critical roles. Software platforms provide user-friendly interfaces and integration with other architectural tools, while hardware infrastructure is essential for supporting the computational demands of AI algorithms. Nonetheless, the transformative impact of machine learning algorithms, as evidenced by their widespread adoption and significant contributions to efficiency and innovation, underscores their dominance in this market.
By End-User
Architectural Firms are the dominant end-user segment in the Generative AI in Architecture Market, with a 45% market share. This dominance is driven by the increasing adoption of AI tools among architectural firms seeking to enhance design creativity, operational efficiency, and competitive edge. AI enables these firms to rapidly generate design options, conduct simulations, and optimize for various parameters, thus significantly enhancing the design process.
Real Estate Developers, Government and Municipalities, and Construction Companies also utilize generative AI. Real Estate Developers use AI for optimizing building designs and maximizing investment value, while Governments and Municipalities apply AI in urban planning and public infrastructure projects. Construction companies leverage AI for planning and efficiency in construction processes. Architecture plays an essential role in driving innovation, and their use of artificial intelligence (AI) for planning and design speaks to their dominance in this segment.
Generative AI in Architecture Industry Segments
By Deployment
- Cloud-based
- On-premises
By Application
- Architectural Design
- Urban Planning
- Interior Design
By Technology
- Machine Learning Algorithms
- Software Platforms
- Hardware Infrastructure
By End-User
- Architectural Firms
- Real Estate Developers
- Government and Municipalities
- Construction Companies
Growth Opportunities
Sustainability Optimization through Generative AI Enhances Architectural Design
Generative AI's ability to optimize for energy efficiency and material use presents significant growth opportunities in the architecture market, particularly appealing to environmentally-conscious clients. By automating calculations for a building's energy performance rating, tools influenced by programs like LEED can streamline the certification process. This not only saves time compared to manual calculations but also ensures more accurate, sustainable designs. As sustainability becomes increasingly important, firms using AI to meet these goals, like those involved in the LEED program, position themselves favorably in a market that values eco-friendly innovation.
Rapid Prototyping with AI Transforms Architectural Design Process
AI's facilitation of quick design iteration early in the project lifecycle marks a substantial growth opportunity in the architecture market. Reducing costly late-stage changes, tools like Rhino and Grasshopper allow designers to input goals and rapidly explore various design iterations. This accelerates the design process and enhances creativity. Additionally, platforms like Modsy or Havenly, which provide personalized design recommendations, democratize design for homeowners, broadening the market. This trend of rapid prototyping and consumer-focused design tools reflects a growing market segment emphasizing speed, efficiency, and user engagement.
Generative AI in Architecture Market Regional Analysis
North America Dominates with 38% Market Share in Generative AI in Architecture Market
North America's substantial 38% share of the Generative AI in the Architecture market is primarily driven by the region's strong technological infrastructure and a culture of innovation. The United States and Canada are home to some of the world's leading technology firms and architectural practices, which readily adopt new technologies to enhance design and construction processes. The region's emphasis on optimizing building efficiency, sustainability, and aesthetic appeal through advanced tools like AI significantly contributes to market dominance. Investment in research and development also facilitates AI-based generative AI applications in architecture.
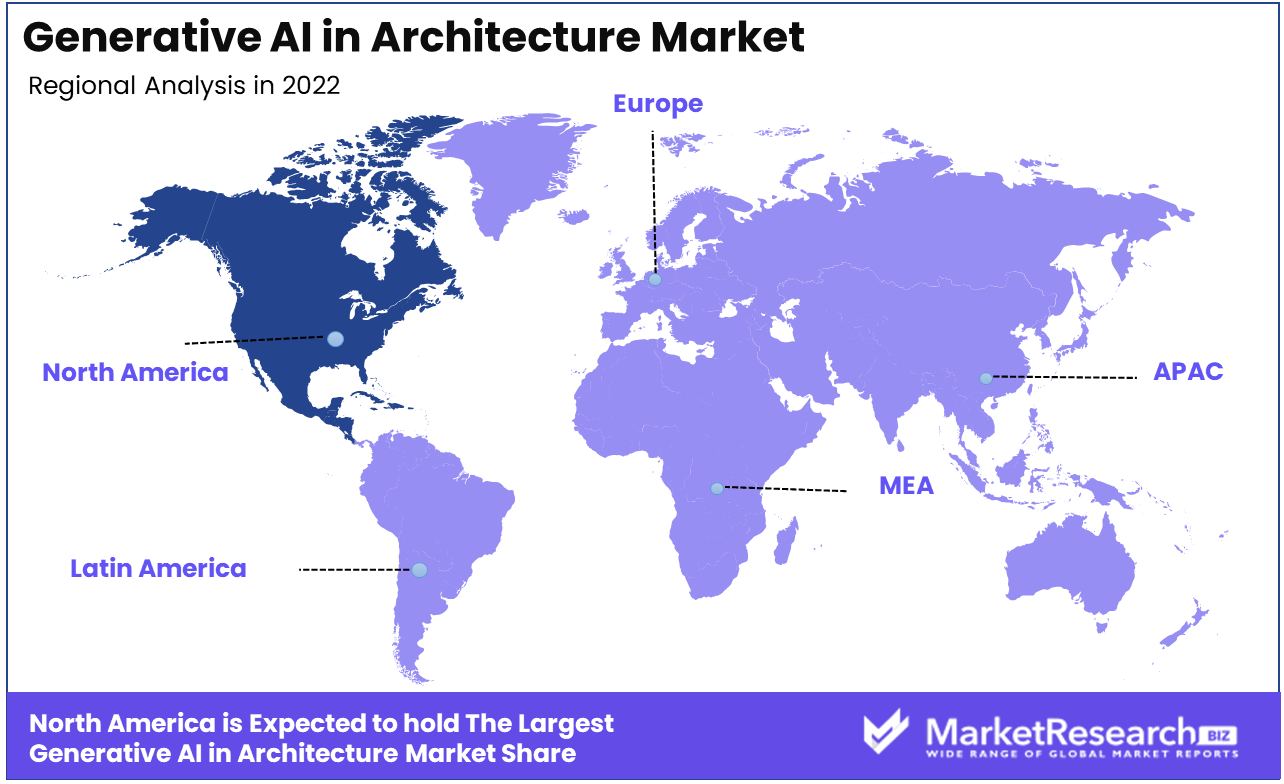
The market dynamics in North America are influenced by the rapid adoption of smart building technologies and a growing emphasis on sustainable urban development. Architects and firms in the region leverage generative AI for complex data analysis, design optimization, and simulation tasks, leading to more innovative and efficient design solutions. The increasing demand for customized and adaptive living spaces also drives the adoption of generative AI. Moreover, the region's stringent building regulations and the push for green construction encourage the use of AI to design more energy-efficient and environmentally friendly buildings.
Europe: Strong Emphasis on Innovation and Sustainability
Europe's Generative AI in Architecture market is driven by a strong emphasis on innovation and sustainability. The region's advanced education systems and collaborative research initiatives foster a culture of innovation in architecture. The European Union's focus on sustainable development and energy-efficient buildings promotes the adoption of advanced technologies, including generative AI, to meet these goals.
Asia-Pacific: Rapid Urbanization and Technological Adoption
In Asia-Pacific, the Generative AI in Architecture market is experiencing rapid growth due to the region's swift urbanization and increasing technological adoption. Countries like China, Japan, and South Korea are investing heavily in building smart and sustainable cities, driving the need for advanced architectural solutions. As the economy rapidly expands and emphasis is placed on building high-tech buildings, AI technology offers incredible potential to revolutionize architecture. Generative AI provides tremendous advantages that are being leveraged across disciplines. In the future, as Asia-Pacific continues investing in infrastructure technologies, Asia-Pacific is expected to see significant growth in the industry.
Generative AI in Architecture Market Industry By Region
North America
- The US
- Canada
- Rest of North America
Europe
- Germany
- France
- The UK
- Spain
- Italy
- Russia
- Netherlands
- Rest of Europe
Asia-Pacific
- China
- Japan
- South Korea
- India
- New Zealand
- Singapore
- Thailand
- Vietnam
- Rest of Asia Pacific
Latin America
- Brazil
- Mexico
- Rest of Latin America
Middle East & Africa
- South Africa
- Saudi Arabia
- UAE
- Rest of the Middle East & Africa
Generative AI in Architecture Market Key Player Analysis
Generative AI in the Architecture Market, a field that is revolutionizing designs and their outcomes These companies are the key to creating efficiency and innovation. Autodesk Inc. and Dassault Systèmes are industry leaders, integrating generative AI into their advanced design and modeling software. Their strategic positioning emphasizes creativity, optimization, and sustainability in architectural projects, significantly influencing how professionals approach design challenges.
Open AI, with its cutting-edge research and AI models, provides foundational technologies that power generative design tools, reflecting the industry's shift towards more intelligent and automated design solutions. Trimble Inc. and Siemens AG contribute with their robust software solutions that incorporate AI for enhanced planning and construction management, showcasing the market's potential for comprehensive and integrated project workflows.
IBM Corporation and NVIDIA Corporation, known for their technological prowess, play crucial roles in advancing AI capabilities in architecture, from data analysis to visualization, demonstrating the industry's move towards more data-driven and realistic design simulations. Unity Technologies, with its real-time 3D development platform, underscores the market's commitment to immersive and interactive design environments.
Generative AI in Architecture Industry Key Players
- Open AI
- Autodesk Inc.
- Dassault Systèmes
- Trimble Inc.
- IBM Corporation
- Siemens AG
- NVIDIA Corporation
- Unity Technologies
- Other Key Players
Generative AI in Architecture Market Recent Development
- In 2019, Coastal Construction, one of Florida’s largest general contractors, helped launch Togal.AI—which uses machine learning to calculate square footage of areas for bidding and takeoffs. In its first year of using this tool, Coastal cut 14,000 hours of work and saved nearly $1 million,
Report Scope
Report Features Description Market Value (2023) USD 0.67 Billion Forecast Revenue (2033) USD 15.7 Billion CAGR (2024-2032) 37% Base Year for Estimation 2023 Historic Period 2016-2023 Forecast Period 2024-2033 Report Coverage Revenue Forecast, Market Dynamics, COVID-19 Impact, Competitive Landscape, Recent Developments Segments Covered Deployment(Cloud-based ,On-premises), Application(Architectural Design, Urban Planning, Interior Design), Technology(Machine Learning Algorithms, Software Platforms, Hardware Infrastructure), End-User(Architectural Firms, Real Estate Developers, Government and Municipalities, Construction Companies) Regional Analysis North America - The US, Canada, Rest of North America, Europe - Germany, France, The UK, Spain, Italy, Russia, Netherlands, Rest of Europe, Asia-Pacific - China, Japan, South Korea, India, New Zealand, Singapore, Thailand, Vietnam, Rest of Asia Pacific, Latin America - Brazil, Mexico, Rest of Latin America, Middle East & Africa - South Africa, Saudi Arabia, UAE, Rest of Middle East & Africa Competitive Landscape Open AI, Autodesk Inc., Dassault Systèmes, Trimble Inc., IBM Corporation, Siemens AG, NVIDIA Corporation, Unity Technologies, Other Key Players Customization Scope Customization for segments, region/country-level will be provided. Moreover, additional customization can be done based on the requirements. Purchase Options We have three licenses to opt for Single User License, Multi-User License (Up to 5 Users), Corporate Use License (Unlimited User and Printable PDF) -
- 1. Executive Summary
- 1.1. Definition
- 1.2. Taxonomy
- 1.3. Research Scope
- 1.4. Key Analysis
- 1.5. Key Findings by Major Segments
- 1.6. Top strategies by Major Players
- 2. Global Structural Health Monitoring Market Overview
- 2.1. Structural Health Monitoring Market Dynamics
- 2.1.1. Drivers
- 2.1.2. Opportunities
- 2.1.3. Restraints
- 2.1.4. Challenges
- 2.2. Macro-economic Factors
- 2.3. Regulatory Framework
- 2.4. Market Investment Feasibility Index
- 2.5. PEST Analysis
- 2.6. PORTER’S Five Force Analysis
- 2.7. Drivers & Restraints Impact Analysis
- 2.8. Industry Chain Analysis
- 2.9. Cost Structure Analysis
- 2.10. Marketing Strategy
- 2.11. Russia-Ukraine War Impact Analysis
- 2.12. Opportunity Map Analysis
- 2.13. Market Competition Scenario Analysis
- 2.14. Product Life Cycle Analysis
- 2.15. Opportunity Orbits
- 2.16. Manufacturer Intensity Map
- 2.17. Major Companies sales by Value & Volume
- 2.1. Structural Health Monitoring Market Dynamics
- 3. Global Structural Health Monitoring Market Analysis, Opportunity and Forecast, 2016-2032
- 3.1. Global Structural Health Monitoring Market Analysis, 2016-2021
- 3.2. Global Structural Health Monitoring Market Opportunity and Forecast, 2023-2032
- 3.3. Global Structural Health Monitoring Market Analysis, Opportunity and Forecast, By Deployment, 2016-2032
- 3.3.1. Global Structural Health Monitoring Market Analysis by Deployment: Introduction
- 3.3.2. Market Size Absolute $ Opportunity Analysis and Forecast, By Deployment, 2016-2032
- 3.3.3. Cloud-based
- 3.3.4. On-premises
- 3.4. Global Structural Health Monitoring Market Analysis, Opportunity and Forecast, By Application, 2016-2032
- 3.4.1. Global Structural Health Monitoring Market Analysis by Application: Introduction
- 3.4.2. Market Size Absolute $ Opportunity Analysis and Forecast, By Application, 2016-2032
- 3.4.3. Architectural Design
- 3.4.4. Urban Planning
- 3.4.5. Interior Design
- 3.5. Global Structural Health Monitoring Market Analysis, Opportunity and Forecast, By Technology, 2016-2032
- 3.5.1. Global Structural Health Monitoring Market Analysis by Technology: Introduction
- 3.5.2. Market Size Absolute $ Opportunity Analysis and Forecast, By Technology, 2016-2032
- 3.5.3. Machine Learning Algorithms
- 3.5.4. Software Platforms
- 3.5.5. Hardware Infrastructure
- 3.6. Global Structural Health Monitoring Market Analysis, Opportunity and Forecast, By End-User, 2016-2032
- 3.6.1. Global Structural Health Monitoring Market Analysis by End-User: Introduction
- 3.6.2. Market Size Absolute $ Opportunity Analysis and Forecast, By End-User, 2016-2032
- 3.6.3. Architectural Firms
- 3.6.4. Real Estate Developers
- 3.6.5. Government and Municipalities
- 3.6.6. Construction Companies
- 4. North America Structural Health Monitoring Market Analysis, Opportunity and Forecast, 2016-2032
- 4.1. North America Structural Health Monitoring Market Analysis, 2016-2021
- 4.2. North America Structural Health Monitoring Market Opportunity and Forecast, 2023-2032
- 4.3. North America Structural Health Monitoring Market Analysis, Opportunity and Forecast, By Deployment, 2016-2032
- 4.3.1. North America Structural Health Monitoring Market Analysis by Deployment: Introduction
- 4.3.2. Market Size Absolute $ Opportunity Analysis and Forecast, By Deployment, 2016-2032
- 4.3.3. Cloud-based
- 4.3.4. On-premises
- 4.4. North America Structural Health Monitoring Market Analysis, Opportunity and Forecast, By Application, 2016-2032
- 4.4.1. North America Structural Health Monitoring Market Analysis by Application: Introduction
- 4.4.2. Market Size Absolute $ Opportunity Analysis and Forecast, By Application, 2016-2032
- 4.4.3. Architectural Design
- 4.4.4. Urban Planning
- 4.4.5. Interior Design
- 4.5. North America Structural Health Monitoring Market Analysis, Opportunity and Forecast, By Technology, 2016-2032
- 4.5.1. North America Structural Health Monitoring Market Analysis by Technology: Introduction
- 4.5.2. Market Size Absolute $ Opportunity Analysis and Forecast, By Technology, 2016-2032
- 4.5.3. Machine Learning Algorithms
- 4.5.4. Software Platforms
- 4.5.5. Hardware Infrastructure
- 4.6. North America Structural Health Monitoring Market Analysis, Opportunity and Forecast, By End-User, 2016-2032
- 4.6.1. North America Structural Health Monitoring Market Analysis by End-User: Introduction
- 4.6.2. Market Size Absolute $ Opportunity Analysis and Forecast, By End-User, 2016-2032
- 4.6.3. Architectural Firms
- 4.6.4. Real Estate Developers
- 4.6.5. Government and Municipalities
- 4.6.6. Construction Companies
- 4.7. North America Structural Health Monitoring Market Analysis, Opportunity and Forecast, By Country , 2016-2032
- 4.7.1. North America Structural Health Monitoring Market Analysis by Country : Introduction
- 4.7.2. Market Size Absolute $ Opportunity Analysis and Forecast, Country , 2016-2032
- 4.7.2.1. The US
- 4.7.2.2. Canada
- 4.7.2.3. Mexico
- 5. Western Europe Structural Health Monitoring Market Analysis, Opportunity and Forecast, 2016-2032
- 5.1. Western Europe Structural Health Monitoring Market Analysis, 2016-2021
- 5.2. Western Europe Structural Health Monitoring Market Opportunity and Forecast, 2023-2032
- 5.3. Western Europe Structural Health Monitoring Market Analysis, Opportunity and Forecast, By Deployment, 2016-2032
- 5.3.1. Western Europe Structural Health Monitoring Market Analysis by Deployment: Introduction
- 5.3.2. Market Size Absolute $ Opportunity Analysis and Forecast, By Deployment, 2016-2032
- 5.3.3. Cloud-based
- 5.3.4. On-premises
- 5.4. Western Europe Structural Health Monitoring Market Analysis, Opportunity and Forecast, By Application, 2016-2032
- 5.4.1. Western Europe Structural Health Monitoring Market Analysis by Application: Introduction
- 5.4.2. Market Size Absolute $ Opportunity Analysis and Forecast, By Application, 2016-2032
- 5.4.3. Architectural Design
- 5.4.4. Urban Planning
- 5.4.5. Interior Design
- 5.5. Western Europe Structural Health Monitoring Market Analysis, Opportunity and Forecast, By Technology, 2016-2032
- 5.5.1. Western Europe Structural Health Monitoring Market Analysis by Technology: Introduction
- 5.5.2. Market Size Absolute $ Opportunity Analysis and Forecast, By Technology, 2016-2032
- 5.5.3. Machine Learning Algorithms
- 5.5.4. Software Platforms
- 5.5.5. Hardware Infrastructure
- 5.6. Western Europe Structural Health Monitoring Market Analysis, Opportunity and Forecast, By End-User, 2016-2032
- 5.6.1. Western Europe Structural Health Monitoring Market Analysis by End-User: Introduction
- 5.6.2. Market Size Absolute $ Opportunity Analysis and Forecast, By End-User, 2016-2032
- 5.6.3. Architectural Firms
- 5.6.4. Real Estate Developers
- 5.6.5. Government and Municipalities
- 5.6.6. Construction Companies
- 5.7. Western Europe Structural Health Monitoring Market Analysis, Opportunity and Forecast, By Country , 2016-2032
- 5.7.1. Western Europe Structural Health Monitoring Market Analysis by Country : Introduction
- 5.7.2. Market Size Absolute $ Opportunity Analysis and Forecast, Country , 2016-2032
- 5.7.2.1. Germany
- 5.7.2.2. France
- 5.7.2.3. The UK
- 5.7.2.4. Spain
- 5.7.2.5. Italy
- 5.7.2.6. Portugal
- 5.7.2.7. Ireland
- 5.7.2.8. Austria
- 5.7.2.9. Switzerland
- 5.7.2.10. Benelux
- 5.7.2.11. Nordic
- 5.7.2.12. Rest of Western Europe
- 6. Eastern Europe Structural Health Monitoring Market Analysis, Opportunity and Forecast, 2016-2032
- 6.1. Eastern Europe Structural Health Monitoring Market Analysis, 2016-2021
- 6.2. Eastern Europe Structural Health Monitoring Market Opportunity and Forecast, 2023-2032
- 6.3. Eastern Europe Structural Health Monitoring Market Analysis, Opportunity and Forecast, By Deployment, 2016-2032
- 6.3.1. Eastern Europe Structural Health Monitoring Market Analysis by Deployment: Introduction
- 6.3.2. Market Size Absolute $ Opportunity Analysis and Forecast, By Deployment, 2016-2032
- 6.3.3. Cloud-based
- 6.3.4. On-premises
- 6.4. Eastern Europe Structural Health Monitoring Market Analysis, Opportunity and Forecast, By Application, 2016-2032
- 6.4.1. Eastern Europe Structural Health Monitoring Market Analysis by Application: Introduction
- 6.4.2. Market Size Absolute $ Opportunity Analysis and Forecast, By Application, 2016-2032
- 6.4.3. Architectural Design
- 6.4.4. Urban Planning
- 6.4.5. Interior Design
- 6.5. Eastern Europe Structural Health Monitoring Market Analysis, Opportunity and Forecast, By Technology, 2016-2032
- 6.5.1. Eastern Europe Structural Health Monitoring Market Analysis by Technology: Introduction
- 6.5.2. Market Size Absolute $ Opportunity Analysis and Forecast, By Technology, 2016-2032
- 6.5.3. Machine Learning Algorithms
- 6.5.4. Software Platforms
- 6.5.5. Hardware Infrastructure
- 6.6. Eastern Europe Structural Health Monitoring Market Analysis, Opportunity and Forecast, By End-User, 2016-2032
- 6.6.1. Eastern Europe Structural Health Monitoring Market Analysis by End-User: Introduction
- 6.6.2. Market Size Absolute $ Opportunity Analysis and Forecast, By End-User, 2016-2032
- 6.6.3. Architectural Firms
- 6.6.4. Real Estate Developers
- 6.6.5. Government and Municipalities
- 6.6.6. Construction Companies
- 6.7. Eastern Europe Structural Health Monitoring Market Analysis, Opportunity and Forecast, By Country , 2016-2032
- 6.7.1. Eastern Europe Structural Health Monitoring Market Analysis by Country : Introduction
- 6.7.2. Market Size Absolute $ Opportunity Analysis and Forecast, Country , 2016-2032
- 6.7.2.1. Russia
- 6.7.2.2. Poland
- 6.7.2.3. The Czech Republic
- 6.7.2.4. Greece
- 6.7.2.5. Rest of Eastern Europe
- 7. APAC Structural Health Monitoring Market Analysis, Opportunity and Forecast, 2016-2032
- 7.1. APAC Structural Health Monitoring Market Analysis, 2016-2021
- 7.2. APAC Structural Health Monitoring Market Opportunity and Forecast, 2023-2032
- 7.3. APAC Structural Health Monitoring Market Analysis, Opportunity and Forecast, By Deployment, 2016-2032
- 7.3.1. APAC Structural Health Monitoring Market Analysis by Deployment: Introduction
- 7.3.2. Market Size Absolute $ Opportunity Analysis and Forecast, By Deployment, 2016-2032
- 7.3.3. Cloud-based
- 7.3.4. On-premises
- 7.4. APAC Structural Health Monitoring Market Analysis, Opportunity and Forecast, By Application, 2016-2032
- 7.4.1. APAC Structural Health Monitoring Market Analysis by Application: Introduction
- 7.4.2. Market Size Absolute $ Opportunity Analysis and Forecast, By Application, 2016-2032
- 7.4.3. Architectural Design
- 7.4.4. Urban Planning
- 7.4.5. Interior Design
- 7.5. APAC Structural Health Monitoring Market Analysis, Opportunity and Forecast, By Technology, 2016-2032
- 7.5.1. APAC Structural Health Monitoring Market Analysis by Technology: Introduction
- 7.5.2. Market Size Absolute $ Opportunity Analysis and Forecast, By Technology, 2016-2032
- 7.5.3. Machine Learning Algorithms
- 7.5.4. Software Platforms
- 7.5.5. Hardware Infrastructure
- 7.6. APAC Structural Health Monitoring Market Analysis, Opportunity and Forecast, By End-User, 2016-2032
- 7.6.1. APAC Structural Health Monitoring Market Analysis by End-User: Introduction
- 7.6.2. Market Size Absolute $ Opportunity Analysis and Forecast, By End-User, 2016-2032
- 7.6.3. Architectural Firms
- 7.6.4. Real Estate Developers
- 7.6.5. Government and Municipalities
- 7.6.6. Construction Companies
- 7.7. APAC Structural Health Monitoring Market Analysis, Opportunity and Forecast, By Country , 2016-2032
- 7.7.1. APAC Structural Health Monitoring Market Analysis by Country : Introduction
- 7.7.2. Market Size Absolute $ Opportunity Analysis and Forecast, Country , 2016-2032
- 7.7.2.1. China
- 7.7.2.2. Japan
- 7.7.2.3. South Korea
- 7.7.2.4. India
- 7.7.2.5. Australia & New Zeland
- 7.7.2.6. Indonesia
- 7.7.2.7. Malaysia
- 7.7.2.8. Philippines
- 7.7.2.9. Singapore
- 7.7.2.10. Thailand
- 7.7.2.11. Vietnam
- 7.7.2.12. Rest of APAC
- 8. Latin America Structural Health Monitoring Market Analysis, Opportunity and Forecast, 2016-2032
- 8.1. Latin America Structural Health Monitoring Market Analysis, 2016-2021
- 8.2. Latin America Structural Health Monitoring Market Opportunity and Forecast, 2023-2032
- 8.3. Latin America Structural Health Monitoring Market Analysis, Opportunity and Forecast, By Deployment, 2016-2032
- 8.3.1. Latin America Structural Health Monitoring Market Analysis by Deployment: Introduction
- 8.3.2. Market Size Absolute $ Opportunity Analysis and Forecast, By Deployment, 2016-2032
- 8.3.3. Cloud-based
- 8.3.4. On-premises
- 8.4. Latin America Structural Health Monitoring Market Analysis, Opportunity and Forecast, By Application, 2016-2032
- 8.4.1. Latin America Structural Health Monitoring Market Analysis by Application: Introduction
- 8.4.2. Market Size Absolute $ Opportunity Analysis and Forecast, By Application, 2016-2032
- 8.4.3. Architectural Design
- 8.4.4. Urban Planning
- 8.4.5. Interior Design
- 8.5. Latin America Structural Health Monitoring Market Analysis, Opportunity and Forecast, By Technology, 2016-2032
- 8.5.1. Latin America Structural Health Monitoring Market Analysis by Technology: Introduction
- 8.5.2. Market Size Absolute $ Opportunity Analysis and Forecast, By Technology, 2016-2032
- 8.5.3. Machine Learning Algorithms
- 8.5.4. Software Platforms
- 8.5.5. Hardware Infrastructure
- 8.6. Latin America Structural Health Monitoring Market Analysis, Opportunity and Forecast, By End-User, 2016-2032
- 8.6.1. Latin America Structural Health Monitoring Market Analysis by End-User: Introduction
- 8.6.2. Market Size Absolute $ Opportunity Analysis and Forecast, By End-User, 2016-2032
- 8.6.3. Architectural Firms
- 8.6.4. Real Estate Developers
- 8.6.5. Government and Municipalities
- 8.6.6. Construction Companies
- 8.7. Latin America Structural Health Monitoring Market Analysis, Opportunity and Forecast, By Country , 2016-2032
- 8.7.1. Latin America Structural Health Monitoring Market Analysis by Country : Introduction
- 8.7.2. Market Size Absolute $ Opportunity Analysis and Forecast, Country , 2016-2032
- 8.7.2.1. Brazil
- 8.7.2.2. Colombia
- 8.7.2.3. Chile
- 8.7.2.4. Argentina
- 8.7.2.5. Costa Rica
- 8.7.2.6. Rest of Latin America
- 9. Middle East & Africa Structural Health Monitoring Market Analysis, Opportunity and Forecast, 2016-2032
- 9.1. Middle East & Africa Structural Health Monitoring Market Analysis, 2016-2021
- 9.2. Middle East & Africa Structural Health Monitoring Market Opportunity and Forecast, 2023-2032
- 9.3. Middle East & Africa Structural Health Monitoring Market Analysis, Opportunity and Forecast, By Deployment, 2016-2032
- 9.3.1. Middle East & Africa Structural Health Monitoring Market Analysis by Deployment: Introduction
- 9.3.2. Market Size Absolute $ Opportunity Analysis and Forecast, By Deployment, 2016-2032
- 9.3.3. Cloud-based
- 9.3.4. On-premises
- 9.4. Middle East & Africa Structural Health Monitoring Market Analysis, Opportunity and Forecast, By Application, 2016-2032
- 9.4.1. Middle East & Africa Structural Health Monitoring Market Analysis by Application: Introduction
- 9.4.2. Market Size Absolute $ Opportunity Analysis and Forecast, By Application, 2016-2032
- 9.4.3. Architectural Design
- 9.4.4. Urban Planning
- 9.4.5. Interior Design
- 9.5. Middle East & Africa Structural Health Monitoring Market Analysis, Opportunity and Forecast, By Technology, 2016-2032
- 9.5.1. Middle East & Africa Structural Health Monitoring Market Analysis by Technology: Introduction
- 9.5.2. Market Size Absolute $ Opportunity Analysis and Forecast, By Technology, 2016-2032
- 9.5.3. Machine Learning Algorithms
- 9.5.4. Software Platforms
- 9.5.5. Hardware Infrastructure
- 9.6. Middle East & Africa Structural Health Monitoring Market Analysis, Opportunity and Forecast, By End-User, 2016-2032
- 9.6.1. Middle East & Africa Structural Health Monitoring Market Analysis by End-User: Introduction
- 9.6.2. Market Size Absolute $ Opportunity Analysis and Forecast, By End-User, 2016-2032
- 9.6.3. Architectural Firms
- 9.6.4. Real Estate Developers
- 9.6.5. Government and Municipalities
- 9.6.6. Construction Companies
- 9.7. Middle East & Africa Structural Health Monitoring Market Analysis, Opportunity and Forecast, By Country , 2016-2032
- 9.7.1. Middle East & Africa Structural Health Monitoring Market Analysis by Country : Introduction
- 9.7.2. Market Size Absolute $ Opportunity Analysis and Forecast, Country , 2016-2032
- 9.7.2.1. Algeria
- 9.7.2.2. Egypt
- 9.7.2.3. Israel
- 9.7.2.4. Kuwait
- 9.7.2.5. Nigeria
- 9.7.2.6. Saudi Arabia
- 9.7.2.7. South Africa
- 9.7.2.8. Turkey
- 9.7.2.9. The UAE
- 9.7.2.10. Rest of MEA
- 10. Global Structural Health Monitoring Market Analysis, Opportunity and Forecast, By Region , 2016-2032
- 10.1. Global Structural Health Monitoring Market Analysis by Region : Introduction
- 10.2. Market Size Absolute $ Opportunity Analysis and Forecast, By Region , 2016-2032
- 10.2.1. North America
- 10.2.2. Western Europe
- 10.2.3. Eastern Europe
- 10.2.4. APAC
- 10.2.5. Latin America
- 10.2.6. Middle East & Africa
- 11. Global Structural Health Monitoring Market Competitive Landscape, Market Share Analysis, and Company Profiles
- 11.1. Market Share Analysis
- 11.2. Company Profiles
- 11.3. Open AI
- 11.3.1. Company Overview
- 11.3.2. Financial Highlights
- 11.3.3. Product Portfolio
- 11.3.4. SWOT Analysis
- 11.3.5. Key Strategies and Developments
- 11.4. Autodesk Inc.
- 11.4.1. Company Overview
- 11.4.2. Financial Highlights
- 11.4.3. Product Portfolio
- 11.4.4. SWOT Analysis
- 11.4.5. Key Strategies and Developments
- 11.5. Dassault Systèmes
- 11.5.1. Company Overview
- 11.5.2. Financial Highlights
- 11.5.3. Product Portfolio
- 11.5.4. SWOT Analysis
- 11.5.5. Key Strategies and Developments
- 11.6. Trimble Inc.
- 11.6.1. Company Overview
- 11.6.2. Financial Highlights
- 11.6.3. Product Portfolio
- 11.6.4. SWOT Analysis
- 11.6.5. Key Strategies and Developments
- 11.7. IBM Corporation
- 11.7.1. Company Overview
- 11.7.2. Financial Highlights
- 11.7.3. Product Portfolio
- 11.7.4. SWOT Analysis
- 11.7.5. Key Strategies and Developments
- 11.8. Siemens AG
- 11.8.1. Company Overview
- 11.8.2. Financial Highlights
- 11.8.3. Product Portfolio
- 11.8.4. SWOT Analysis
- 11.8.5. Key Strategies and Developments
- 11.9. NVIDIA Corporation
- 11.9.1. Company Overview
- 11.9.2. Financial Highlights
- 11.9.3. Product Portfolio
- 11.9.4. SWOT Analysis
- 11.9.5. Key Strategies and Developments
- 11.10. (US$ Mn & Units)y Technologies
- 11.10.1. Company Overview
- 11.10.2. Financial Highlights
- 11.10.3. Product Portfolio
- 11.10.4. SWOT Analysis
- 11.10.5. Key Strategies and Developments
- 11.11. Other Key Players
- 11.11.1. Company Overview
- 11.11.2. Financial Highlights
- 11.11.3. Product Portfolio
- 11.11.4. SWOT Analysis
- 11.11.5. Key Strategies and Developments
- 11.13.1. Company Overview
- 11.13.2. Financial Highlights
- 11.13.3. Product Portfolio
- 11.13.4. SWOT Analysis
- 11.13.5. Key Strategies and Developments
- 12. Assumptions and Acronyms
- 13. Research Methodology
- 14. Contact
"
- List of Figures
- "
- Figure 1: Global Structural Health Monitoring Market Revenue (US$ Mn) Market Share by Deployment in 2022
- Figure 2: Global Structural Health Monitoring Market Market Attractiveness Analysis by Deployment, 2016-2032
- Figure 3: Global Structural Health Monitoring Market Revenue (US$ Mn) Market Share by Applicationin 2022
- Figure 4: Global Structural Health Monitoring Market Market Attractiveness Analysis by Application, 2016-2032
- Figure 5: Global Structural Health Monitoring Market Revenue (US$ Mn) Market Share by Technologyin 2022
- Figure 6: Global Structural Health Monitoring Market Market Attractiveness Analysis by Technology, 2016-2032
- Figure 7: Global Structural Health Monitoring Market Revenue (US$ Mn) Market Share by End-Userin 2022
- Figure 8: Global Structural Health Monitoring Market Market Attractiveness Analysis by End-User, 2016-2032
- Figure 9: Global Structural Health Monitoring Market Revenue (US$ Mn) Market Share by Region in 2022
- Figure 10: Global Structural Health Monitoring Market Market Attractiveness Analysis by Region, 2016-2032
- Figure 11: Global Structural Health Monitoring Market Market Revenue (US$ Mn) (2016-2032)
- Figure 12: Global Structural Health Monitoring Market Market Revenue (US$ Mn) Comparison by Region (2016-2032)
- Figure 13: Global Structural Health Monitoring Market Market Revenue (US$ Mn) Comparison by Deployment (2016-2032)
- Figure 14: Global Structural Health Monitoring Market Market Revenue (US$ Mn) Comparison by Application (2016-2032)
- Figure 15: Global Structural Health Monitoring Market Market Revenue (US$ Mn) Comparison by Technology (2016-2032)
- Figure 16: Global Structural Health Monitoring Market Market Revenue (US$ Mn) Comparison by End-User (2016-2032)
- Figure 17: Global Structural Health Monitoring Market Market Y-o-Y Growth Rate Comparison by Region (2016-2032)
- Figure 18: Global Structural Health Monitoring Market Market Y-o-Y Growth Rate Comparison by Deployment (2016-2032)
- Figure 19: Global Structural Health Monitoring Market Market Y-o-Y Growth Rate Comparison by Application (2016-2032)
- Figure 20: Global Structural Health Monitoring Market Market Y-o-Y Growth Rate Comparison by Technology (2016-2032)
- Figure 21: Global Structural Health Monitoring Market Market Y-o-Y Growth Rate Comparison by End-User (2016-2032)
- Figure 22: Global Structural Health Monitoring Market Market Share Comparison by Region (2016-2032)
- Figure 23: Global Structural Health Monitoring Market Market Share Comparison by Deployment (2016-2032)
- Figure 24: Global Structural Health Monitoring Market Market Share Comparison by Application (2016-2032)
- Figure 25: Global Structural Health Monitoring Market Market Share Comparison by Technology (2016-2032)
- Figure 26: Global Structural Health Monitoring Market Market Share Comparison by End-User (2016-2032)
- Figure 27: North America Structural Health Monitoring Market Revenue (US$ Mn) Market Share by Deploymentin 2022
- Figure 28: North America Structural Health Monitoring Market Market Attractiveness Analysis by Deployment, 2016-2032
- Figure 29: North America Structural Health Monitoring Market Revenue (US$ Mn) Market Share by Applicationin 2022
- Figure 30: North America Structural Health Monitoring Market Market Attractiveness Analysis by Application, 2016-2032
- Figure 31: North America Structural Health Monitoring Market Revenue (US$ Mn) Market Share by Technologyin 2022
- Figure 32: North America Structural Health Monitoring Market Market Attractiveness Analysis by Technology, 2016-2032
- Figure 33: North America Structural Health Monitoring Market Revenue (US$ Mn) Market Share by End-Userin 2022
- Figure 34: North America Structural Health Monitoring Market Market Attractiveness Analysis by End-User, 2016-2032
- Figure 35: North America Structural Health Monitoring Market Revenue (US$ Mn) Market Share by Country in 2022
- Figure 36: North America Structural Health Monitoring Market Market Attractiveness Analysis by Country, 2016-2032
- Figure 37: North America Structural Health Monitoring Market Market Revenue (US$ Mn) (2016-2032)
- Figure 38: North America Structural Health Monitoring Market Market Revenue (US$ Mn) Comparison by Country (2016-2032)
- Figure 39: North America Structural Health Monitoring Market Market Revenue (US$ Mn) Comparison by Deployment (2016-2032)
- Figure 40: North America Structural Health Monitoring Market Market Revenue (US$ Mn) Comparison by Application (2016-2032)
- Figure 41: North America Structural Health Monitoring Market Market Revenue (US$ Mn) Comparison by Technology (2016-2032)
- Figure 42: North America Structural Health Monitoring Market Market Revenue (US$ Mn) Comparison by End-User (2016-2032)
- Figure 43: North America Structural Health Monitoring Market Market Y-o-Y Growth Rate Comparison by Country (2016-2032)
- Figure 44: North America Structural Health Monitoring Market Market Y-o-Y Growth Rate Comparison by Deployment (2016-2032)
- Figure 45: North America Structural Health Monitoring Market Market Y-o-Y Growth Rate Comparison by Application (2016-2032)
- Figure 46: North America Structural Health Monitoring Market Market Y-o-Y Growth Rate Comparison by Technology (2016-2032)
- Figure 47: North America Structural Health Monitoring Market Market Y-o-Y Growth Rate Comparison by End-User (2016-2032)
- Figure 48: North America Structural Health Monitoring Market Market Share Comparison by Country (2016-2032)
- Figure 49: North America Structural Health Monitoring Market Market Share Comparison by Deployment (2016-2032)
- Figure 50: North America Structural Health Monitoring Market Market Share Comparison by Application (2016-2032)
- Figure 51: North America Structural Health Monitoring Market Market Share Comparison by Technology (2016-2032)
- Figure 52: North America Structural Health Monitoring Market Market Share Comparison by End-User (2016-2032)
- Figure 53: Western Europe Structural Health Monitoring Market Revenue (US$ Mn) Market Share by Deploymentin 2022
- Figure 54: Western Europe Structural Health Monitoring Market Market Attractiveness Analysis by Deployment, 2016-2032
- Figure 55: Western Europe Structural Health Monitoring Market Revenue (US$ Mn) Market Share by Applicationin 2022
- Figure 56: Western Europe Structural Health Monitoring Market Market Attractiveness Analysis by Application, 2016-2032
- Figure 57: Western Europe Structural Health Monitoring Market Revenue (US$ Mn) Market Share by Technologyin 2022
- Figure 58: Western Europe Structural Health Monitoring Market Market Attractiveness Analysis by Technology, 2016-2032
- Figure 59: Western Europe Structural Health Monitoring Market Revenue (US$ Mn) Market Share by End-Userin 2022
- Figure 60: Western Europe Structural Health Monitoring Market Market Attractiveness Analysis by End-User, 2016-2032
- Figure 61: Western Europe Structural Health Monitoring Market Revenue (US$ Mn) Market Share by Country in 2022
- Figure 62: Western Europe Structural Health Monitoring Market Market Attractiveness Analysis by Country, 2016-2032
- Figure 63: Western Europe Structural Health Monitoring Market Market Revenue (US$ Mn) (2016-2032)
- Figure 64: Western Europe Structural Health Monitoring Market Market Revenue (US$ Mn) Comparison by Country (2016-2032)
- Figure 65: Western Europe Structural Health Monitoring Market Market Revenue (US$ Mn) Comparison by Deployment (2016-2032)
- Figure 66: Western Europe Structural Health Monitoring Market Market Revenue (US$ Mn) Comparison by Application (2016-2032)
- Figure 67: Western Europe Structural Health Monitoring Market Market Revenue (US$ Mn) Comparison by Technology (2016-2032)
- Figure 68: Western Europe Structural Health Monitoring Market Market Revenue (US$ Mn) Comparison by End-User (2016-2032)
- Figure 69: Western Europe Structural Health Monitoring Market Market Y-o-Y Growth Rate Comparison by Country (2016-2032)
- Figure 70: Western Europe Structural Health Monitoring Market Market Y-o-Y Growth Rate Comparison by Deployment (2016-2032)
- Figure 71: Western Europe Structural Health Monitoring Market Market Y-o-Y Growth Rate Comparison by Application (2016-2032)
- Figure 72: Western Europe Structural Health Monitoring Market Market Y-o-Y Growth Rate Comparison by Technology (2016-2032)
- Figure 73: Western Europe Structural Health Monitoring Market Market Y-o-Y Growth Rate Comparison by End-User (2016-2032)
- Figure 74: Western Europe Structural Health Monitoring Market Market Share Comparison by Country (2016-2032)
- Figure 75: Western Europe Structural Health Monitoring Market Market Share Comparison by Deployment (2016-2032)
- Figure 76: Western Europe Structural Health Monitoring Market Market Share Comparison by Application (2016-2032)
- Figure 77: Western Europe Structural Health Monitoring Market Market Share Comparison by Technology (2016-2032)
- Figure 78: Western Europe Structural Health Monitoring Market Market Share Comparison by End-User (2016-2032)
- Figure 79: Eastern Europe Structural Health Monitoring Market Revenue (US$ Mn) Market Share by Deploymentin 2022
- Figure 80: Eastern Europe Structural Health Monitoring Market Market Attractiveness Analysis by Deployment, 2016-2032
- Figure 81: Eastern Europe Structural Health Monitoring Market Revenue (US$ Mn) Market Share by Applicationin 2022
- Figure 82: Eastern Europe Structural Health Monitoring Market Market Attractiveness Analysis by Application, 2016-2032
- Figure 83: Eastern Europe Structural Health Monitoring Market Revenue (US$ Mn) Market Share by Technologyin 2022
- Figure 84: Eastern Europe Structural Health Monitoring Market Market Attractiveness Analysis by Technology, 2016-2032
- Figure 85: Eastern Europe Structural Health Monitoring Market Revenue (US$ Mn) Market Share by End-Userin 2022
- Figure 86: Eastern Europe Structural Health Monitoring Market Market Attractiveness Analysis by End-User, 2016-2032
- Figure 87: Eastern Europe Structural Health Monitoring Market Revenue (US$ Mn) Market Share by Country in 2022
- Figure 88: Eastern Europe Structural Health Monitoring Market Market Attractiveness Analysis by Country, 2016-2032
- Figure 89: Eastern Europe Structural Health Monitoring Market Market Revenue (US$ Mn) (2016-2032)
- Figure 90: Eastern Europe Structural Health Monitoring Market Market Revenue (US$ Mn) Comparison by Country (2016-2032)
- Figure 91: Eastern Europe Structural Health Monitoring Market Market Revenue (US$ Mn) Comparison by Deployment (2016-2032)
- Figure 92: Eastern Europe Structural Health Monitoring Market Market Revenue (US$ Mn) Comparison by Application (2016-2032)
- Figure 93: Eastern Europe Structural Health Monitoring Market Market Revenue (US$ Mn) Comparison by Technology (2016-2032)
- Figure 94: Eastern Europe Structural Health Monitoring Market Market Revenue (US$ Mn) Comparison by End-User (2016-2032)
- Figure 95: Eastern Europe Structural Health Monitoring Market Market Y-o-Y Growth Rate Comparison by Country (2016-2032)
- Figure 96: Eastern Europe Structural Health Monitoring Market Market Y-o-Y Growth Rate Comparison by Deployment (2016-2032)
- Figure 97: Eastern Europe Structural Health Monitoring Market Market Y-o-Y Growth Rate Comparison by Application (2016-2032)
- Figure 98: Eastern Europe Structural Health Monitoring Market Market Y-o-Y Growth Rate Comparison by Technology (2016-2032)
- Figure 99: Eastern Europe Structural Health Monitoring Market Market Y-o-Y Growth Rate Comparison by End-User (2016-2032)
- Figure 100: Eastern Europe Structural Health Monitoring Market Market Share Comparison by Country (2016-2032)
- Figure 101: Eastern Europe Structural Health Monitoring Market Market Share Comparison by Deployment (2016-2032)
- Figure 102: Eastern Europe Structural Health Monitoring Market Market Share Comparison by Application (2016-2032)
- Figure 103: Eastern Europe Structural Health Monitoring Market Market Share Comparison by Technology (2016-2032)
- Figure 104: Eastern Europe Structural Health Monitoring Market Market Share Comparison by End-User (2016-2032)
- Figure 105: APAC Structural Health Monitoring Market Revenue (US$ Mn) Market Share by Deploymentin 2022
- Figure 106: APAC Structural Health Monitoring Market Market Attractiveness Analysis by Deployment, 2016-2032
- Figure 107: APAC Structural Health Monitoring Market Revenue (US$ Mn) Market Share by Applicationin 2022
- Figure 108: APAC Structural Health Monitoring Market Market Attractiveness Analysis by Application, 2016-2032
- Figure 109: APAC Structural Health Monitoring Market Revenue (US$ Mn) Market Share by Technologyin 2022
- Figure 110: APAC Structural Health Monitoring Market Market Attractiveness Analysis by Technology, 2016-2032
- Figure 111: APAC Structural Health Monitoring Market Revenue (US$ Mn) Market Share by End-Userin 2022
- Figure 112: APAC Structural Health Monitoring Market Market Attractiveness Analysis by End-User, 2016-2032
- Figure 113: APAC Structural Health Monitoring Market Revenue (US$ Mn) Market Share by Country in 2022
- Figure 114: APAC Structural Health Monitoring Market Market Attractiveness Analysis by Country, 2016-2032
- Figure 115: APAC Structural Health Monitoring Market Market Revenue (US$ Mn) (2016-2032)
- Figure 116: APAC Structural Health Monitoring Market Market Revenue (US$ Mn) Comparison by Country (2016-2032)
- Figure 117: APAC Structural Health Monitoring Market Market Revenue (US$ Mn) Comparison by Deployment (2016-2032)
- Figure 118: APAC Structural Health Monitoring Market Market Revenue (US$ Mn) Comparison by Application (2016-2032)
- Figure 119: APAC Structural Health Monitoring Market Market Revenue (US$ Mn) Comparison by Technology (2016-2032)
- Figure 120: APAC Structural Health Monitoring Market Market Revenue (US$ Mn) Comparison by End-User (2016-2032)
- Figure 121: APAC Structural Health Monitoring Market Market Y-o-Y Growth Rate Comparison by Country (2016-2032)
- Figure 122: APAC Structural Health Monitoring Market Market Y-o-Y Growth Rate Comparison by Deployment (2016-2032)
- Figure 123: APAC Structural Health Monitoring Market Market Y-o-Y Growth Rate Comparison by Application (2016-2032)
- Figure 124: APAC Structural Health Monitoring Market Market Y-o-Y Growth Rate Comparison by Technology (2016-2032)
- Figure 125: APAC Structural Health Monitoring Market Market Y-o-Y Growth Rate Comparison by End-User (2016-2032)
- Figure 126: APAC Structural Health Monitoring Market Market Share Comparison by Country (2016-2032)
- Figure 127: APAC Structural Health Monitoring Market Market Share Comparison by Deployment (2016-2032)
- Figure 128: APAC Structural Health Monitoring Market Market Share Comparison by Application (2016-2032)
- Figure 129: APAC Structural Health Monitoring Market Market Share Comparison by Technology (2016-2032)
- Figure 130: APAC Structural Health Monitoring Market Market Share Comparison by End-User (2016-2032)
- Figure 131: Latin America Structural Health Monitoring Market Revenue (US$ Mn) Market Share by Deploymentin 2022
- Figure 132: Latin America Structural Health Monitoring Market Market Attractiveness Analysis by Deployment, 2016-2032
- Figure 133: Latin America Structural Health Monitoring Market Revenue (US$ Mn) Market Share by Applicationin 2022
- Figure 134: Latin America Structural Health Monitoring Market Market Attractiveness Analysis by Application, 2016-2032
- Figure 135: Latin America Structural Health Monitoring Market Revenue (US$ Mn) Market Share by Technologyin 2022
- Figure 136: Latin America Structural Health Monitoring Market Market Attractiveness Analysis by Technology, 2016-2032
- Figure 137: Latin America Structural Health Monitoring Market Revenue (US$ Mn) Market Share by End-Userin 2022
- Figure 138: Latin America Structural Health Monitoring Market Market Attractiveness Analysis by End-User, 2016-2032
- Figure 139: Latin America Structural Health Monitoring Market Revenue (US$ Mn) Market Share by Country in 2022
- Figure 140: Latin America Structural Health Monitoring Market Market Attractiveness Analysis by Country, 2016-2032
- Figure 141: Latin America Structural Health Monitoring Market Market Revenue (US$ Mn) (2016-2032)
- Figure 142: Latin America Structural Health Monitoring Market Market Revenue (US$ Mn) Comparison by Country (2016-2032)
- Figure 143: Latin America Structural Health Monitoring Market Market Revenue (US$ Mn) Comparison by Deployment (2016-2032)
- Figure 144: Latin America Structural Health Monitoring Market Market Revenue (US$ Mn) Comparison by Application (2016-2032)
- Figure 145: Latin America Structural Health Monitoring Market Market Revenue (US$ Mn) Comparison by Technology (2016-2032)
- Figure 146: Latin America Structural Health Monitoring Market Market Revenue (US$ Mn) Comparison by End-User (2016-2032)
- Figure 147: Latin America Structural Health Monitoring Market Market Y-o-Y Growth Rate Comparison by Country (2016-2032)
- Figure 148: Latin America Structural Health Monitoring Market Market Y-o-Y Growth Rate Comparison by Deployment (2016-2032)
- Figure 149: Latin America Structural Health Monitoring Market Market Y-o-Y Growth Rate Comparison by Application (2016-2032)
- Figure 150: Latin America Structural Health Monitoring Market Market Y-o-Y Growth Rate Comparison by Technology (2016-2032)
- Figure 151: Latin America Structural Health Monitoring Market Market Y-o-Y Growth Rate Comparison by End-User (2016-2032)
- Figure 152: Latin America Structural Health Monitoring Market Market Share Comparison by Country (2016-2032)
- Figure 153: Latin America Structural Health Monitoring Market Market Share Comparison by Deployment (2016-2032)
- Figure 154: Latin America Structural Health Monitoring Market Market Share Comparison by Application (2016-2032)
- Figure 155: Latin America Structural Health Monitoring Market Market Share Comparison by Technology (2016-2032)
- Figure 156: Latin America Structural Health Monitoring Market Market Share Comparison by End-User (2016-2032)
- Figure 157: Middle East & Africa Structural Health Monitoring Market Revenue (US$ Mn) Market Share by Deploymentin 2022
- Figure 158: Middle East & Africa Structural Health Monitoring Market Market Attractiveness Analysis by Deployment, 2016-2032
- Figure 159: Middle East & Africa Structural Health Monitoring Market Revenue (US$ Mn) Market Share by Applicationin 2022
- Figure 160: Middle East & Africa Structural Health Monitoring Market Market Attractiveness Analysis by Application, 2016-2032
- Figure 161: Middle East & Africa Structural Health Monitoring Market Revenue (US$ Mn) Market Share by Technologyin 2022
- Figure 162: Middle East & Africa Structural Health Monitoring Market Market Attractiveness Analysis by Technology, 2016-2032
- Figure 163: Middle East & Africa Structural Health Monitoring Market Revenue (US$ Mn) Market Share by End-Userin 2022
- Figure 164: Middle East & Africa Structural Health Monitoring Market Market Attractiveness Analysis by End-User, 2016-2032
- Figure 165: Middle East & Africa Structural Health Monitoring Market Revenue (US$ Mn) Market Share by Country in 2022
- Figure 166: Middle East & Africa Structural Health Monitoring Market Market Attractiveness Analysis by Country, 2016-2032
- Figure 167: Middle East & Africa Structural Health Monitoring Market Market Revenue (US$ Mn) (2016-2032)
- Figure 168: Middle East & Africa Structural Health Monitoring Market Market Revenue (US$ Mn) Comparison by Country (2016-2032)
- Figure 169: Middle East & Africa Structural Health Monitoring Market Market Revenue (US$ Mn) Comparison by Deployment (2016-2032)
- Figure 170: Middle East & Africa Structural Health Monitoring Market Market Revenue (US$ Mn) Comparison by Application (2016-2032)
- Figure 171: Middle East & Africa Structural Health Monitoring Market Market Revenue (US$ Mn) Comparison by Technology (2016-2032)
- Figure 172: Middle East & Africa Structural Health Monitoring Market Market Revenue (US$ Mn) Comparison by End-User (2016-2032)
- Figure 173: Middle East & Africa Structural Health Monitoring Market Market Y-o-Y Growth Rate Comparison by Country (2016-2032)
- Figure 174: Middle East & Africa Structural Health Monitoring Market Market Y-o-Y Growth Rate Comparison by Deployment (2016-2032)
- Figure 175: Middle East & Africa Structural Health Monitoring Market Market Y-o-Y Growth Rate Comparison by Application (2016-2032)
- Figure 176: Middle East & Africa Structural Health Monitoring Market Market Y-o-Y Growth Rate Comparison by Technology (2016-2032)
- Figure 177: Middle East & Africa Structural Health Monitoring Market Market Y-o-Y Growth Rate Comparison by End-User (2016-2032)
- Figure 178: Middle East & Africa Structural Health Monitoring Market Market Share Comparison by Country (2016-2032)
- Figure 179: Middle East & Africa Structural Health Monitoring Market Market Share Comparison by Deployment (2016-2032)
- Figure 180: Middle East & Africa Structural Health Monitoring Market Market Share Comparison by Application (2016-2032)
- Figure 181: Middle East & Africa Structural Health Monitoring Market Market Share Comparison by Technology (2016-2032)
- Figure 182: Middle East & Africa Structural Health Monitoring Market Market Share Comparison by End-User (2016-2032)
"
- List of Tables
- "
- Table 1: Global Structural Health Monitoring Market Market Comparison by Deployment (2016-2032)
- Table 2: Global Structural Health Monitoring Market Market Comparison by Application (2016-2032)
- Table 3: Global Structural Health Monitoring Market Market Comparison by Technology (2016-2032)
- Table 4: Global Structural Health Monitoring Market Market Comparison by End-User (2016-2032)
- Table 5: Global Structural Health Monitoring Market Revenue (US$ Mn) Comparison by Region (2016-2032)
- Table 6: Global Structural Health Monitoring Market Market Revenue (US$ Mn) (2016-2032)
- Table 7: Global Structural Health Monitoring Market Market Revenue (US$ Mn) Comparison by Region (2016-2032)
- Table 8: Global Structural Health Monitoring Market Market Revenue (US$ Mn) Comparison by Deployment (2016-2032)
- Table 9: Global Structural Health Monitoring Market Market Revenue (US$ Mn) Comparison by Application (2016-2032)
- Table 10: Global Structural Health Monitoring Market Market Revenue (US$ Mn) Comparison by Technology (2016-2032)
- Table 11: Global Structural Health Monitoring Market Market Revenue (US$ Mn) Comparison by End-User (2016-2032)
- Table 12: Global Structural Health Monitoring Market Market Y-o-Y Growth Rate Comparison by Region (2016-2032)
- Table 13: Global Structural Health Monitoring Market Market Y-o-Y Growth Rate Comparison by Deployment (2016-2032)
- Table 14: Global Structural Health Monitoring Market Market Y-o-Y Growth Rate Comparison by Application (2016-2032)
- Table 15: Global Structural Health Monitoring Market Market Y-o-Y Growth Rate Comparison by Technology (2016-2032)
- Table 16: Global Structural Health Monitoring Market Market Y-o-Y Growth Rate Comparison by End-User (2016-2032)
- Table 17: Global Structural Health Monitoring Market Market Share Comparison by Region (2016-2032)
- Table 18: Global Structural Health Monitoring Market Market Share Comparison by Deployment (2016-2032)
- Table 19: Global Structural Health Monitoring Market Market Share Comparison by Application (2016-2032)
- Table 20: Global Structural Health Monitoring Market Market Share Comparison by Technology (2016-2032)
- Table 21: Global Structural Health Monitoring Market Market Share Comparison by End-User (2016-2032)
- Table 22: North America Structural Health Monitoring Market Market Comparison by Application (2016-2032)
- Table 23: North America Structural Health Monitoring Market Market Comparison by Technology (2016-2032)
- Table 24: North America Structural Health Monitoring Market Market Comparison by End-User (2016-2032)
- Table 25: North America Structural Health Monitoring Market Revenue (US$ Mn) Comparison by Country (2016-2032)
- Table 26: North America Structural Health Monitoring Market Market Revenue (US$ Mn) (2016-2032)
- Table 27: North America Structural Health Monitoring Market Market Revenue (US$ Mn) Comparison by Country (2016-2032)
- Table 28: North America Structural Health Monitoring Market Market Revenue (US$ Mn) Comparison by Deployment (2016-2032)
- Table 29: North America Structural Health Monitoring Market Market Revenue (US$ Mn) Comparison by Application (2016-2032)
- Table 30: North America Structural Health Monitoring Market Market Revenue (US$ Mn) Comparison by Technology (2016-2032)
- Table 31: North America Structural Health Monitoring Market Market Revenue (US$ Mn) Comparison by End-User (2016-2032)
- Table 32: North America Structural Health Monitoring Market Market Y-o-Y Growth Rate Comparison by Country (2016-2032)
- Table 33: North America Structural Health Monitoring Market Market Y-o-Y Growth Rate Comparison by Deployment (2016-2032)
- Table 34: North America Structural Health Monitoring Market Market Y-o-Y Growth Rate Comparison by Application (2016-2032)
- Table 35: North America Structural Health Monitoring Market Market Y-o-Y Growth Rate Comparison by Technology (2016-2032)
- Table 36: North America Structural Health Monitoring Market Market Y-o-Y Growth Rate Comparison by End-User (2016-2032)
- Table 37: North America Structural Health Monitoring Market Market Share Comparison by Country (2016-2032)
- Table 38: North America Structural Health Monitoring Market Market Share Comparison by Deployment (2016-2032)
- Table 39: North America Structural Health Monitoring Market Market Share Comparison by Application (2016-2032)
- Table 40: North America Structural Health Monitoring Market Market Share Comparison by Technology (2016-2032)
- Table 41: North America Structural Health Monitoring Market Market Share Comparison by End-User (2016-2032)
- Table 42: Western Europe Structural Health Monitoring Market Market Comparison by Deployment (2016-2032)
- Table 43: Western Europe Structural Health Monitoring Market Market Comparison by Application (2016-2032)
- Table 44: Western Europe Structural Health Monitoring Market Market Comparison by Technology (2016-2032)
- Table 45: Western Europe Structural Health Monitoring Market Market Comparison by End-User (2016-2032)
- Table 46: Western Europe Structural Health Monitoring Market Revenue (US$ Mn) Comparison by Country (2016-2032)
- Table 47: Western Europe Structural Health Monitoring Market Market Revenue (US$ Mn) (2016-2032)
- Table 48: Western Europe Structural Health Monitoring Market Market Revenue (US$ Mn) Comparison by Country (2016-2032)
- Table 49: Western Europe Structural Health Monitoring Market Market Revenue (US$ Mn) Comparison by Deployment (2016-2032)
- Table 50: Western Europe Structural Health Monitoring Market Market Revenue (US$ Mn) Comparison by Application (2016-2032)
- Table 51: Western Europe Structural Health Monitoring Market Market Revenue (US$ Mn) Comparison by Technology (2016-2032)
- Table 52: Western Europe Structural Health Monitoring Market Market Revenue (US$ Mn) Comparison by End-User (2016-2032)
- Table 53: Western Europe Structural Health Monitoring Market Market Y-o-Y Growth Rate Comparison by Country (2016-2032)
- Table 54: Western Europe Structural Health Monitoring Market Market Y-o-Y Growth Rate Comparison by Deployment (2016-2032)
- Table 55: Western Europe Structural Health Monitoring Market Market Y-o-Y Growth Rate Comparison by Application (2016-2032)
- Table 56: Western Europe Structural Health Monitoring Market Market Y-o-Y Growth Rate Comparison by Technology (2016-2032)
- Table 57: Western Europe Structural Health Monitoring Market Market Y-o-Y Growth Rate Comparison by End-User (2016-2032)
- Table 58: Western Europe Structural Health Monitoring Market Market Share Comparison by Country (2016-2032)
- Table 59: Western Europe Structural Health Monitoring Market Market Share Comparison by Deployment (2016-2032)
- Table 60: Western Europe Structural Health Monitoring Market Market Share Comparison by Application (2016-2032)
- Table 61: Western Europe Structural Health Monitoring Market Market Share Comparison by Technology (2016-2032)
- Table 62: Western Europe Structural Health Monitoring Market Market Share Comparison by End-User (2016-2032)
- Table 63: Eastern Europe Structural Health Monitoring Market Market Comparison by Deployment (2016-2032)
- Table 64: Eastern Europe Structural Health Monitoring Market Market Comparison by Application (2016-2032)
- Table 65: Eastern Europe Structural Health Monitoring Market Market Comparison by Technology (2016-2032)
- Table 66: Eastern Europe Structural Health Monitoring Market Market Comparison by End-User (2016-2032)
- Table 67: Eastern Europe Structural Health Monitoring Market Revenue (US$ Mn) Comparison by Country (2016-2032)
- Table 68: Eastern Europe Structural Health Monitoring Market Market Revenue (US$ Mn) (2016-2032)
- Table 69: Eastern Europe Structural Health Monitoring Market Market Revenue (US$ Mn) Comparison by Country (2016-2032)
- Table 70: Eastern Europe Structural Health Monitoring Market Market Revenue (US$ Mn) Comparison by Deployment (2016-2032)
- Table 71: Eastern Europe Structural Health Monitoring Market Market Revenue (US$ Mn) Comparison by Application (2016-2032)
- Table 72: Eastern Europe Structural Health Monitoring Market Market Revenue (US$ Mn) Comparison by Technology (2016-2032)
- Table 73: Eastern Europe Structural Health Monitoring Market Market Revenue (US$ Mn) Comparison by End-User (2016-2032)
- Table 74: Eastern Europe Structural Health Monitoring Market Market Y-o-Y Growth Rate Comparison by Country (2016-2032)
- Table 75: Eastern Europe Structural Health Monitoring Market Market Y-o-Y Growth Rate Comparison by Deployment (2016-2032)
- Table 76: Eastern Europe Structural Health Monitoring Market Market Y-o-Y Growth Rate Comparison by Application (2016-2032)
- Table 77: Eastern Europe Structural Health Monitoring Market Market Y-o-Y Growth Rate Comparison by Technology (2016-2032)
- Table 78: Eastern Europe Structural Health Monitoring Market Market Y-o-Y Growth Rate Comparison by End-User (2016-2032)
- Table 79: Eastern Europe Structural Health Monitoring Market Market Share Comparison by Country (2016-2032)
- Table 80: Eastern Europe Structural Health Monitoring Market Market Share Comparison by Deployment (2016-2032)
- Table 81: Eastern Europe Structural Health Monitoring Market Market Share Comparison by Application (2016-2032)
- Table 82: Eastern Europe Structural Health Monitoring Market Market Share Comparison by Technology (2016-2032)
- Table 83: Eastern Europe Structural Health Monitoring Market Market Share Comparison by End-User (2016-2032)
- Table 84: APAC Structural Health Monitoring Market Market Comparison by Deployment (2016-2032)
- Table 85: APAC Structural Health Monitoring Market Market Comparison by Application (2016-2032)
- Table 86: APAC Structural Health Monitoring Market Market Comparison by Technology (2016-2032)
- Table 87: APAC Structural Health Monitoring Market Market Comparison by End-User (2016-2032)
- Table 88: APAC Structural Health Monitoring Market Revenue (US$ Mn) Comparison by Country (2016-2032)
- Table 89: APAC Structural Health Monitoring Market Market Revenue (US$ Mn) (2016-2032)
- Table 90: APAC Structural Health Monitoring Market Market Revenue (US$ Mn) Comparison by Country (2016-2032)
- Table 91: APAC Structural Health Monitoring Market Market Revenue (US$ Mn) Comparison by Deployment (2016-2032)
- Table 92: APAC Structural Health Monitoring Market Market Revenue (US$ Mn) Comparison by Application (2016-2032)
- Table 93: APAC Structural Health Monitoring Market Market Revenue (US$ Mn) Comparison by Technology (2016-2032)
- Table 94: APAC Structural Health Monitoring Market Market Revenue (US$ Mn) Comparison by End-User (2016-2032)
- Table 95: APAC Structural Health Monitoring Market Market Y-o-Y Growth Rate Comparison by Country (2016-2032)
- Table 96: APAC Structural Health Monitoring Market Market Y-o-Y Growth Rate Comparison by Deployment (2016-2032)
- Table 97: APAC Structural Health Monitoring Market Market Y-o-Y Growth Rate Comparison by Application (2016-2032)
- Table 98: APAC Structural Health Monitoring Market Market Y-o-Y Growth Rate Comparison by Technology (2016-2032)
- Table 99: APAC Structural Health Monitoring Market Market Y-o-Y Growth Rate Comparison by End-User (2016-2032)
- Table 100: APAC Structural Health Monitoring Market Market Share Comparison by Country (2016-2032)
- Table 101: APAC Structural Health Monitoring Market Market Share Comparison by Deployment (2016-2032)
- Table 102: APAC Structural Health Monitoring Market Market Share Comparison by Application (2016-2032)
- Table 103: APAC Structural Health Monitoring Market Market Share Comparison by Technology (2016-2032)
- Table 104: APAC Structural Health Monitoring Market Market Share Comparison by End-User (2016-2032)
- Table 105: Latin America Structural Health Monitoring Market Market Comparison by Deployment (2016-2032)
- Table 106: Latin America Structural Health Monitoring Market Market Comparison by Application (2016-2032)
- Table 107: Latin America Structural Health Monitoring Market Market Comparison by Technology (2016-2032)
- Table 108: Latin America Structural Health Monitoring Market Market Comparison by End-User (2016-2032)
- Table 109: Latin America Structural Health Monitoring Market Revenue (US$ Mn) Comparison by Country (2016-2032)
- Table 110: Latin America Structural Health Monitoring Market Market Revenue (US$ Mn) (2016-2032)
- Table 111: Latin America Structural Health Monitoring Market Market Revenue (US$ Mn) Comparison by Country (2016-2032)
- Table 112: Latin America Structural Health Monitoring Market Market Revenue (US$ Mn) Comparison by Deployment (2016-2032)
- Table 113: Latin America Structural Health Monitoring Market Market Revenue (US$ Mn) Comparison by Application (2016-2032)
- Table 114: Latin America Structural Health Monitoring Market Market Revenue (US$ Mn) Comparison by Technology (2016-2032)
- Table 115: Latin America Structural Health Monitoring Market Market Revenue (US$ Mn) Comparison by End-User (2016-2032)
- Table 116: Latin America Structural Health Monitoring Market Market Y-o-Y Growth Rate Comparison by Country (2016-2032)
- Table 117: Latin America Structural Health Monitoring Market Market Y-o-Y Growth Rate Comparison by Deployment (2016-2032)
- Table 118: Latin America Structural Health Monitoring Market Market Y-o-Y Growth Rate Comparison by Application (2016-2032)
- Table 119: Latin America Structural Health Monitoring Market Market Y-o-Y Growth Rate Comparison by Technology (2016-2032)
- Table 120: Latin America Structural Health Monitoring Market Market Y-o-Y Growth Rate Comparison by End-User (2016-2032)
- Table 121: Latin America Structural Health Monitoring Market Market Share Comparison by Country (2016-2032)
- Table 122: Latin America Structural Health Monitoring Market Market Share Comparison by Deployment (2016-2032)
- Table 123: Latin America Structural Health Monitoring Market Market Share Comparison by Application (2016-2032)
- Table 124: Latin America Structural Health Monitoring Market Market Share Comparison by Technology (2016-2032)
- Table 125: Latin America Structural Health Monitoring Market Market Share Comparison by End-User (2016-2032)
- Table 126: Middle East & Africa Structural Health Monitoring Market Market Comparison by Deployment (2016-2032)
- Table 127: Middle East & Africa Structural Health Monitoring Market Market Comparison by Application (2016-2032)
- Table 128: Middle East & Africa Structural Health Monitoring Market Market Comparison by Technology (2016-2032)
- Table 129: Middle East & Africa Structural Health Monitoring Market Market Comparison by End-User (2016-2032)
- Table 130: Middle East & Africa Structural Health Monitoring Market Revenue (US$ Mn) Comparison by Country (2016-2032)
- Table 131: Middle East & Africa Structural Health Monitoring Market Market Revenue (US$ Mn) (2016-2032)
- Table 132: Middle East & Africa Structural Health Monitoring Market Market Revenue (US$ Mn) Comparison by Country (2016-2032)
- Table 133: Middle East & Africa Structural Health Monitoring Market Market Revenue (US$ Mn) Comparison by Deployment (2016-2032)
- Table 134: Middle East & Africa Structural Health Monitoring Market Market Revenue (US$ Mn) Comparison by Application (2016-2032)
- Table 135: Middle East & Africa Structural Health Monitoring Market Market Revenue (US$ Mn) Comparison by Technology (2016-2032)
- Table 136: Middle East & Africa Structural Health Monitoring Market Market Revenue (US$ Mn) Comparison by End-User (2016-2032)
- Table 137: Middle East & Africa Structural Health Monitoring Market Market Y-o-Y Growth Rate Comparison by Country (2016-2032)
- Table 138: Middle East & Africa Structural Health Monitoring Market Market Y-o-Y Growth Rate Comparison by Deployment (2016-2032)
- Table 139: Middle East & Africa Structural Health Monitoring Market Market Y-o-Y Growth Rate Comparison by Application (2016-2032)
- Table 140: Middle East & Africa Structural Health Monitoring Market Market Y-o-Y Growth Rate Comparison by Technology (2016-2032)
- Table 141: Middle East & Africa Structural Health Monitoring Market Market Y-o-Y Growth Rate Comparison by End-User (2016-2032)
- Table 142: Middle East & Africa Structural Health Monitoring Market Market Share Comparison by Country (2016-2032)
- Table 143: Middle East & Africa Structural Health Monitoring Market Market Share Comparison by Deployment (2016-2032)
- Table 144: Middle East & Africa Structural Health Monitoring Market Market Share Comparison by Application (2016-2032)
- Table 145: Middle East & Africa Structural Health Monitoring Market Market Share Comparison by Technology (2016-2032)
- Table 146: Middle East & Africa Structural Health Monitoring Market Market Share Comparison by End-User (2016-2032)
- 1. Executive Summary
-
- Open AI
- Autodesk Inc.
- Dassault Systèmes
- Trimble Inc.
- IBM Corporation
- Siemens AG
- NVIDIA Corporation
- Unity Technologies
- Other Key Players
Our Clients


View Our Licence Options
