
Furfural Derivatives Market Report By Type of Derivative (Tetrahydrofurfuryl Alcohol, Furfural Alcohol, Furfuryl Alcohol, 2-Methyltetrahydrofuran (2-MTHF), 5-Methylfurfural, Furoic Acid, Others), By Application (Solvent, Chemical Intermediate, Flavoring Agent, Preservative, Pharmaceutical Intermediate, Agricultural Chemical, Others), By End User Industry (Petrochemical, Chemical, Pharmaceutical, Food and Beverage, Agriculture, Others), By Region and Companies - Industry Segment Outlook, Market Assessment, Competition Scenario, Trends and Forecast 20
-
46112
-
April 2023
-
321
-


-
This report was compiled by Shreyas Rokade Shreyas Rokade is a seasoned Research Analyst with CMFE, bringing extensive expertise in market research and consulting, with a strong background in Chemical Engineering. Correspondence Team Lead-CMFE Linkedin | Detailed Market research Methodology Our methodology involves a mix of primary research, including interviews with leading mental health experts, and secondary research from reputable medical journals and databases. View Detailed Methodology Page
-
Quick Navigation
Report Overview
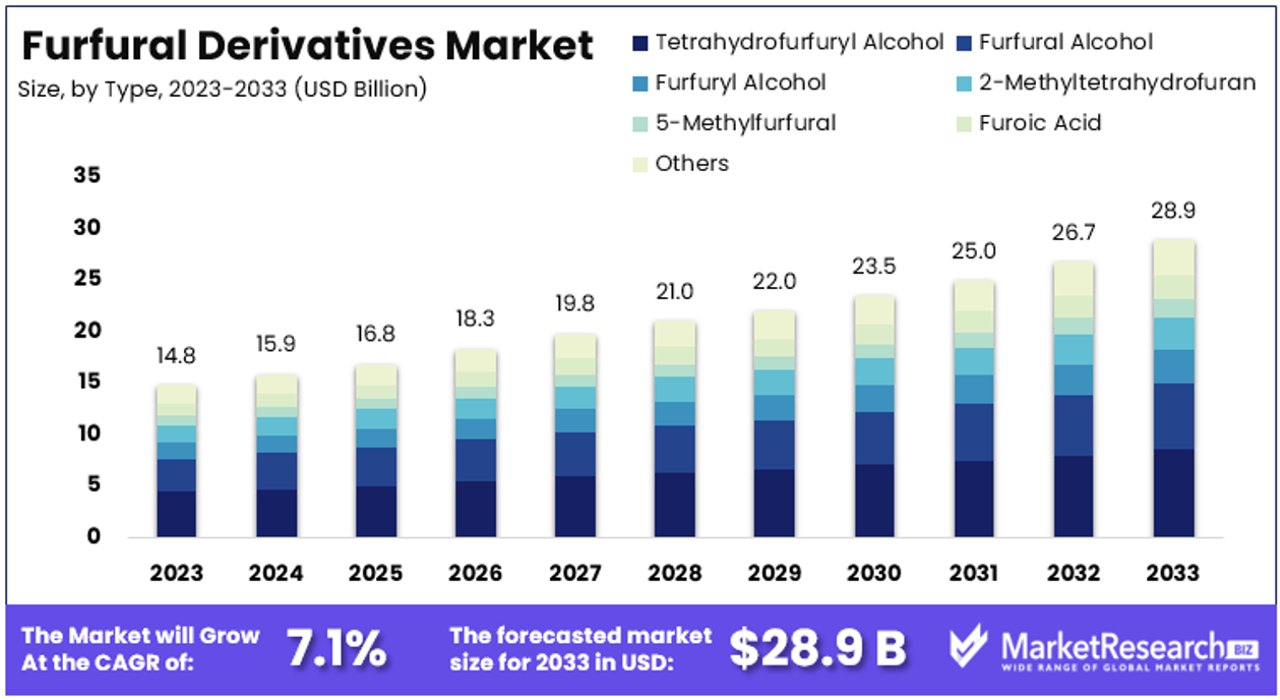
The Global Furfural Derivatives Market size is expected to be worth around USD 28.9 Billion by 2033, from USD 14.8 Billion in 2023, growing at a CAGR of 7.1% during the forecast period from 2024 to 2033.
The Furfural Derivatives Market encompasses a range of biochemical compounds derived from the catalytic processing of furfural, an organic compound obtained primarily from agricultural byproducts like corncobs and oat hulls. These derivatives, including furfuryl alcohol and tetrahydrofurfuryl alcohol, are critical in the manufacture of resins, solvents, and pharmaceuticals.
The market is increasingly relevant as industries seek sustainable, biobased chemicals to reduce environmental impact. For leaders in sectors like automotive, construction, and healthcare, investing in furfural derivatives offers a path to enhanced sustainability and compliance with global green mandates.
The Furfural Derivatives Market is poised for substantial growth, driven by increased demand in the pharmaceutical and agrochemical industries. Furfural derivatives, which are derived from agricultural by-products, play a crucial role in the production of various chemicals and materials.
In the pharmaceutical sector, major companies typically allocate 15-20% of their revenues to research and development (R&D). Despite significant R&D investments, only about 12% of drug candidates that reach human testing are eventually approved. Notably, around 80% of pharmaceutical revenues come from approximately 100 blockbuster drugs, each generating over $1 billion in annual sales. This scenario underscores the critical need for cost-effective and efficient chemical intermediates like furfural derivatives in drug synthesis and production processes.
The agrochemical industry also significantly drives the demand for furfural derivatives. Global fertilizer consumption stands at around 200 million tons annually, with China, India, and the United States accounting for over 60% of global usage. Furfural derivatives are used in the manufacture of pesticides and plant growth regulators, which are essential for enhancing agricultural productivity and ensuring food security.
The environmentally friendly nature of furfural derivatives, derived from renewable resources, further bolsters their market appeal. As industries seek sustainable alternatives, furfural derivatives present a viable solution, aligning with global trends toward greener and more sustainable chemical processes.
Overall, the Furfural Derivatives Market is set to expand, driven by its critical applications in pharmaceuticals and agrochemicals. The substantial R&D investments in the pharmaceutical sector and the high consumption of agrochemicals underscore the growing importance of furfural derivatives in these industries. This trend is expected to continue, supporting the market's robust growth trajectory.
Key Takeaways
- Market Growth: The Global Furfural Derivatives Market is projected to witness substantial growth, with its value expected to reach approximately USD 28.9 Billion by 2033. This marks a significant increase from its value of USD 14.8 Billion in 2023, reflecting a robust CAGR of 7.1% during the forecast period spanning from 2024 to 2033.
- Dominant Derivative: Tetrahydrofurfuryl Alcohol (THFA) emerges as the dominant derivative, commanding a significant market share of 40%. Its versatility and high demand in pharmaceuticals and solvents drive its market dominance, supported by properties such as high solubility, low toxicity, and suitability for eco-friendly practices.
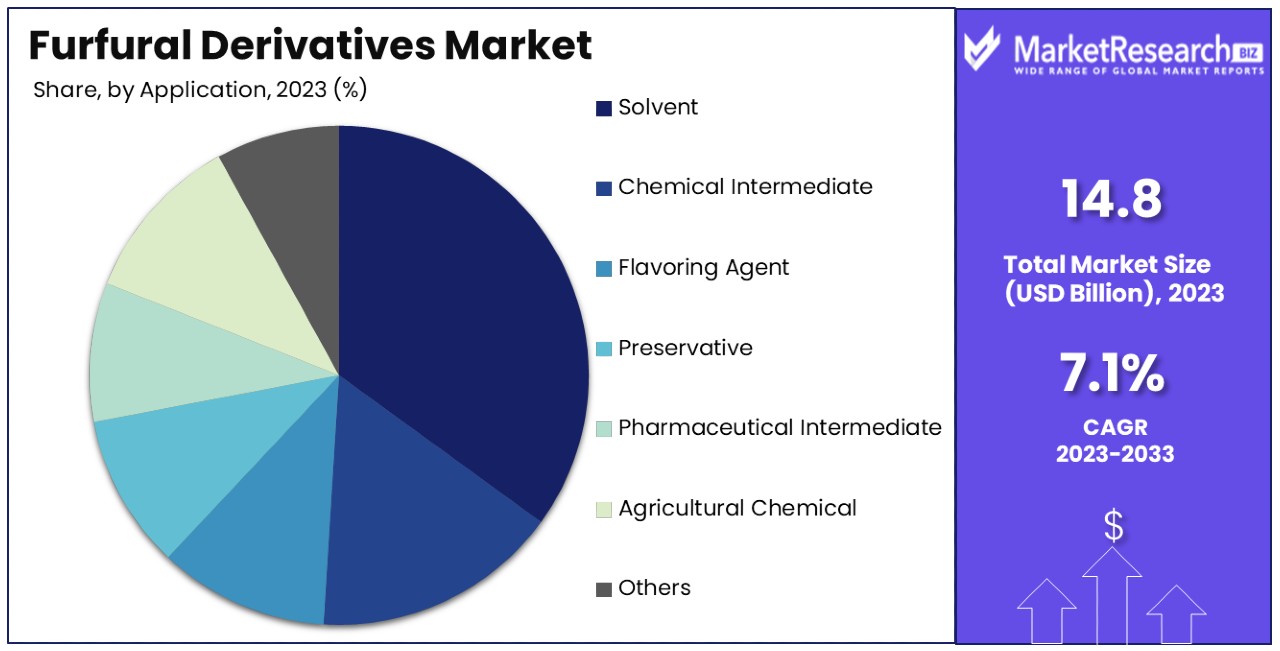
- Application Dominance: Solvent application dominates the market, holding a substantial market share of 35%. Furfural-based solvents, including THFA and 2-MTHF, are extensively utilized in industrial processes due to their efficiency and eco-friendly properties. The rising demand for bio-based and sustainable solvents further propels market growth.
- Regional Insights: Asia-Pacific (APAC) emerges as the dominant region, commanding 46.4% of the market share. North America follows with a 20% market share. These regions exhibit significant market presence, driven by factors such as industrialization, healthcare investments, and regulatory frameworks promoting eco-friendly practices.
- Analyst Viewpoint: Analysts anticipate substantial market growth driven by increasing demand for THFA in pharmaceuticals and solvents. With a focus on eco-friendly practices and diverse industrial applications, THFA is positioned as a key contributor to market expansion, reflecting the market's potential for innovation and sustainability.
Driving Factors
Rising Demand from the Pharmaceutical Industry Drives Market Growth
Furfural derivatives, particularly furfuryl alcohol and tetrahydrofurfuryl alcohol, are crucial intermediates in pharmaceutical manufacturing. The demand for these derivatives is growing in tandem with the increasing need for pharmaceuticals. Factors such as an aging global population, rising healthcare expenditures, and the ongoing development of new drug formulations are contributing to this trend. For example, furfuryl alcohol is a key component in the synthesis of the anti-anxiety medication Librium (chlordiazepoxide).
The global pharmaceutical market, valued at approximately USD 1.27 trillion in 2020, is projected to continue expanding, thereby bolstering the demand for furfural derivatives. Additionally, the increased focus on developing innovative drugs and therapies further amplifies the requirement for these intermediates. This synergy between pharmaceutical growth and furfural derivatives use underscores their importance in the market, driving sustained demand and market expansion.
Increasing Use in Agrochemicals and Pesticides Drives Market Growth
The furfural derivatives market is witnessing significant growth due to their expanding applications in agrochemicals and pesticides. The global population is expected to reach 9.7 billion by 2050, necessitating higher agricultural yields to ensure food security. Furfural derivatives, such as furfuryl alcohol, are utilized in synthesizing various herbicides and insecticides, which are essential for enhancing crop productivity.
The agrochemical market, valued at USD 235.2 billion in 2021, is growing at a robust pace, directly influencing the demand for furfural derivatives. As the agricultural sector adopts more advanced and efficient farming practices, the need for effective agrochemicals is intensifying. This, in turn, propels the furfural derivatives market, highlighting their critical role in supporting agricultural productivity and addressing global food demands.
Expanding Applications in Foundry and Refractory Industries Drive Market Growth
Furfural derivatives, especially furfuryl alcohol and furfural resins, are integral to the foundry and refractory industries. These derivatives are extensively used as binders and coatings in the production of sand molds for metal casting and in manufacturing high-temperature resistant materials. The global foundry market, which was valued at approximately USD 78 billion in 2020, is expected to grow due to the increasing demand for cast components across various industries, including automotive and aerospace.
Similarly, the refractory materials market, valued at USD 252.6 Bn in 2022, is projected to expand as industries seek materials that can withstand extreme conditions. The use of furfural derivatives in these applications ensures the production of high-quality, durable components, driving market growth. The synergy between these industries and the need for robust materials underscores the importance of furfural derivatives, fostering their market expansion.
Restraining Factors
Limited Availability of Raw Materials Restrains Market Growth
The production of furfural derivatives is highly dependent on raw materials like agricultural residues and biomass. Limited availability and fluctuating prices of these materials pose significant challenges. For instance, corn cobs, a common raw material for furfural production, are subject to variability due to weather conditions and crop yields.
When the supply of these materials is low, production costs rise, leading to increased prices for furfural derivatives. This instability can deter manufacturers from relying heavily on furfural derivatives, thereby restraining market growth. Additionally, competition for these raw materials from other industries further exacerbates supply issues, making it difficult to maintain consistent production levels and meet market demands.
Stringent Environmental Regulations Restrain Market Growth
Stringent environmental regulations present a significant challenge to the growth of the furfural derivatives market. The chemical processes involved in producing these derivatives generate waste and emissions, which must be managed to comply with environmental laws. Regions with strict environmental policies impose higher operational costs and stringent compliance requirements on manufacturers.
These increased costs can reduce profit margins and make it less attractive for companies to invest in furfural derivative production. For example, adhering to environmental regulations in the European Union can be particularly costly, affecting the market's expansion in this region. Consequently, manufacturers may seek alternatives with fewer regulatory burdens, limiting the growth potential of the furfural derivatives market.
Type of Derivative Analysis
Tetrahydrofurfuryl Alcohol dominates with 40% due to high demand in pharmaceuticals and solvents.
The Furfural Derivatives Market is categorized by the type of derivatives produced. Among these, Tetrahydrofurfuryl Alcohol (THFA) holds the dominant position. THFA is a versatile compound used primarily in pharmaceuticals and as an industrial solvent. Its demand is driven by its application in producing various pharmaceutical intermediates and fine chemicals. The pharmaceutical industry's growth, particularly with the increasing need for advanced medications and formulations, significantly boosts the demand for THFA. In 2022, THFA accounted for approximately 40% of the total furfural derivatives market, underscoring its critical role.
THFA's properties, such as high solubility and low toxicity, make it ideal for pharmaceutical applications. It is used in synthesizing numerous drug formulations, contributing to its dominant market share. Additionally, THFA's role as a solvent in various chemical reactions further cements its position. The growing emphasis on developing new pharmaceuticals and the increasing expenditure on healthcare globally enhance the demand for THFA. Furthermore, its use in producing environmentally friendly solvents aligns with the industry's shift towards sustainable and green chemistry practices, driving its market growth.
Other derivatives, such as Furfural Alcohol, Furfuryl Alcohol, 2-Methyltetrahydrofuran (2-MTHF), 5-Methylfurfural, and Furoic Acid, also play significant roles. Furfural Alcohol is used in resins and adhesives, contributing to its steady market presence. Furfuryl Alcohol is crucial in foundry resins and coatings, supporting its growth in industrial applications. 2-MTHF, a bio-based solvent, is gaining traction due to its eco-friendly properties. 5-Methylfurfural and Furoic Acid have niche applications in flavors, fragrances, and pharmaceuticals, driving their modest yet consistent demand. These segments collectively contribute to the overall growth of the furfural derivatives market by catering to diverse industrial needs.
Application Analysis
Solvent dominates with 35% due to its extensive use in industrial processes.
The Furfural Derivatives Market can also be segmented by application, where solvents are the dominant sub-segment. Solvents derived from furfural, such as THFA and 2-MTHF, are extensively used in various industrial processes. These solvents are preferred for their high efficiency and environmentally friendly properties. The market for solvents accounted for approximately 35% of the total furfural derivatives market in 2022, highlighting its significance.
The demand for bio-based and sustainable solvents is rising, driven by stringent environmental regulations and the industry's shift towards green chemistry. Furfural-based solvents meet these criteria, making them popular in the chemical and pharmaceutical industries. The increasing need for high-performance solvents in drug formulation and chemical synthesis further boosts their market share. Additionally, the growth of the paints and coatings industry, which utilizes these solvents for their superior properties, contributes to the market expansion.
Other applications, such as Chemical Intermediates, Flavoring Agents, Preservatives, Pharmaceutical Intermediates, and Agricultural Chemicals, also hold significant market shares. Chemical intermediates are essential in producing various chemicals, driving steady demand. Flavoring agents and preservatives derived from furfural derivatives find applications in the food and beverage industry, supporting market growth. Pharmaceutical intermediates continue to be a crucial segment, fueled by the pharmaceutical industry's expansion. Agricultural chemicals, including herbicides and pesticides, are in demand due to the need for increased agricultural productivity. These applications collectively drive the growth of the furfural derivatives market by catering to a wide range of industrial needs.
Key Market Segments
By Type of Derivative
- Tetrahydrofurfuryl Alcohol
- Furfural Alcohol
- Furfuryl Alcohol
- 2-Methyltetrahydrofuran (2-MTHF)
- 5-Methylfurfural
- Furoic Acid
- Others
By Application
- Solvent
- Chemical Intermediate
- Flavoring Agent
- Preservative
- Pharmaceutical Intermediate
- Agricultural Chemical
- Others
By End User Industry
- Petrochemical
- Chemical
- Pharmaceutical
- Food and Beverage
- Agriculture
- Others
Growth Opportunities
Development of Bio-refinery Processes Offers Growth Opportunity
The development of bio-refinery processes presents significant growth opportunities for the Furfural Derivatives Market. As interest in sustainable and renewable resources increases, bio-refineries utilize lignocellulosic biomass, such as agricultural residues and forestry waste, to produce furfural derivatives. These processes offer a cost-effective and environmentally friendly alternative to traditional petroleum-based methods.
Companies like Avantium and Corbion are leading the way with innovative technologies to produce furfural derivatives from non-food biomass sources. This shift towards bio-based production is expected to drive market growth. The global bio-refinery market, valued at USD 551.0 billion in 2020, highlights the potential for significant expansion in the furfural derivatives sector.
Expansion in Emerging Economies Offers Growth Opportunity
Emerging economies in Asia-Pacific and Latin America are key to the growth of the Furfural Derivatives Market. Rapid industrialization and urbanization in these regions increase the demand for furfural derivatives in various applications, such as construction materials, automotive components, and agrochemicals.
The abundance of biomass resources in these regions provides an opportunity to establish bio-based furfural derivative production facilities, catering to local and regional demand. Companies like Illovo Sugar and Tsb Sugar are exploring furfural derivative production from sugarcane bagasse in South Africa. This expansion in emerging markets, driven by both industrial growth and resource availability, offers significant opportunities for the furfural derivatives market.
Trending Factors
Sustainability and Environmental Concerns Are Trending Factors
Sustainability and environmental concerns are significant trending factors in the Furfural Derivatives Market. There is a growing trend towards sustainability and environmental consciousness across various industries. This has led to increased demand for bio-based and renewable products, including furfural derivatives derived from biomass sources.
Manufacturers are actively exploring ways to reduce their carbon footprint and adopt more sustainable production practices, driving the trend towards bio-based furfural derivatives. For instance, companies are investing in technologies to convert agricultural residues and forestry waste into valuable chemicals. This trend is supported by consumer preference for green products and regulatory pressures to minimize environmental impact, positioning bio-based furfural derivatives as a key component of sustainable industrial practices.
Circular Economy and Waste Valorization Are Trending Factors
The concept of a circular economy and waste valorization is a major trend driving the Furfural Derivatives Market. Furfural derivatives can be produced from various agricultural and industrial waste streams, such as corn cobs, sugarcane bagasse, and lignin residues from pulp and paper mills. This aligns with circular economy principles, where waste is reintroduced into the production cycle.
By leveraging these waste streams as raw materials, furfural derivative manufacturers contribute to waste valorization and sustainable production. This approach not only reduces waste but also provides a cost-effective and environmentally friendly method for producing valuable chemicals. The increasing focus on sustainability and efficient resource use further supports the growth of this trend, making furfural derivatives a vital part of circular economy initiatives.
Regional Analysis
APAC Dominates with 46.4% Market Share
The Asia-Pacific (APAC) region holds a 46.4% share of the Furfural Derivatives Market. This dominance is driven by the abundant availability of raw materials, such as corn cobs and sugarcane bagasse, essential for furfural production. The region's rapid industrialization and urbanization further bolster demand, particularly in countries like China and India. Additionally, supportive government policies promoting bio-based and sustainable products enhance market growth. The presence of key manufacturers in the region also contributes significantly to its market leadership.
Regional characteristics such as a robust agricultural sector and favorable climatic conditions ensure a steady supply of raw materials for furfural production. The strong industrial base in APAC, coupled with growing investments in research and development for sustainable products, supports the market's expansion. The cost-effective production processes and lower labor costs in the region further enhance its competitive edge.
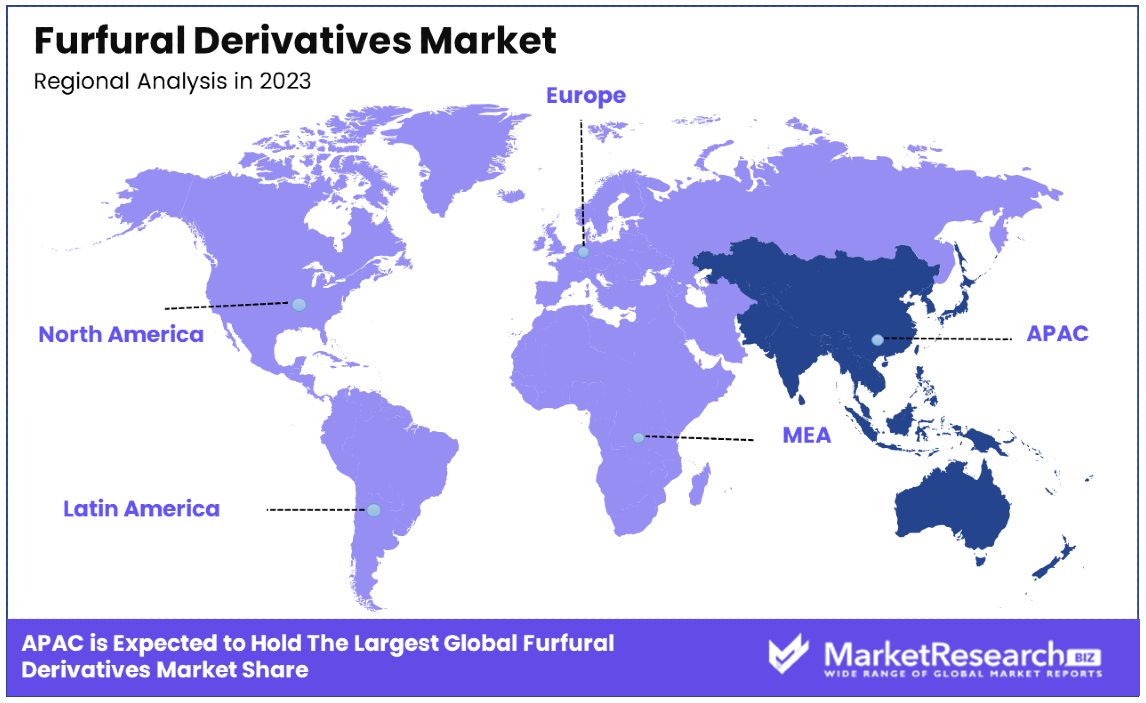
North America: 20% Market Share
North America holds a 20% share of the Furfural Derivatives Market. The region's market is driven by advanced technological capabilities and a strong focus on sustainable production. High demand from the pharmaceutical and agrochemical sectors also supports market growth. The presence of leading research institutions and strict environmental regulations encourage innovation in bio-based products.
Europe: 15% Market Share
Europe accounts for 15% of the Furfural Derivatives Market. The region's emphasis on sustainability and circular economy practices drives demand. Strong regulatory frameworks and government initiatives supporting green chemistry further enhance market growth. The increasing adoption of bio-based products in various industries, including pharmaceuticals and chemicals, contributes to Europe's market share.
Middle East & Africa: 10% Market Share
The Middle East & Africa region holds a 10% share of the Furfural Derivatives Market. The market is driven by growing industrialization and urbanization. The availability of agricultural residues and government support for sustainable practices contribute to market expansion. Increasing investments in industrial and chemical sectors also bolster market growth.
Latin America: 8.6% Market Share
Latin America accounts for 8.6% of the Furfural Derivatives Market. The region's market growth is supported by the availability of raw materials like sugarcane bagasse and corn cobs. Increasing demand for sustainable agricultural chemicals and industrial products drives market expansion. Government initiatives promoting bio-based products further enhance market growth.
Key Regions and Countries
- North America
- The US
- Canada
- Mexico
- Western Europe
- Germany
- France
- The UK
- Spain
- Italy
- Portugal
- Ireland
- Austria
- Switzerland
- Benelux
- Nordic
- Rest of Western Europe
- Eastern Europe
- Russia
- Poland
- The Czech Republic
- Greece
- Rest of Eastern Europe
- APAC
- China
- Japan
- South Korea
- India
- Australia & New Zealand
- Indonesia
- Malaysia
- Philippines
- Singapore
- Thailand
- Vietnam
- Rest of APAC
- Latin America
- Brazil
- Colombia
- Chile
- Argentina
- Costa Rica
- Rest of Latin America
- Middle East & Africa
- Algeria
- Egypt
- Israel
- Kuwait
- Nigeria
- Saudi Arabia
- South Africa
- Turkey
- United Arab Emirates
- Rest of MEA
Key Players Analysis
In the burgeoning Furfural Derivatives Market, a variety of players have strategically positioned themselves, leveraging their unique strengths and market reach to influence this niche yet expanding industry. The market is characterized by its diverse applications ranging from pharmaceuticals to industrial solvents and biofuels, driving innovation and sustainability.
Leading the innovation front are companies like Avantium N.V. and Lenzing AG, which focus on transforming furfural into bio-based chemicals and fibers, respectively. These companies are at the forefront of sustainable practices, using renewable resources to create environmentally friendly products that cater to the growing demand for green materials.
Central Romana Corporation, Illovo Sugar Africa, and Sugar Australia Pty Ltd represent key players with vertical integration strategies, utilizing their sugar production capabilities to manufacture furfural and its derivatives. This not only enhances their production efficiency but also stabilizes supply chains, giving them a competitive edge in regions with high biomass availability.
Specialized chemical producers like Pennakem LLC and Tieling North Furfural Group focus on high-purity furfural derivatives, essential for applications in fragrances, pharmaceuticals, and fine chemicals. Their technological expertise in handling complex chemical processes distinguishes them within the market.
On the application development side, companies such as Silvateam S.p.A. and Tanin Sevnica d.d. are pivotal. They leverage their expertise in using furfural derivatives for tanning agents and other industrial applications, driving sector-specific advancements.
Furthermore, smaller niche players like Nutrafur S.A., Transfurans Chemicals BVBA, and International Furan Chemicals (IFC) contribute to the market dynamics by focusing on specialized segments, including food additives and health supplements, which are gaining traction due to consumer health consciousness.
Collectively, these companies' strategic initiatives—ranging from sustainable sourcing and vertical integration to specialized applications—underscore the dynamic nature of the furfural derivatives market, highlighting the potential for growth and innovation in response to global sustainability trends.
Market Key Players
- Avantium N.V.
- Hongye Chemical Group Corporation Ltd.
- Central Romana Corporation
- Pennakem LLC
- Illovo Sugar Africa (Pty) Ltd.
- Lenzing AG
- Tanin Sevnica d.d.
- Silvateam S.p.A.
- KRBL Limited
- Tieling North Furfural (Group) Co., Ltd.
- Nutrafur S.A.
- Transfurans Chemicals BVBA
- International Furan Chemicals (IFC)
- Hebei Zehao Biotechnology Co., Ltd.
- Sugar Australia Pty Ltd.
Recent Developments
- On May 2024, a study published in Green Chemistry reported a breakthrough in the detection of furfural in fertilizers. The researchers developed a novel method for furfural detection using a case study approach.
- On May 2024, Cotecna, a leading inspection, verification, testing, and certification company, announced the development of a new method for furfural detection in fertilizers. The case study showcases the company's expertise in analytical methods and its commitment to ensuring the quality and safety of agricultural products.
Report Scope
Report Features Description Market Value (2023) USD 14.8 Billion Forecast Revenue (2033) USD 28.9 Billion CAGR (2024-2033) 7.1% Base Year for Estimation 2023 Historic Period 2018-2023 Forecast Period 2024-2033 Report Coverage Revenue Forecast, Market Dynamics, Competitive Landscape, Recent Developments Segments Covered By Type of Derivative (Tetrahydrofurfuryl Alcohol, Furfural Alcohol, Furfuryl Alcohol, 2-Methyltetrahydrofuran (2-MTHF), 5-Methylfurfural, Furoic Acid, Others), By Application (Solvent, Chemical Intermediate, Flavoring Agent, Preservative, Pharmaceutical Intermediate, Agricultural Chemical, Others), By End User Industry (Petrochemical, Chemical, Pharmaceutical, Food and Beverage, Agriculture, Others) Regional Analysis North America - The US, Canada, & Mexico; Western Europe - Germany, France, The UK, Spain, Italy, Portugal, Ireland, Austria, Switzerland, Benelux, Nordic, & Rest of Western Europe; Eastern Europe - Russia, Poland, The Czech Republic, Greece, & Rest of Eastern Europe; APAC - China, Japan, South Korea, India, Australia & New Zealand, Indonesia, Malaysia, Philippines, Singapore, Thailand, Vietnam, & Rest of APAC; Latin America - Brazil, Colombia, Chile, Argentina, Costa Rica, & Rest of Latin America; Middle East & Africa - Algeria, Egypt, Israel, Kuwait, Nigeria, Saudi Arabia, South Africa, Turkey, United Arab Emirates, & Rest of MEA Competitive Landscape Avantium N.V., Hongye Chemical Group Corporation Ltd., Central Romana Corporation, Pennakem LLC, Illovo Sugar Africa (Pty) Ltd., Lenzing AG, Tanin Sevnica d.d., Silvateam S.p.A., KRBL Limited, Tieling North Furfural (Group) Co., Ltd., Nutrafur S.A., Transfurans Chemicals BVBA, International Furan Chemicals (IFC), Hebei Zehao Biotechnology Co., Ltd., Sugar Australia Pty Ltd. Customization Scope Customization for segments, region/country-level will be provided. Moreover, additional customization can be done based on the requirements. Purchase Options We have three licenses to opt for: Single User License, Multi-User License (Up to 5 Users), Corporate Use License (Unlimited User and Printable PDF) -
- 1. Executive Summary
- 1.1. Definition
- 1.2. Taxonomy
- 1.3. Research Scope
- 1.4. Key Analysis
- 1.5. Key Findings by Major Segments
- 1.6. Top strategies by Major Players
- 2. Global Furfural Derivatives Market Overview
- 2.1. Furfural Derivatives Market Dynamics
- 2.1.1. Drivers
- 2.1.2. Opportunities
- 2.1.3. Restraints
- 2.1.4. Challenges
- 2.2. Macro-economic Factors
- 2.3. Regulatory Framework
- 2.4. Market Investment Feasibility Index
- 2.5. PEST Analysis
- 2.6. PORTER’S Five Force Analysis
- 2.7. Drivers & Restraints Impact Analysis
- 2.8. Industry Chain Analysis
- 2.9. Cost Structure Analysis
- 2.10. Marketing Strategy
- 2.11. Russia-Ukraine War Impact Analysis
- 2.12. Opportunity Map Analysis
- 2.13. Market Competition Scenario Analysis
- 2.14. Product Life Cycle Analysis
- 2.15. Opportunity Orbits
- 2.16. Manufacturer Intensity Map
- 2.17. Major Companies sales by Value & Volume
- 2.1. Furfural Derivatives Market Dynamics
- 3. Global Furfural Derivatives Market Analysis, Opportunity and Forecast, 2016-2032
- 3.1. Global Furfural Derivatives Market Analysis, 2016-2021
- 3.2. Global Furfural Derivatives Market Opportunity and Forecast, 2023-2032
- 3.3. Global Furfural Derivatives Market Analysis, Opportunity and Forecast, By Type of Derivative, 2016-2032
- 3.3.1. Global Furfural Derivatives Market Analysis by Type of Derivative: Introduction
- 3.3.2. Market Size Absolute $ Opportunity Analysis and Forecast, By Type of Derivative, 2016-2032
- 3.3.3. Tetrahydrofurfuryl Alcohol
- 3.3.4. Furfural Alcohol
- 3.3.5. Furfuryl Alcohol
- 3.3.6. 2-Methyltetrahydrofuran (2-MTHF)
- 3.3.7. 5-Methylfurfural
- 3.3.8. Furoic Acid
- 3.3.9. Others
- 3.4. Global Furfural Derivatives Market Analysis, Opportunity and Forecast, By Application, 2016-2032
- 3.4.1. Global Furfural Derivatives Market Analysis by Application: Introduction
- 3.4.2. Market Size Absolute $ Opportunity Analysis and Forecast, By Application, 2016-2032
- 3.4.3. Solvent
- 3.4.4. Chemical Intermediate
- 3.4.5. Flavoring Agent
- 3.4.6. Preservative
- 3.4.7. Pharmaceutical Intermediate
- 3.4.8. Agricultural Chemical
- 3.4.9. Others
- 3.5. Global Furfural Derivatives Market Analysis, Opportunity and Forecast, By End User Industry, 2016-2032
- 3.5.1. Global Furfural Derivatives Market Analysis by End User Industry: Introduction
- 3.5.2. Market Size Absolute $ Opportunity Analysis and Forecast, By End User Industry, 2016-2032
- 3.5.3. Petrochemical
- 3.5.4. Chemical
- 3.5.5. Pharmaceutical
- 3.5.6. Food and Beverage
- 3.5.7. Agriculture
- 3.5.8. Others
- 4. North America Furfural Derivatives Market Analysis, Opportunity and Forecast, 2016-2032
- 4.1. North America Furfural Derivatives Market Analysis, 2016-2021
- 4.2. North America Furfural Derivatives Market Opportunity and Forecast, 2023-2032
- 4.3. North America Furfural Derivatives Market Analysis, Opportunity and Forecast, By Type of Derivative, 2016-2032
- 4.3.1. North America Furfural Derivatives Market Analysis by Type of Derivative: Introduction
- 4.3.2. Market Size Absolute $ Opportunity Analysis and Forecast, By Type of Derivative, 2016-2032
- 4.3.3. Tetrahydrofurfuryl Alcohol
- 4.3.4. Furfural Alcohol
- 4.3.5. Furfuryl Alcohol
- 4.3.6. 2-Methyltetrahydrofuran (2-MTHF)
- 4.3.7. 5-Methylfurfural
- 4.3.8. Furoic Acid
- 4.3.9. Others
- 4.4. North America Furfural Derivatives Market Analysis, Opportunity and Forecast, By Application, 2016-2032
- 4.4.1. North America Furfural Derivatives Market Analysis by Application: Introduction
- 4.4.2. Market Size Absolute $ Opportunity Analysis and Forecast, By Application, 2016-2032
- 4.4.3. Solvent
- 4.4.4. Chemical Intermediate
- 4.4.5. Flavoring Agent
- 4.4.6. Preservative
- 4.4.7. Pharmaceutical Intermediate
- 4.4.8. Agricultural Chemical
- 4.4.9. Others
- 4.5. North America Furfural Derivatives Market Analysis, Opportunity and Forecast, By End User Industry, 2016-2032
- 4.5.1. North America Furfural Derivatives Market Analysis by End User Industry: Introduction
- 4.5.2. Market Size Absolute $ Opportunity Analysis and Forecast, By End User Industry, 2016-2032
- 4.5.3. Petrochemical
- 4.5.4. Chemical
- 4.5.5. Pharmaceutical
- 4.5.6. Food and Beverage
- 4.5.7. Agriculture
- 4.5.8. Others
- 4.6. North America Furfural Derivatives Market Analysis, Opportunity and Forecast, By Country , 2016-2032
- 4.6.1. North America Furfural Derivatives Market Analysis by Country : Introduction
- 4.6.2. Market Size Absolute $ Opportunity Analysis and Forecast, Country , 2016-2032
- 4.6.2.1. The US
- 4.6.2.2. Canada
- 4.6.2.3. Mexico
- 5. Western Europe Furfural Derivatives Market Analysis, Opportunity and Forecast, 2016-2032
- 5.1. Western Europe Furfural Derivatives Market Analysis, 2016-2021
- 5.2. Western Europe Furfural Derivatives Market Opportunity and Forecast, 2023-2032
- 5.3. Western Europe Furfural Derivatives Market Analysis, Opportunity and Forecast, By Type of Derivative, 2016-2032
- 5.3.1. Western Europe Furfural Derivatives Market Analysis by Type of Derivative: Introduction
- 5.3.2. Market Size Absolute $ Opportunity Analysis and Forecast, By Type of Derivative, 2016-2032
- 5.3.3. Tetrahydrofurfuryl Alcohol
- 5.3.4. Furfural Alcohol
- 5.3.5. Furfuryl Alcohol
- 5.3.6. 2-Methyltetrahydrofuran (2-MTHF)
- 5.3.7. 5-Methylfurfural
- 5.3.8. Furoic Acid
- 5.3.9. Others
- 5.4. Western Europe Furfural Derivatives Market Analysis, Opportunity and Forecast, By Application, 2016-2032
- 5.4.1. Western Europe Furfural Derivatives Market Analysis by Application: Introduction
- 5.4.2. Market Size Absolute $ Opportunity Analysis and Forecast, By Application, 2016-2032
- 5.4.3. Solvent
- 5.4.4. Chemical Intermediate
- 5.4.5. Flavoring Agent
- 5.4.6. Preservative
- 5.4.7. Pharmaceutical Intermediate
- 5.4.8. Agricultural Chemical
- 5.4.9. Others
- 5.5. Western Europe Furfural Derivatives Market Analysis, Opportunity and Forecast, By End User Industry, 2016-2032
- 5.5.1. Western Europe Furfural Derivatives Market Analysis by End User Industry: Introduction
- 5.5.2. Market Size Absolute $ Opportunity Analysis and Forecast, By End User Industry, 2016-2032
- 5.5.3. Petrochemical
- 5.5.4. Chemical
- 5.5.5. Pharmaceutical
- 5.5.6. Food and Beverage
- 5.5.7. Agriculture
- 5.5.8. Others
- 5.6. Western Europe Furfural Derivatives Market Analysis, Opportunity and Forecast, By Country , 2016-2032
- 5.6.1. Western Europe Furfural Derivatives Market Analysis by Country : Introduction
- 5.6.2. Market Size Absolute $ Opportunity Analysis and Forecast, Country , 2016-2032
- 5.6.2.1. Germany
- 5.6.2.2. France
- 5.6.2.3. The UK
- 5.6.2.4. Spain
- 5.6.2.5. Italy
- 5.6.2.6. Portugal
- 5.6.2.7. Ireland
- 5.6.2.8. Austria
- 5.6.2.9. Switzerland
- 5.6.2.10. Benelux
- 5.6.2.11. Nordic
- 5.6.2.12. Rest of Western Europe
- 6. Eastern Europe Furfural Derivatives Market Analysis, Opportunity and Forecast, 2016-2032
- 6.1. Eastern Europe Furfural Derivatives Market Analysis, 2016-2021
- 6.2. Eastern Europe Furfural Derivatives Market Opportunity and Forecast, 2023-2032
- 6.3. Eastern Europe Furfural Derivatives Market Analysis, Opportunity and Forecast, By Type of Derivative, 2016-2032
- 6.3.1. Eastern Europe Furfural Derivatives Market Analysis by Type of Derivative: Introduction
- 6.3.2. Market Size Absolute $ Opportunity Analysis and Forecast, By Type of Derivative, 2016-2032
- 6.3.3. Tetrahydrofurfuryl Alcohol
- 6.3.4. Furfural Alcohol
- 6.3.5. Furfuryl Alcohol
- 6.3.6. 2-Methyltetrahydrofuran (2-MTHF)
- 6.3.7. 5-Methylfurfural
- 6.3.8. Furoic Acid
- 6.3.9. Others
- 6.4. Eastern Europe Furfural Derivatives Market Analysis, Opportunity and Forecast, By Application, 2016-2032
- 6.4.1. Eastern Europe Furfural Derivatives Market Analysis by Application: Introduction
- 6.4.2. Market Size Absolute $ Opportunity Analysis and Forecast, By Application, 2016-2032
- 6.4.3. Solvent
- 6.4.4. Chemical Intermediate
- 6.4.5. Flavoring Agent
- 6.4.6. Preservative
- 6.4.7. Pharmaceutical Intermediate
- 6.4.8. Agricultural Chemical
- 6.4.9. Others
- 6.5. Eastern Europe Furfural Derivatives Market Analysis, Opportunity and Forecast, By End User Industry, 2016-2032
- 6.5.1. Eastern Europe Furfural Derivatives Market Analysis by End User Industry: Introduction
- 6.5.2. Market Size Absolute $ Opportunity Analysis and Forecast, By End User Industry, 2016-2032
- 6.5.3. Petrochemical
- 6.5.4. Chemical
- 6.5.5. Pharmaceutical
- 6.5.6. Food and Beverage
- 6.5.7. Agriculture
- 6.5.8. Others
- 6.6. Eastern Europe Furfural Derivatives Market Analysis, Opportunity and Forecast, By Country , 2016-2032
- 6.6.1. Eastern Europe Furfural Derivatives Market Analysis by Country : Introduction
- 6.6.2. Market Size Absolute $ Opportunity Analysis and Forecast, Country , 2016-2032
- 6.6.2.1. Russia
- 6.6.2.2. Poland
- 6.6.2.3. The Czech Republic
- 6.6.2.4. Greece
- 6.6.2.5. Rest of Eastern Europe
- 7. APAC Furfural Derivatives Market Analysis, Opportunity and Forecast, 2016-2032
- 7.1. APAC Furfural Derivatives Market Analysis, 2016-2021
- 7.2. APAC Furfural Derivatives Market Opportunity and Forecast, 2023-2032
- 7.3. APAC Furfural Derivatives Market Analysis, Opportunity and Forecast, By Type of Derivative, 2016-2032
- 7.3.1. APAC Furfural Derivatives Market Analysis by Type of Derivative: Introduction
- 7.3.2. Market Size Absolute $ Opportunity Analysis and Forecast, By Type of Derivative, 2016-2032
- 7.3.3. Tetrahydrofurfuryl Alcohol
- 7.3.4. Furfural Alcohol
- 7.3.5. Furfuryl Alcohol
- 7.3.6. 2-Methyltetrahydrofuran (2-MTHF)
- 7.3.7. 5-Methylfurfural
- 7.3.8. Furoic Acid
- 7.3.9. Others
- 7.4. APAC Furfural Derivatives Market Analysis, Opportunity and Forecast, By Application, 2016-2032
- 7.4.1. APAC Furfural Derivatives Market Analysis by Application: Introduction
- 7.4.2. Market Size Absolute $ Opportunity Analysis and Forecast, By Application, 2016-2032
- 7.4.3. Solvent
- 7.4.4. Chemical Intermediate
- 7.4.5. Flavoring Agent
- 7.4.6. Preservative
- 7.4.7. Pharmaceutical Intermediate
- 7.4.8. Agricultural Chemical
- 7.4.9. Others
- 7.5. APAC Furfural Derivatives Market Analysis, Opportunity and Forecast, By End User Industry, 2016-2032
- 7.5.1. APAC Furfural Derivatives Market Analysis by End User Industry: Introduction
- 7.5.2. Market Size Absolute $ Opportunity Analysis and Forecast, By End User Industry, 2016-2032
- 7.5.3. Petrochemical
- 7.5.4. Chemical
- 7.5.5. Pharmaceutical
- 7.5.6. Food and Beverage
- 7.5.7. Agriculture
- 7.5.8. Others
- 7.6. APAC Furfural Derivatives Market Analysis, Opportunity and Forecast, By Country , 2016-2032
- 7.6.1. APAC Furfural Derivatives Market Analysis by Country : Introduction
- 7.6.2. Market Size Absolute $ Opportunity Analysis and Forecast, Country , 2016-2032
- 7.6.2.1. China
- 7.6.2.2. Japan
- 7.6.2.3. South Korea
- 7.6.2.4. India
- 7.6.2.5. Australia & New Zeland
- 7.6.2.6. Indonesia
- 7.6.2.7. Malaysia
- 7.6.2.8. Philippines
- 7.6.2.9. Singapore
- 7.6.2.10. Thailand
- 7.6.2.11. Vietnam
- 7.6.2.12. Rest of APAC
- 8. Latin America Furfural Derivatives Market Analysis, Opportunity and Forecast, 2016-2032
- 8.1. Latin America Furfural Derivatives Market Analysis, 2016-2021
- 8.2. Latin America Furfural Derivatives Market Opportunity and Forecast, 2023-2032
- 8.3. Latin America Furfural Derivatives Market Analysis, Opportunity and Forecast, By Type of Derivative, 2016-2032
- 8.3.1. Latin America Furfural Derivatives Market Analysis by Type of Derivative: Introduction
- 8.3.2. Market Size Absolute $ Opportunity Analysis and Forecast, By Type of Derivative, 2016-2032
- 8.3.3. Tetrahydrofurfuryl Alcohol
- 8.3.4. Furfural Alcohol
- 8.3.5. Furfuryl Alcohol
- 8.3.6. 2-Methyltetrahydrofuran (2-MTHF)
- 8.3.7. 5-Methylfurfural
- 8.3.8. Furoic Acid
- 8.3.9. Others
- 8.4. Latin America Furfural Derivatives Market Analysis, Opportunity and Forecast, By Application, 2016-2032
- 8.4.1. Latin America Furfural Derivatives Market Analysis by Application: Introduction
- 8.4.2. Market Size Absolute $ Opportunity Analysis and Forecast, By Application, 2016-2032
- 8.4.3. Solvent
- 8.4.4. Chemical Intermediate
- 8.4.5. Flavoring Agent
- 8.4.6. Preservative
- 8.4.7. Pharmaceutical Intermediate
- 8.4.8. Agricultural Chemical
- 8.4.9. Others
- 8.5. Latin America Furfural Derivatives Market Analysis, Opportunity and Forecast, By End User Industry, 2016-2032
- 8.5.1. Latin America Furfural Derivatives Market Analysis by End User Industry: Introduction
- 8.5.2. Market Size Absolute $ Opportunity Analysis and Forecast, By End User Industry, 2016-2032
- 8.5.3. Petrochemical
- 8.5.4. Chemical
- 8.5.5. Pharmaceutical
- 8.5.6. Food and Beverage
- 8.5.7. Agriculture
- 8.5.8. Others
- 8.6. Latin America Furfural Derivatives Market Analysis, Opportunity and Forecast, By Country , 2016-2032
- 8.6.1. Latin America Furfural Derivatives Market Analysis by Country : Introduction
- 8.6.2. Market Size Absolute $ Opportunity Analysis and Forecast, Country , 2016-2032
- 8.6.2.1. Brazil
- 8.6.2.2. Colombia
- 8.6.2.3. Chile
- 8.6.2.4. Argentina
- 8.6.2.5. Costa Rica
- 8.6.2.6. Rest of Latin America
- 9. Middle East & Africa Furfural Derivatives Market Analysis, Opportunity and Forecast, 2016-2032
- 9.1. Middle East & Africa Furfural Derivatives Market Analysis, 2016-2021
- 9.2. Middle East & Africa Furfural Derivatives Market Opportunity and Forecast, 2023-2032
- 9.3. Middle East & Africa Furfural Derivatives Market Analysis, Opportunity and Forecast, By Type of Derivative, 2016-2032
- 9.3.1. Middle East & Africa Furfural Derivatives Market Analysis by Type of Derivative: Introduction
- 9.3.2. Market Size Absolute $ Opportunity Analysis and Forecast, By Type of Derivative, 2016-2032
- 9.3.3. Tetrahydrofurfuryl Alcohol
- 9.3.4. Furfural Alcohol
- 9.3.5. Furfuryl Alcohol
- 9.3.6. 2-Methyltetrahydrofuran (2-MTHF)
- 9.3.7. 5-Methylfurfural
- 9.3.8. Furoic Acid
- 9.3.9. Others
- 9.4. Middle East & Africa Furfural Derivatives Market Analysis, Opportunity and Forecast, By Application, 2016-2032
- 9.4.1. Middle East & Africa Furfural Derivatives Market Analysis by Application: Introduction
- 9.4.2. Market Size Absolute $ Opportunity Analysis and Forecast, By Application, 2016-2032
- 9.4.3. Solvent
- 9.4.4. Chemical Intermediate
- 9.4.5. Flavoring Agent
- 9.4.6. Preservative
- 9.4.7. Pharmaceutical Intermediate
- 9.4.8. Agricultural Chemical
- 9.4.9. Others
- 9.5. Middle East & Africa Furfural Derivatives Market Analysis, Opportunity and Forecast, By End User Industry, 2016-2032
- 9.5.1. Middle East & Africa Furfural Derivatives Market Analysis by End User Industry: Introduction
- 9.5.2. Market Size Absolute $ Opportunity Analysis and Forecast, By End User Industry, 2016-2032
- 9.5.3. Petrochemical
- 9.5.4. Chemical
- 9.5.5. Pharmaceutical
- 9.5.6. Food and Beverage
- 9.5.7. Agriculture
- 9.5.8. Others
- 9.6. Middle East & Africa Furfural Derivatives Market Analysis, Opportunity and Forecast, By Country , 2016-2032
- 9.6.1. Middle East & Africa Furfural Derivatives Market Analysis by Country : Introduction
- 9.6.2. Market Size Absolute $ Opportunity Analysis and Forecast, Country , 2016-2032
- 9.6.2.1. Algeria
- 9.6.2.2. Egypt
- 9.6.2.3. Israel
- 9.6.2.4. Kuwait
- 9.6.2.5. Nigeria
- 9.6.2.6. Saudi Arabia
- 9.6.2.7. South Africa
- 9.6.2.8. Turkey
- 9.6.2.9. The UAE
- 9.6.2.10. Rest of MEA
- 10. Global Furfural Derivatives Market Analysis, Opportunity and Forecast, By Region , 2016-2032
- 10.1. Global Furfural Derivatives Market Analysis by Region : Introduction
- 10.2. Market Size Absolute $ Opportunity Analysis and Forecast, By Region , 2016-2032
- 10.2.1. North America
- 10.2.2. Western Europe
- 10.2.3. Eastern Europe
- 10.2.4. APAC
- 10.2.5. Latin America
- 10.2.6. Middle East & Africa
- 11. Global Furfural Derivatives Market Competitive Landscape, Market Share Analysis, and Company Profiles
- 11.1. Market Share Analysis
- 11.2. Company Profiles
- 11.3. Avantium N.V.
- 11.3.1. Company Overview
- 11.3.2. Financial Highlights
- 11.3.3. Product Portfolio
- 11.3.4. SWOT Analysis
- 11.3.5. Key Strategies and Developments
- 11.4. Hongye Chemical Group Corporation Ltd.
- 11.4.1. Company Overview
- 11.4.2. Financial Highlights
- 11.4.3. Product Portfolio
- 11.4.4. SWOT Analysis
- 11.4.5. Key Strategies and Developments
- 11.5. Central Romana Corporation
- 11.5.1. Company Overview
- 11.5.2. Financial Highlights
- 11.5.3. Product Portfolio
- 11.5.4. SWOT Analysis
- 11.5.5. Key Strategies and Developments
- 11.6. Pennakem LLC
- 11.6.1. Company Overview
- 11.6.2. Financial Highlights
- 11.6.3. Product Portfolio
- 11.6.4. SWOT Analysis
- 11.6.5. Key Strategies and Developments
- 11.7. Illovo Sugar Africa (Pty) Ltd.
- 11.7.1. Company Overview
- 11.7.2. Financial Highlights
- 11.7.3. Product Portfolio
- 11.7.4. SWOT Analysis
- 11.7.5. Key Strategies and Developments
- 11.8. Lenzing AG
- 11.8.1. Company Overview
- 11.8.2. Financial Highlights
- 11.8.3. Product Portfolio
- 11.8.4. SWOT Analysis
- 11.8.5. Key Strategies and Developments
- 11.9. Tanin Sevnica d.d.
- 11.9.1. Company Overview
- 11.9.2. Financial Highlights
- 11.9.3. Product Portfolio
- 11.9.4. SWOT Analysis
- 11.9.5. Key Strategies and Developments
- 11.10. Silvateam S.p.A.
- 11.10.1. Company Overview
- 11.10.2. Financial Highlights
- 11.10.3. Product Portfolio
- 11.10.4. SWOT Analysis
- 11.10.5. Key Strategies and Developments
- 11.11. KRBL Limited
- 11.11.1. Company Overview
- 11.11.2. Financial Highlights
- 11.11.3. Product Portfolio
- 11.11.4. SWOT Analysis
- 11.11.5. Key Strategies and Developments
- 11.12. Tieling North Furfural (Group) Co., Ltd.
- 11.12.1. Company Overview
- 11.12.2. Financial Highlights
- 11.12.3. Product Portfolio
- 11.12.4. SWOT Analysis
- 11.12.5. Key Strategies and Developments
- 11.13.1. Company Overview
- 11.13.2. Financial Highlights
- 11.13.3. Product Portfolio
- 11.13.4. SWOT Analysis
- 11.13.5. Key Strategies and Developments
- 11.14. Nutrafur S.A.
- 11.14.1. Company Overview
- 11.14.2. Financial Highlights
- 11.14.3. Product Portfolio
- 11.14.4. SWOT Analysis
- 11.14.5. Key Strategies and Developments
- 11.15. International Furan Chemicals (IFC)
- 11.15.1. Company Overview
- 11.15.2. Financial Highlights
- 11.15.3. Product Portfolio
- 11.15.4. SWOT Analysis
- 11.15.5. Key Strategies and Developments
- 11.16. Hebei Zehao Biotechnology Co., Ltd.
- 11.16.1. Company Overview
- 11.16.2. Financial Highlights
- 11.16.3. Product Portfolio
- 11.16.4. SWOT Analysis
- 11.16.5. Key Strategies and Developments
- 11.17. Sugar Australia Pty Ltd.
- 11.17.1. Company Overview
- 11.17.2. Financial Highlights
- 11.17.3. Product Portfolio
- 11.17.4. SWOT Analysis
- 11.17.5. Key Strategies and Developments
- 12. Assumptions and Acronyms
- 13. Research Methodology
- 14. Contact
- List of Figures
- Figure 1: Global Furfural Derivatives Market Revenue (US$ Mn) Market Share by Type of Derivative in 2022
- Figure 2: Global Furfural Derivatives Market Attractiveness Analysis by Type of Derivative, 2016-2032
- Figure 3: Global Furfural Derivatives Market Revenue (US$ Mn) Market Share by Applicationin 2022
- Figure 4: Global Furfural Derivatives Market Attractiveness Analysis by Application, 2016-2032
- Figure 5: Global Furfural Derivatives Market Revenue (US$ Mn) Market Share by End User Industryin 2022
- Figure 6: Global Furfural Derivatives Market Attractiveness Analysis by End User Industry, 2016-2032
- Figure 7: Global Furfural Derivatives Market Revenue (US$ Mn) Market Share by Region in 2022
- Figure 8: Global Furfural Derivatives Market Attractiveness Analysis by Region, 2016-2032
- Figure 9: Global Furfural Derivatives Market Revenue (US$ Mn) (2016-2032)
- Figure 10: Global Furfural Derivatives Market Revenue (US$ Mn) Comparison by Region (2016-2032)
- Figure 11: Global Furfural Derivatives Market Revenue (US$ Mn) Comparison by Type of Derivative (2016-2032)
- Figure 12: Global Furfural Derivatives Market Revenue (US$ Mn) Comparison by Application (2016-2032)
- Figure 13: Global Furfural Derivatives Market Revenue (US$ Mn) Comparison by End User Industry (2016-2032)
- Figure 14: Global Furfural Derivatives Market Y-o-Y Growth Rate Comparison by Region (2016-2032)
- Figure 15: Global Furfural Derivatives Market Y-o-Y Growth Rate Comparison by Type of Derivative (2016-2032)
- Figure 16: Global Furfural Derivatives Market Y-o-Y Growth Rate Comparison by Application (2016-2032)
- Figure 17: Global Furfural Derivatives Market Y-o-Y Growth Rate Comparison by End User Industry (2016-2032)
- Figure 18: Global Furfural Derivatives Market Share Comparison by Region (2016-2032)
- Figure 19: Global Furfural Derivatives Market Share Comparison by Type of Derivative (2016-2032)
- Figure 20: Global Furfural Derivatives Market Share Comparison by Application (2016-2032)
- Figure 21: Global Furfural Derivatives Market Share Comparison by End User Industry (2016-2032)
- Figure 22: North America Furfural Derivatives Market Revenue (US$ Mn) Market Share by Type of Derivativein 2022
- Figure 23: North America Furfural Derivatives Market Attractiveness Analysis by Type of Derivative, 2016-2032
- Figure 24: North America Furfural Derivatives Market Revenue (US$ Mn) Market Share by Applicationin 2022
- Figure 25: North America Furfural Derivatives Market Attractiveness Analysis by Application, 2016-2032
- Figure 26: North America Furfural Derivatives Market Revenue (US$ Mn) Market Share by End User Industryin 2022
- Figure 27: North America Furfural Derivatives Market Attractiveness Analysis by End User Industry, 2016-2032
- Figure 28: North America Furfural Derivatives Market Revenue (US$ Mn) Market Share by Country in 2022
- Figure 29: North America Furfural Derivatives Market Attractiveness Analysis by Country, 2016-2032
- Figure 30: North America Furfural Derivatives Market Revenue (US$ Mn) (2016-2032)
- Figure 31: North America Furfural Derivatives Market Revenue (US$ Mn) Comparison by Country (2016-2032)
- Figure 32: North America Furfural Derivatives Market Revenue (US$ Mn) Comparison by Type of Derivative (2016-2032)
- Figure 33: North America Furfural Derivatives Market Revenue (US$ Mn) Comparison by Application (2016-2032)
- Figure 34: North America Furfural Derivatives Market Revenue (US$ Mn) Comparison by End User Industry (2016-2032)
- Figure 35: North America Furfural Derivatives Market Y-o-Y Growth Rate Comparison by Country (2016-2032)
- Figure 36: North America Furfural Derivatives Market Y-o-Y Growth Rate Comparison by Type of Derivative (2016-2032)
- Figure 37: North America Furfural Derivatives Market Y-o-Y Growth Rate Comparison by Application (2016-2032)
- Figure 38: North America Furfural Derivatives Market Y-o-Y Growth Rate Comparison by End User Industry (2016-2032)
- Figure 39: North America Furfural Derivatives Market Share Comparison by Country (2016-2032)
- Figure 40: North America Furfural Derivatives Market Share Comparison by Type of Derivative (2016-2032)
- Figure 41: North America Furfural Derivatives Market Share Comparison by Application (2016-2032)
- Figure 42: North America Furfural Derivatives Market Share Comparison by End User Industry (2016-2032)
- Figure 43: Western Europe Furfural Derivatives Market Revenue (US$ Mn) Market Share by Type of Derivativein 2022
- Figure 44: Western Europe Furfural Derivatives Market Attractiveness Analysis by Type of Derivative, 2016-2032
- Figure 45: Western Europe Furfural Derivatives Market Revenue (US$ Mn) Market Share by Applicationin 2022
- Figure 46: Western Europe Furfural Derivatives Market Attractiveness Analysis by Application, 2016-2032
- Figure 47: Western Europe Furfural Derivatives Market Revenue (US$ Mn) Market Share by End User Industryin 2022
- Figure 48: Western Europe Furfural Derivatives Market Attractiveness Analysis by End User Industry, 2016-2032
- Figure 49: Western Europe Furfural Derivatives Market Revenue (US$ Mn) Market Share by Country in 2022
- Figure 50: Western Europe Furfural Derivatives Market Attractiveness Analysis by Country, 2016-2032
- Figure 51: Western Europe Furfural Derivatives Market Revenue (US$ Mn) (2016-2032)
- Figure 52: Western Europe Furfural Derivatives Market Revenue (US$ Mn) Comparison by Country (2016-2032)
- Figure 53: Western Europe Furfural Derivatives Market Revenue (US$ Mn) Comparison by Type of Derivative (2016-2032)
- Figure 54: Western Europe Furfural Derivatives Market Revenue (US$ Mn) Comparison by Application (2016-2032)
- Figure 55: Western Europe Furfural Derivatives Market Revenue (US$ Mn) Comparison by End User Industry (2016-2032)
- Figure 56: Western Europe Furfural Derivatives Market Y-o-Y Growth Rate Comparison by Country (2016-2032)
- Figure 57: Western Europe Furfural Derivatives Market Y-o-Y Growth Rate Comparison by Type of Derivative (2016-2032)
- Figure 58: Western Europe Furfural Derivatives Market Y-o-Y Growth Rate Comparison by Application (2016-2032)
- Figure 59: Western Europe Furfural Derivatives Market Y-o-Y Growth Rate Comparison by End User Industry (2016-2032)
- Figure 60: Western Europe Furfural Derivatives Market Share Comparison by Country (2016-2032)
- Figure 61: Western Europe Furfural Derivatives Market Share Comparison by Type of Derivative (2016-2032)
- Figure 62: Western Europe Furfural Derivatives Market Share Comparison by Application (2016-2032)
- Figure 63: Western Europe Furfural Derivatives Market Share Comparison by End User Industry (2016-2032)
- Figure 64: Eastern Europe Furfural Derivatives Market Revenue (US$ Mn) Market Share by Type of Derivativein 2022
- Figure 65: Eastern Europe Furfural Derivatives Market Attractiveness Analysis by Type of Derivative, 2016-2032
- Figure 66: Eastern Europe Furfural Derivatives Market Revenue (US$ Mn) Market Share by Applicationin 2022
- Figure 67: Eastern Europe Furfural Derivatives Market Attractiveness Analysis by Application, 2016-2032
- Figure 68: Eastern Europe Furfural Derivatives Market Revenue (US$ Mn) Market Share by End User Industryin 2022
- Figure 69: Eastern Europe Furfural Derivatives Market Attractiveness Analysis by End User Industry, 2016-2032
- Figure 70: Eastern Europe Furfural Derivatives Market Revenue (US$ Mn) Market Share by Country in 2022
- Figure 71: Eastern Europe Furfural Derivatives Market Attractiveness Analysis by Country, 2016-2032
- Figure 72: Eastern Europe Furfural Derivatives Market Revenue (US$ Mn) (2016-2032)
- Figure 73: Eastern Europe Furfural Derivatives Market Revenue (US$ Mn) Comparison by Country (2016-2032)
- Figure 74: Eastern Europe Furfural Derivatives Market Revenue (US$ Mn) Comparison by Type of Derivative (2016-2032)
- Figure 75: Eastern Europe Furfural Derivatives Market Revenue (US$ Mn) Comparison by Application (2016-2032)
- Figure 76: Eastern Europe Furfural Derivatives Market Revenue (US$ Mn) Comparison by End User Industry (2016-2032)
- Figure 77: Eastern Europe Furfural Derivatives Market Y-o-Y Growth Rate Comparison by Country (2016-2032)
- Figure 78: Eastern Europe Furfural Derivatives Market Y-o-Y Growth Rate Comparison by Type of Derivative (2016-2032)
- Figure 79: Eastern Europe Furfural Derivatives Market Y-o-Y Growth Rate Comparison by Application (2016-2032)
- Figure 80: Eastern Europe Furfural Derivatives Market Y-o-Y Growth Rate Comparison by End User Industry (2016-2032)
- Figure 81: Eastern Europe Furfural Derivatives Market Share Comparison by Country (2016-2032)
- Figure 82: Eastern Europe Furfural Derivatives Market Share Comparison by Type of Derivative (2016-2032)
- Figure 83: Eastern Europe Furfural Derivatives Market Share Comparison by Application (2016-2032)
- Figure 84: Eastern Europe Furfural Derivatives Market Share Comparison by End User Industry (2016-2032)
- Figure 85: APAC Furfural Derivatives Market Revenue (US$ Mn) Market Share by Type of Derivativein 2022
- Figure 86: APAC Furfural Derivatives Market Attractiveness Analysis by Type of Derivative, 2016-2032
- Figure 87: APAC Furfural Derivatives Market Revenue (US$ Mn) Market Share by Applicationin 2022
- Figure 88: APAC Furfural Derivatives Market Attractiveness Analysis by Application, 2016-2032
- Figure 89: APAC Furfural Derivatives Market Revenue (US$ Mn) Market Share by End User Industryin 2022
- Figure 90: APAC Furfural Derivatives Market Attractiveness Analysis by End User Industry, 2016-2032
- Figure 91: APAC Furfural Derivatives Market Revenue (US$ Mn) Market Share by Country in 2022
- Figure 92: APAC Furfural Derivatives Market Attractiveness Analysis by Country, 2016-2032
- Figure 93: APAC Furfural Derivatives Market Revenue (US$ Mn) (2016-2032)
- Figure 94: APAC Furfural Derivatives Market Revenue (US$ Mn) Comparison by Country (2016-2032)
- Figure 95: APAC Furfural Derivatives Market Revenue (US$ Mn) Comparison by Type of Derivative (2016-2032)
- Figure 96: APAC Furfural Derivatives Market Revenue (US$ Mn) Comparison by Application (2016-2032)
- Figure 97: APAC Furfural Derivatives Market Revenue (US$ Mn) Comparison by End User Industry (2016-2032)
- Figure 98: APAC Furfural Derivatives Market Y-o-Y Growth Rate Comparison by Country (2016-2032)
- Figure 99: APAC Furfural Derivatives Market Y-o-Y Growth Rate Comparison by Type of Derivative (2016-2032)
- Figure 100: APAC Furfural Derivatives Market Y-o-Y Growth Rate Comparison by Application (2016-2032)
- Figure 101: APAC Furfural Derivatives Market Y-o-Y Growth Rate Comparison by End User Industry (2016-2032)
- Figure 102: APAC Furfural Derivatives Market Share Comparison by Country (2016-2032)
- Figure 103: APAC Furfural Derivatives Market Share Comparison by Type of Derivative (2016-2032)
- Figure 104: APAC Furfural Derivatives Market Share Comparison by Application (2016-2032)
- Figure 105: APAC Furfural Derivatives Market Share Comparison by End User Industry (2016-2032)
- Figure 106: Latin America Furfural Derivatives Market Revenue (US$ Mn) Market Share by Type of Derivativein 2022
- Figure 107: Latin America Furfural Derivatives Market Attractiveness Analysis by Type of Derivative, 2016-2032
- Figure 108: Latin America Furfural Derivatives Market Revenue (US$ Mn) Market Share by Applicationin 2022
- Figure 109: Latin America Furfural Derivatives Market Attractiveness Analysis by Application, 2016-2032
- Figure 110: Latin America Furfural Derivatives Market Revenue (US$ Mn) Market Share by End User Industryin 2022
- Figure 111: Latin America Furfural Derivatives Market Attractiveness Analysis by End User Industry, 2016-2032
- Figure 112: Latin America Furfural Derivatives Market Revenue (US$ Mn) Market Share by Country in 2022
- Figure 113: Latin America Furfural Derivatives Market Attractiveness Analysis by Country, 2016-2032
- Figure 114: Latin America Furfural Derivatives Market Revenue (US$ Mn) (2016-2032)
- Figure 115: Latin America Furfural Derivatives Market Revenue (US$ Mn) Comparison by Country (2016-2032)
- Figure 116: Latin America Furfural Derivatives Market Revenue (US$ Mn) Comparison by Type of Derivative (2016-2032)
- Figure 117: Latin America Furfural Derivatives Market Revenue (US$ Mn) Comparison by Application (2016-2032)
- Figure 118: Latin America Furfural Derivatives Market Revenue (US$ Mn) Comparison by End User Industry (2016-2032)
- Figure 119: Latin America Furfural Derivatives Market Y-o-Y Growth Rate Comparison by Country (2016-2032)
- Figure 120: Latin America Furfural Derivatives Market Y-o-Y Growth Rate Comparison by Type of Derivative (2016-2032)
- Figure 121: Latin America Furfural Derivatives Market Y-o-Y Growth Rate Comparison by Application (2016-2032)
- Figure 122: Latin America Furfural Derivatives Market Y-o-Y Growth Rate Comparison by End User Industry (2016-2032)
- Figure 123: Latin America Furfural Derivatives Market Share Comparison by Country (2016-2032)
- Figure 124: Latin America Furfural Derivatives Market Share Comparison by Type of Derivative (2016-2032)
- Figure 125: Latin America Furfural Derivatives Market Share Comparison by Application (2016-2032)
- Figure 126: Latin America Furfural Derivatives Market Share Comparison by End User Industry (2016-2032)
- Figure 127: Middle East & Africa Furfural Derivatives Market Revenue (US$ Mn) Market Share by Type of Derivativein 2022
- Figure 128: Middle East & Africa Furfural Derivatives Market Attractiveness Analysis by Type of Derivative, 2016-2032
- Figure 129: Middle East & Africa Furfural Derivatives Market Revenue (US$ Mn) Market Share by Applicationin 2022
- Figure 130: Middle East & Africa Furfural Derivatives Market Attractiveness Analysis by Application, 2016-2032
- Figure 131: Middle East & Africa Furfural Derivatives Market Revenue (US$ Mn) Market Share by End User Industryin 2022
- Figure 132: Middle East & Africa Furfural Derivatives Market Attractiveness Analysis by End User Industry, 2016-2032
- Figure 133: Middle East & Africa Furfural Derivatives Market Revenue (US$ Mn) Market Share by Country in 2022
- Figure 134: Middle East & Africa Furfural Derivatives Market Attractiveness Analysis by Country, 2016-2032
- Figure 135: Middle East & Africa Furfural Derivatives Market Revenue (US$ Mn) (2016-2032)
- Figure 136: Middle East & Africa Furfural Derivatives Market Revenue (US$ Mn) Comparison by Country (2016-2032)
- Figure 137: Middle East & Africa Furfural Derivatives Market Revenue (US$ Mn) Comparison by Type of Derivative (2016-2032)
- Figure 138: Middle East & Africa Furfural Derivatives Market Revenue (US$ Mn) Comparison by Application (2016-2032)
- Figure 139: Middle East & Africa Furfural Derivatives Market Revenue (US$ Mn) Comparison by End User Industry (2016-2032)
- Figure 140: Middle East & Africa Furfural Derivatives Market Y-o-Y Growth Rate Comparison by Country (2016-2032)
- Figure 141: Middle East & Africa Furfural Derivatives Market Y-o-Y Growth Rate Comparison by Type of Derivative (2016-2032)
- Figure 142: Middle East & Africa Furfural Derivatives Market Y-o-Y Growth Rate Comparison by Application (2016-2032)
- Figure 143: Middle East & Africa Furfural Derivatives Market Y-o-Y Growth Rate Comparison by End User Industry (2016-2032)
- Figure 144: Middle East & Africa Furfural Derivatives Market Share Comparison by Country (2016-2032)
- Figure 145: Middle East & Africa Furfural Derivatives Market Share Comparison by Type of Derivative (2016-2032)
- Figure 146: Middle East & Africa Furfural Derivatives Market Share Comparison by Application (2016-2032)
- Figure 147: Middle East & Africa Furfural Derivatives Market Share Comparison by End User Industry (2016-2032)
- List of Tables
- Table 1: Global Furfural Derivatives Market Comparison by Type of Derivative (2016-2032)
- Table 2: Global Furfural Derivatives Market Comparison by Application (2016-2032)
- Table 3: Global Furfural Derivatives Market Comparison by End User Industry (2016-2032)
- Table 4: Global Furfural Derivatives Market Revenue (US$ Mn) Comparison by Region (2016-2032)
- Table 5: Global Furfural Derivatives Market Revenue (US$ Mn) (2016-2032)
- Table 6: Global Furfural Derivatives Market Revenue (US$ Mn) Comparison by Region (2016-2032)
- Table 7: Global Furfural Derivatives Market Revenue (US$ Mn) Comparison by Type of Derivative (2016-2032)
- Table 8: Global Furfural Derivatives Market Revenue (US$ Mn) Comparison by Application (2016-2032)
- Table 9: Global Furfural Derivatives Market Revenue (US$ Mn) Comparison by End User Industry (2016-2032)
- Table 10: Global Furfural Derivatives Market Y-o-Y Growth Rate Comparison by Region (2016-2032)
- Table 11: Global Furfural Derivatives Market Y-o-Y Growth Rate Comparison by Type of Derivative (2016-2032)
- Table 12: Global Furfural Derivatives Market Y-o-Y Growth Rate Comparison by Application (2016-2032)
- Table 13: Global Furfural Derivatives Market Y-o-Y Growth Rate Comparison by End User Industry (2016-2032)
- Table 14: Global Furfural Derivatives Market Share Comparison by Region (2016-2032)
- Table 15: Global Furfural Derivatives Market Share Comparison by Type of Derivative (2016-2032)
- Table 16: Global Furfural Derivatives Market Share Comparison by Application (2016-2032)
- Table 17: Global Furfural Derivatives Market Share Comparison by End User Industry (2016-2032)
- Table 18: North America Furfural Derivatives Market Comparison by Application (2016-2032)
- Table 19: North America Furfural Derivatives Market Comparison by End User Industry (2016-2032)
- Table 20: North America Furfural Derivatives Market Revenue (US$ Mn) Comparison by Country (2016-2032)
- Table 21: North America Furfural Derivatives Market Revenue (US$ Mn) (2016-2032)
- Table 22: North America Furfural Derivatives Market Revenue (US$ Mn) Comparison by Country (2016-2032)
- Table 23: North America Furfural Derivatives Market Revenue (US$ Mn) Comparison by Type of Derivative (2016-2032)
- Table 24: North America Furfural Derivatives Market Revenue (US$ Mn) Comparison by Application (2016-2032)
- Table 25: North America Furfural Derivatives Market Revenue (US$ Mn) Comparison by End User Industry (2016-2032)
- Table 26: North America Furfural Derivatives Market Y-o-Y Growth Rate Comparison by Country (2016-2032)
- Table 27: North America Furfural Derivatives Market Y-o-Y Growth Rate Comparison by Type of Derivative (2016-2032)
- Table 28: North America Furfural Derivatives Market Y-o-Y Growth Rate Comparison by Application (2016-2032)
- Table 29: North America Furfural Derivatives Market Y-o-Y Growth Rate Comparison by End User Industry (2016-2032)
- Table 30: North America Furfural Derivatives Market Share Comparison by Country (2016-2032)
- Table 31: North America Furfural Derivatives Market Share Comparison by Type of Derivative (2016-2032)
- Table 32: North America Furfural Derivatives Market Share Comparison by Application (2016-2032)
- Table 33: North America Furfural Derivatives Market Share Comparison by End User Industry (2016-2032)
- Table 34: Western Europe Furfural Derivatives Market Comparison by Type of Derivative (2016-2032)
- Table 35: Western Europe Furfural Derivatives Market Comparison by Application (2016-2032)
- Table 36: Western Europe Furfural Derivatives Market Comparison by End User Industry (2016-2032)
- Table 37: Western Europe Furfural Derivatives Market Revenue (US$ Mn) Comparison by Country (2016-2032)
- Table 38: Western Europe Furfural Derivatives Market Revenue (US$ Mn) (2016-2032)
- Table 39: Western Europe Furfural Derivatives Market Revenue (US$ Mn) Comparison by Country (2016-2032)
- Table 40: Western Europe Furfural Derivatives Market Revenue (US$ Mn) Comparison by Type of Derivative (2016-2032)
- Table 41: Western Europe Furfural Derivatives Market Revenue (US$ Mn) Comparison by Application (2016-2032)
- Table 42: Western Europe Furfural Derivatives Market Revenue (US$ Mn) Comparison by End User Industry (2016-2032)
- Table 43: Western Europe Furfural Derivatives Market Y-o-Y Growth Rate Comparison by Country (2016-2032)
- Table 44: Western Europe Furfural Derivatives Market Y-o-Y Growth Rate Comparison by Type of Derivative (2016-2032)
- Table 45: Western Europe Furfural Derivatives Market Y-o-Y Growth Rate Comparison by Application (2016-2032)
- Table 46: Western Europe Furfural Derivatives Market Y-o-Y Growth Rate Comparison by End User Industry (2016-2032)
- Table 47: Western Europe Furfural Derivatives Market Share Comparison by Country (2016-2032)
- Table 48: Western Europe Furfural Derivatives Market Share Comparison by Type of Derivative (2016-2032)
- Table 49: Western Europe Furfural Derivatives Market Share Comparison by Application (2016-2032)
- Table 50: Western Europe Furfural Derivatives Market Share Comparison by End User Industry (2016-2032)
- Table 51: Eastern Europe Furfural Derivatives Market Comparison by Type of Derivative (2016-2032)
- Table 52: Eastern Europe Furfural Derivatives Market Comparison by Application (2016-2032)
- Table 53: Eastern Europe Furfural Derivatives Market Comparison by End User Industry (2016-2032)
- Table 54: Eastern Europe Furfural Derivatives Market Revenue (US$ Mn) Comparison by Country (2016-2032)
- Table 55: Eastern Europe Furfural Derivatives Market Revenue (US$ Mn) (2016-2032)
- Table 56: Eastern Europe Furfural Derivatives Market Revenue (US$ Mn) Comparison by Country (2016-2032)
- Table 57: Eastern Europe Furfural Derivatives Market Revenue (US$ Mn) Comparison by Type of Derivative (2016-2032)
- Table 58: Eastern Europe Furfural Derivatives Market Revenue (US$ Mn) Comparison by Application (2016-2032)
- Table 59: Eastern Europe Furfural Derivatives Market Revenue (US$ Mn) Comparison by End User Industry (2016-2032)
- Table 60: Eastern Europe Furfural Derivatives Market Y-o-Y Growth Rate Comparison by Country (2016-2032)
- Table 61: Eastern Europe Furfural Derivatives Market Y-o-Y Growth Rate Comparison by Type of Derivative (2016-2032)
- Table 62: Eastern Europe Furfural Derivatives Market Y-o-Y Growth Rate Comparison by Application (2016-2032)
- Table 63: Eastern Europe Furfural Derivatives Market Y-o-Y Growth Rate Comparison by End User Industry (2016-2032)
- Table 64: Eastern Europe Furfural Derivatives Market Share Comparison by Country (2016-2032)
- Table 65: Eastern Europe Furfural Derivatives Market Share Comparison by Type of Derivative (2016-2032)
- Table 66: Eastern Europe Furfural Derivatives Market Share Comparison by Application (2016-2032)
- Table 67: Eastern Europe Furfural Derivatives Market Share Comparison by End User Industry (2016-2032)
- Table 68: APAC Furfural Derivatives Market Comparison by Type of Derivative (2016-2032)
- Table 69: APAC Furfural Derivatives Market Comparison by Application (2016-2032)
- Table 70: APAC Furfural Derivatives Market Comparison by End User Industry (2016-2032)
- Table 71: APAC Furfural Derivatives Market Revenue (US$ Mn) Comparison by Country (2016-2032)
- Table 72: APAC Furfural Derivatives Market Revenue (US$ Mn) (2016-2032)
- Table 73: APAC Furfural Derivatives Market Revenue (US$ Mn) Comparison by Country (2016-2032)
- Table 74: APAC Furfural Derivatives Market Revenue (US$ Mn) Comparison by Type of Derivative (2016-2032)
- Table 75: APAC Furfural Derivatives Market Revenue (US$ Mn) Comparison by Application (2016-2032)
- Table 76: APAC Furfural Derivatives Market Revenue (US$ Mn) Comparison by End User Industry (2016-2032)
- Table 77: APAC Furfural Derivatives Market Y-o-Y Growth Rate Comparison by Country (2016-2032)
- Table 78: APAC Furfural Derivatives Market Y-o-Y Growth Rate Comparison by Type of Derivative (2016-2032)
- Table 79: APAC Furfural Derivatives Market Y-o-Y Growth Rate Comparison by Application (2016-2032)
- Table 80: APAC Furfural Derivatives Market Y-o-Y Growth Rate Comparison by End User Industry (2016-2032)
- Table 81: APAC Furfural Derivatives Market Share Comparison by Country (2016-2032)
- Table 82: APAC Furfural Derivatives Market Share Comparison by Type of Derivative (2016-2032)
- Table 83: APAC Furfural Derivatives Market Share Comparison by Application (2016-2032)
- Table 84: APAC Furfural Derivatives Market Share Comparison by End User Industry (2016-2032)
- Table 85: Latin America Furfural Derivatives Market Comparison by Type of Derivative (2016-2032)
- Table 86: Latin America Furfural Derivatives Market Comparison by Application (2016-2032)
- Table 87: Latin America Furfural Derivatives Market Comparison by End User Industry (2016-2032)
- Table 88: Latin America Furfural Derivatives Market Revenue (US$ Mn) Comparison by Country (2016-2032)
- Table 89: Latin America Furfural Derivatives Market Revenue (US$ Mn) (2016-2032)
- Table 90: Latin America Furfural Derivatives Market Revenue (US$ Mn) Comparison by Country (2016-2032)
- Table 91: Latin America Furfural Derivatives Market Revenue (US$ Mn) Comparison by Type of Derivative (2016-2032)
- Table 92: Latin America Furfural Derivatives Market Revenue (US$ Mn) Comparison by Application (2016-2032)
- Table 93: Latin America Furfural Derivatives Market Revenue (US$ Mn) Comparison by End User Industry (2016-2032)
- Table 94: Latin America Furfural Derivatives Market Y-o-Y Growth Rate Comparison by Country (2016-2032)
- Table 95: Latin America Furfural Derivatives Market Y-o-Y Growth Rate Comparison by Type of Derivative (2016-2032)
- Table 96: Latin America Furfural Derivatives Market Y-o-Y Growth Rate Comparison by Application (2016-2032)
- Table 97: Latin America Furfural Derivatives Market Y-o-Y Growth Rate Comparison by End User Industry (2016-2032)
- Table 98: Latin America Furfural Derivatives Market Share Comparison by Country (2016-2032)
- Table 99: Latin America Furfural Derivatives Market Share Comparison by Type of Derivative (2016-2032)
- Table 100: Latin America Furfural Derivatives Market Share Comparison by Application (2016-2032)
- Table 101: Latin America Furfural Derivatives Market Share Comparison by End User Industry (2016-2032)
- Table 102: Middle East & Africa Furfural Derivatives Market Comparison by Type of Derivative (2016-2032)
- Table 103: Middle East & Africa Furfural Derivatives Market Comparison by Application (2016-2032)
- Table 104: Middle East & Africa Furfural Derivatives Market Comparison by End User Industry (2016-2032)
- Table 105: Middle East & Africa Furfural Derivatives Market Revenue (US$ Mn) Comparison by Country (2016-2032)
- Table 106: Middle East & Africa Furfural Derivatives Market Revenue (US$ Mn) (2016-2032)
- Table 107: Middle East & Africa Furfural Derivatives Market Revenue (US$ Mn) Comparison by Country (2016-2032)
- Table 108: Middle East & Africa Furfural Derivatives Market Revenue (US$ Mn) Comparison by Type of Derivative (2016-2032)
- Table 109: Middle East & Africa Furfural Derivatives Market Revenue (US$ Mn) Comparison by Application (2016-2032)
- Table 110: Middle East & Africa Furfural Derivatives Market Revenue (US$ Mn) Comparison by End User Industry (2016-2032)
- Table 111: Middle East & Africa Furfural Derivatives Market Y-o-Y Growth Rate Comparison by Country (2016-2032)
- Table 112: Middle East & Africa Furfural Derivatives Market Y-o-Y Growth Rate Comparison by Type of Derivative (2016-2032)
- Table 113: Middle East & Africa Furfural Derivatives Market Y-o-Y Growth Rate Comparison by Application (2016-2032)
- Table 114: Middle East & Africa Furfural Derivatives Market Y-o-Y Growth Rate Comparison by End User Industry (2016-2032)
- Table 115: Middle East & Africa Furfural Derivatives Market Share Comparison by Country (2016-2032)
- Table 116: Middle East & Africa Furfural Derivatives Market Share Comparison by Type of Derivative (2016-2032)
- Table 117: Middle East & Africa Furfural Derivatives Market Share Comparison by Application (2016-2032)
- Table 118: Middle East & Africa Furfural Derivatives Market Share Comparison by End User Industry (2016-2032)
- 1. Executive Summary
-
- Avantium N.V.
- Hongye Chemical Group Corporation Ltd.
- Central Romana Corporation
- Pennakem LLC
- Illovo Sugar Africa (Pty) Ltd.
- Lenzing AG
- Tanin Sevnica d.d.
- Silvateam S.p.A.
- KRBL Limited
- Tieling North Furfural (Group) Co., Ltd.
- Nutrafur S.A.
- Transfurans Chemicals BVBA
- International Furan Chemicals (IFC)
- Hebei Zehao Biotechnology Co., Ltd.
- Sugar Australia Pty Ltd.
Our Clients


View Our Licence Options
