
Fortified Rice Market By Nature(Conventional, Organic), By Distribution Channel(Offline, Online), By Ingredients(Vitamins, Organic), By Technology(Coating & Encapsulation, Drying, Others), By End User(Commercial, Residential), By Region And Companies - Industry Segment Outlook, Market Assessment, Competition Scenario, Trends, And Forecast 2023-2032
-
11781
-
May 2023
-
171
-


-
This report was compiled by Shreyas Rokade Shreyas Rokade is a seasoned Research Analyst with CMFE, bringing extensive expertise in market research and consulting, with a strong background in Chemical Engineering. Correspondence Team Lead-CMFE Linkedin | Detailed Market research Methodology Our methodology involves a mix of primary research, including interviews with leading mental health experts, and secondary research from reputable medical journals and databases. View Detailed Methodology Page
-
Quick Navigation
- Fortified Rice Market Size, Share, Trends Analysis
- Fortified Rice Market Dynamics
- Fortified Rice Market Segmentation Analysis
- Fortified Rice Industry Segments
- Growth Opportunity of the Fortified Rice Market
- Fortified Rice Market Regional Analysis
- Fortified Rice Market By Region
- Fortified Rice Market Key Player Analysis
- Fortified Rice Industry Key Players
- Recent Development
- Report Scope
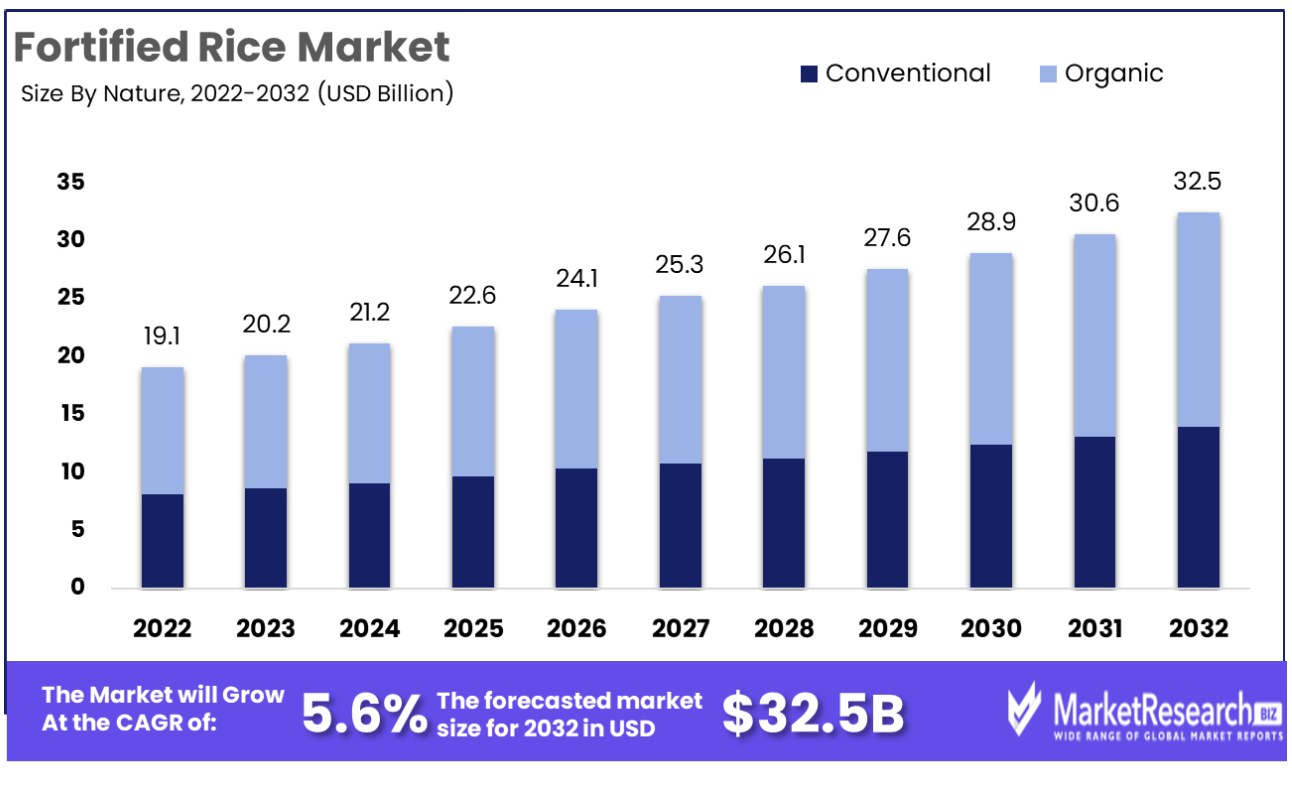
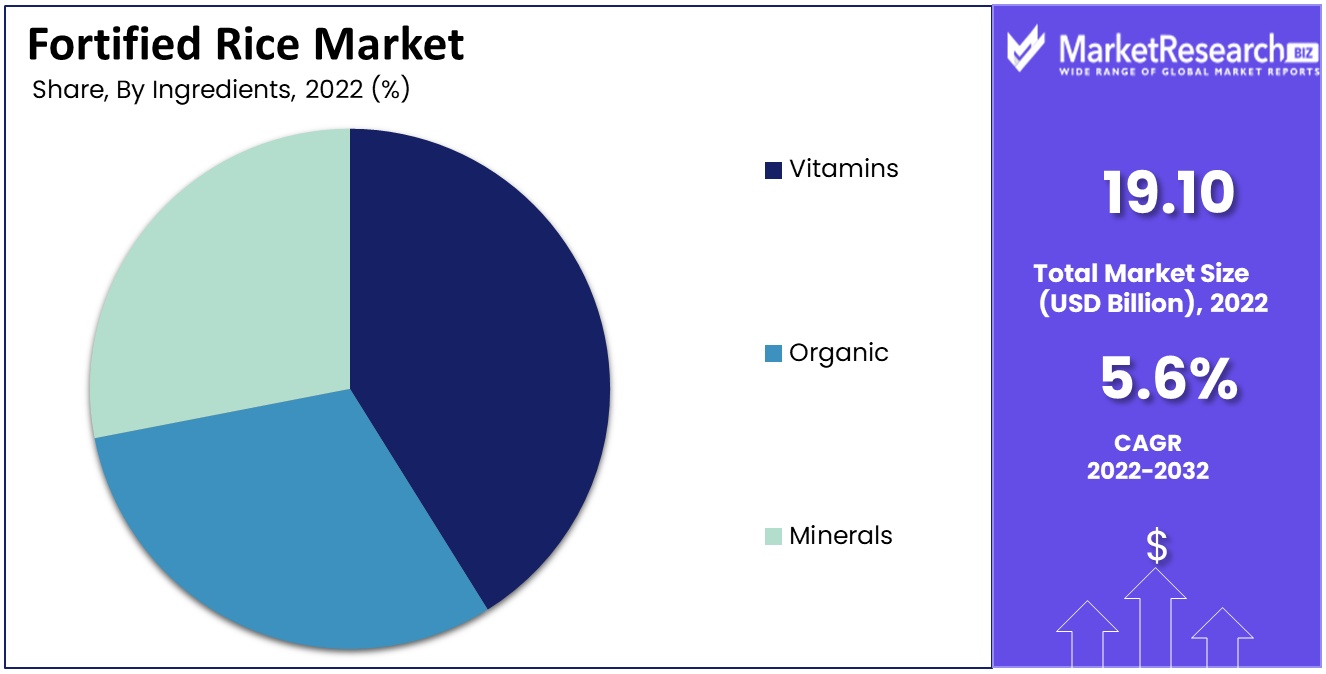
The fortified rice market was valued at USD 19.10 billion in 2022. It is expected to reach USD 32.5 billion by 2032, with a projected CAGR of 5.6% during the forecast period from 2023 to 2032.
The surge in health consciousness among individuals and the rise in demand in the food and beverage industry are major driving factors for the rice fortification market. Globally, rice plays an important role in many diets.
More than 70% of individuals, especially from low-developing countries, are eating rice, indicating a significant dependency on rice. Though rice is a great source of energy, it is a poor source of micronutrients and there is an absence of nutritional value. This is reflected in the content of rice. It is due to the milling processing that generates white rice, such as tilda rice, eliminating the fat as well as the nutrient-rich bran layers.
Brown rice and bio-fortified rice like the high zinc rice are more nutritional as compared to white rice, affecting the overall rice quality. Bio-fortified rice is more nutritious because of the usage of different varieties of rice nutrients. Fortifying rice can help to decrease the nutrient gap by adding essential rice nutrients that are absent in the common rice. The fortification can be done without impacting the taste, appearance, or cooking procedures of the rice depending upon the technology that is used for fortifying the rice, influencing the rice market growth.
Consumers are becoming more conscious about their diet, with an increasing Consumption Of Rice. They are seeking nutritional food without much emphasis on taste. Many customers are inclined towards bio-fortified rice and brown grain as they are less in calories and provide more nutrition to the body, affecting the Rice Market Size.
Manufacturers like Hain Celestial are now focusing on fortified rice to meet the nutritional goals of end-use consumers. To do so, nutritional programs have to reach their full advantages as fortification programs are required to meet some specific needs to become more effective. Fortified grains are very convenient and easy to use, as rice is widely used as a common food, it is straightforward to change the preference from standard white rice to fortified to enhance the nutritional value in the daily diet, influencing the rice supply and tons of rice.
Moreover, advanced technologies are used for the fortification of the rice such as the use of hot extrusion, making sure to add high-quality micronutrients should remain steady without affecting the consumer’s requirement. Fortified can also be personalized for specific requirements like tuna rice, catering to the diverse needs in the market. It is the most preferred choice for individuals who are health conscious and are seeking new ways to reach specific health benefits, aligning with the Core Strategies of companies in this sector.
The demand for fortified rice will increase rapidly, as consumers opt for a good healthy diet. This will lead to a surge in market revenue and boost the growth of the fortified grain market during the forecast period.
Fortified Rice Market Dynamics
Growing Awareness of Micronutrient Deficiencies Drives Market Growth
The burgeoning consciousness of micronutrient inadequacies is a pivotal driver in the fortified rice market's expansion. This awareness stimulates consumer demand, particularly in regions grappling with nutritional deficits. The market responds by diversifying product offerings and integrating essential vitamins and minerals into grain, a staple food globally. This trend not only caters to health attentiveness among consumers but also aligns with public health initiatives, fostering partnerships between governments and manufacturers. The strategy outlook in this sector focuses on reducing healthcare costs and improving public health outcomes, reinforcing the fortified grain market's position as a solution to widespread nutritional challenges.
Rising Health Awareness Spurs Market Development
Elevated health attentiveness among consumers is fundamentally reshaping the fortified grains industry. This shift goes beyond addressing micronutrient deficiencies; it encompasses a broader pursuit of wellness through diet. The market is adapting with a channel strategy that introduces products with enhanced health benefits, appealing to a more informed and health-centric customer base. This awareness is increasingly influencing purchasing decisions, driving demand for nutritionally enriched grain. The synergy of consumer health trends with advancements in food technology, as indicated by forecast analysis, suggests a sustained growth trajectory, positioning fortified as a key player in the health-focused food sector.
Increasing Investments in Research and Development Catalyze Market Evolution
Heightened investments in research and development (R&D) are crucial in propelling the fortified grain market forward. These investments, part of the industry's key strategies, enable the development of more efficient fortification techniques and the discovery of new nutrient combinations, catering to diverse dietary needs and preferences. This R&D push, aligned with cost-effective complementary strategies, not only enhances product quality but also broadens the market reach by addressing specific health concerns and regional dietary requirements. The collaboration between R&D and marketing strategies is set to foster innovation, potentially leading to the emergence of novel products and fortification methods.
Expansion of End-Use Industries Accelerates Market Growth
The growth of end-use industries, such as food processing and hospitality, significantly amplifies the fortified rice market's expansion. These industries increasingly incorporate fortified rice into their offerings, driven by the rising demand for healthier food options. This expansion aligns with global trends toward nutritious and convenient food products, making fortified grain an attractive ingredient for various applications. The intersection of these expanding industries with consumer health trends creates a robust demand for fortified grain, promising sustained market growth. The long-term effect could be a more integrated approach in the food industry, where health, convenience, and taste converge, further solidifying the market's growth trajectory.
High Cost of Technology Restrains Market Growth
The technology required for rice fortification involves both initial capital investment and ongoing operational expenses, making it a significant barrier for many potential market entrants. This high cost primarily stems from the need for advanced machinery to embed nutrients without compromising rice quality. Additionally, maintaining consistent nutrient levels requires sophisticated quality control mechanisms, further elevating costs. As a result, smaller producers often find it challenging to compete, leading to a concentration of the market in the hands of a few well-capitalized players. This limitation not only restricts market diversity but also impacts the geographical reach of fortified cereal especially in regions where investment capital is scarce.
Lack of Awareness Restrains Market Growth
Awareness regarding the health benefits of fortified sushi remains surprisingly limited, particularly in regions that would benefit most from its nutritional enhancements. The lack of awareness is partly due to insufficient educational campaigns and the absence of a robust marketing push from industry players. This gap in understanding extends to both consumers, who are often unaware of the benefits of fortified over traditional varieties, and to potential investors who might otherwise see the market’s potential. The consequence is a slower adoption rate of fortified cereal, hindering market growth. Elevating awareness through targeted educational and marketing initiatives could significantly catalyze market expansion.
Fortified Rice Market Segmentation Analysis
By Nature Analysis
The conventional segment of the fortified rice market is preeminent, driven by its accessibility and cost-effectiveness. This segment leverages economies of scale, ensuring widespread availability in various markets, including products like Black Rice. The conventional processing methods cater to a broad consumer base, encompassing both developed and emerging markets. Current trends indicate a robust demand in regions with high rice consumption and nutritional deficiencies, often lacking in vital micronutrients. However, this segment faces challenges, such as consumer shifts towards healthier, organic options, and regulatory scrutiny regarding additives.
While the organic segment is smaller, it's growing rapidly, propelled by increasing health consciousness and environmental concerns. This segment, though premium-priced, is gaining traction in affluent markets where consumers are willing to pay more for perceived health and quality benefits, including the micronutrient (minerals, vitamins) content. The growth of organic fortified rice is particularly notable in North America and Europe, where organic food consumption is on the rise. This segment, albeit smaller, complements the conventional segment by catering to a niche but growing market, emphasizing the basis of micronutrient enhancement.
By Distribution Channel Analysis
Offline channels dominate the distribution of fortified rice, largely due to consumer habits and the tactile nature of food shopping. Supermarkets and convenience stores offer the advantage of physical product inspection and immediate purchase, which is a significant driver for this segment, especially for products enriched with micronutrients (minerals, vitamins). These channels also benefit from established supply chains and the ability to offer a wide range of products, enhancing consumer choice. The trend toward supermarket private labels offering fortified rice products is also notable, further bolstering this segment's dominance.
The online segment, though smaller, is witnessing accelerated growth, especially post-pandemic. The convenience of home delivery, the rising penetration of e-commerce in food retail, and the ability to reach remote areas are pivotal factors fueling this growth. Online platforms are also becoming key for niche products, such as organic fortified rice, where physical retail presence is limited. This segment's growth is indicative of a broader digital transformation in consumer shopping behaviors.
By Ingredients Analysis
Vitamins constitute the majority share in the fortified rice market. This dominance is attributed to the widespread prevalence of vitamin deficiencies globally and the critical role of vitamins in addressing these, underlining the importance of vital micronutrients. Vitamin A and B-complex, in particular, are commonly used in fortification due to their essential health benefits. This segment's growth is fueled by governmental initiatives in regions with high malnutrition rates and the increasing awareness of micronutrient deficiencies.
The mineral fortification segment, while smaller, plays a vital role in addressing specific nutritional deficiencies like iron and zinc. This segment is particularly significant in regions with specific dietary gaps, emphasizing the basis of micronutrients. The growth in this segment is driven by targeted nutrition programs and increasing consumer awareness about the importance of minerals in the diet.
By Technology Analysis
Coating and encapsulation technologies are pivotal in the fortified rice market, ensuring nutrient stability and effective delivery of vital micronutrients. These technologies are preferred for their efficiency in maintaining nutrient integrity during cooking and storage. The dominance of this segment is also due to the technological advancements that have made these methods more cost-effective and scalable.
While less dominant, these technologies are significant for specific applications and market needs. Drying and extrusion are particularly relevant in cost-sensitive markets, offering alternative methods of fortification. The 'Others' category, encompassing techniques like dusting, plays a niche but important role in fortification where other methods may not be viable.
By End User Analysis
The commercial segment, encompassing hotels, restaurants, and institutional settings, is a major consumer of fortified rice. This dominance is fueled by the large-scale procurement practices of these entities and the rising demand for nutritious, ready-to-eat meals. Additionally, government contracts for fortified rice in school feeding programs and disaster relief significantly contribute to this segment's size.
The residential segment, while smaller, is growing due to increasing health awareness and the availability of fortified rice in consumer-friendly packaging. The trend towards health-conscious eating at home is a key driver for this segment, especially in urban areas where lifestyle diseases are prevalent, and awareness of the importance of micronutrients (minerals, vitamins) is increasing.
Fortified Rice Industry Segments
By Nature
- Conventional
- Organic
By Distribution Channel
- Offline (Supermarkets, Convenience stores, Brick-and-Mortar)
- Online
By Ingredients
- Vitamins
- Organic
- Minerals
By Technology
- Coating & Encapsulation
- Drying
- Extrusion
- Others
By End User
- Commercial
- Residential
Growth Opportunity of the Fortified Rice Market
Product Innovation Offers Growth Opportunity
Product innovation acts as a catalyst for expansion in the Fortified Rice Market Report. The development of new formulations and processing technologies not only enhances the nutrient profile of rice but also improves its appeal to health-conscious consumers, emphasizing personal health. Recent trends show a growing demand for nutritionally enhanced foods, a segment where rice, as a staple food, plays a key role. Innovations like the incorporation of micronutrients that withstand cooking processes have marked a significant advancement in the rice market's competitive landscape. This drive for innovation, often supported by scientific research, paves the way for market growth by attracting a wider consumer base seeking healthier dietary options for their health benefits.
Private Sector Investment Drives Market Growth
The influx of private sector investment is a substantial driver of growth in the fortified rice market. Financial backing from private entities has enabled significant advancements in production capabilities and supply chain efficiency, reflecting an increased focus on environmental health. The recent trend of increased investment in food technology and nutrition-focused startups underlines this point. These investments allow for scaling up production, enhancing quality control, and expanding market reach. Private capital also fosters collaborations between companies and research institutions, leading to innovations in fortification technology and new product development, thereby broadening the market scope and consumer appeal.
Multiple Fortified Rice Options Fuel Market Expansion
The availability of multiple fortified rice options is pivotal in fueling market expansion, catering to various consumer preferences and personal health requirements, thereby broadening the market base. Recent trends indicate an increasing consumer inclination towards personalized nutrition, which these options accommodate. For instance, rice fortified with specific vitamins and minerals for different demographic groups (like children or the elderly) addresses distinct nutritional needs. This variety not only meets the growing demand for tailored nutrition but also enhances consumer engagement and loyalty, reflecting the evolving rice market competitive landscape.
Fortified Rice Market Regional Analysis
Asia Pacific Dominates with Majority Market Share
In the fortified rice market, Asia Pacific's dominance is underpinned by a variety of factors. Primary among these is the region's intrinsic cultural attachment to sushi as a staple food, which ensures a consistent, high-volume demand. This demand is further bolstered by growing health consciousness among consumers, who are increasingly seeking nutrient-enriched food options. Additionally, the robust agricultural infrastructure in countries like India and China facilitates large-scale production of fortified grain.
Looking ahead, Asia Pacific's influence in the fortified market is poised to grow. The region's expanding middle class, with increasing disposable income, is likely to further boost demand for nutrient-rich food products. Additionally, ongoing government initiatives aimed at nutrition improvement are likely to continue, potentially leading to new policies that further encourage fortified rice consumption. These factors, combined with the region's robust production capabilities, suggest a sustained, if not strengthened, market presence for Asia Pacific in the coming years.
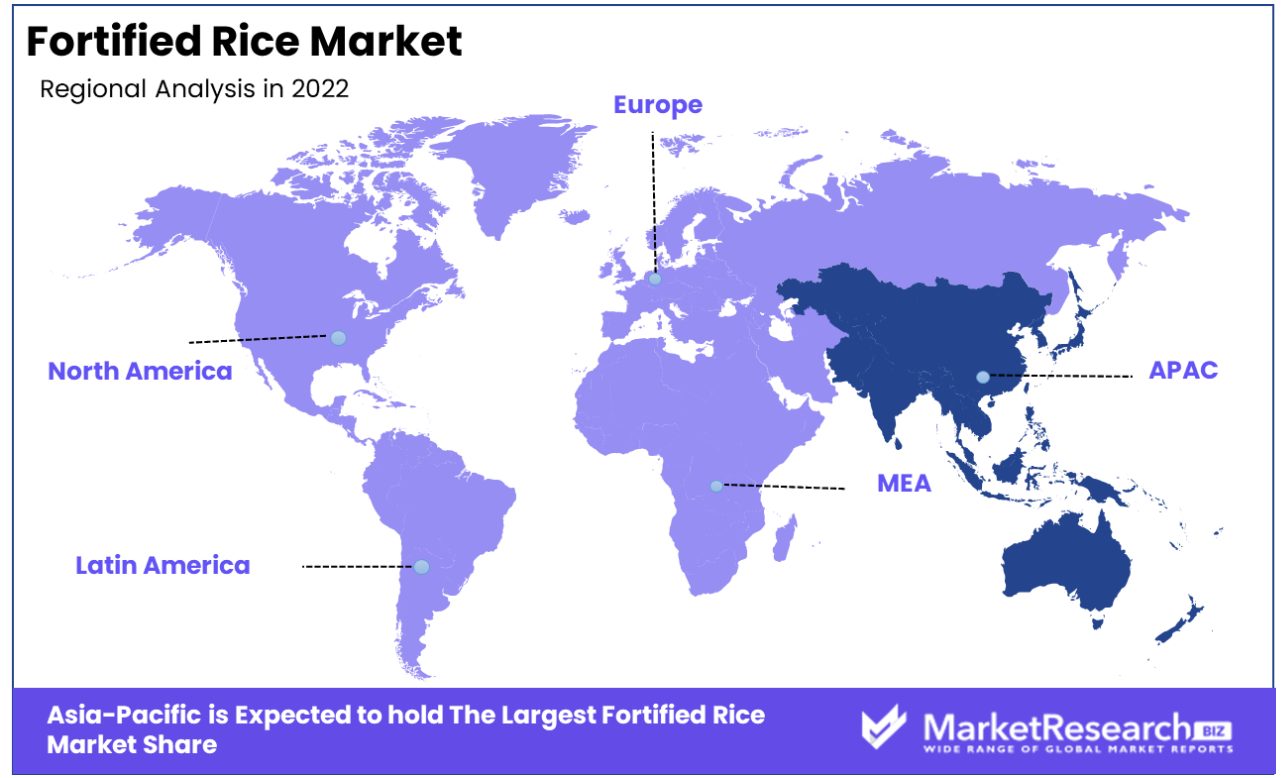
Europe
Europe's fortified rice market, though not as extensive as Asia Pacific's, is demonstrating notable growth. The region's increasing focus on health and wellness, coupled with a rising immigrant population accustomed to rice-based diets, is driving demand. European consumers are showing a growing preference for nutritionally enhanced foods, including fortified grains, as part of a balanced diet. The market is also benefiting from stringent food safety regulations, which ensure high product quality. This focus on quality, along with an evolving consumer base, positions Europe as an emerging player with the potential for significant market expansion.
North America
In North America, the fortified rice market is characterized by its emphasis on innovation and specialized products. The region's consumers, with their diverse dietary preferences and health-conscious attitudes, are increasingly opting for fortified grains as a nutritious alternative to traditional staples. The market is also witnessing a trend towards organic and non-GMO fortified sushi products, catering to a niche but growing segment. Technological advancements in fortification and a strong distribution network further bolster the region's market presence. North America's focus on quality and niche markets is set to keep it an important player in the global fortified rice landscape.
Fortified Rice Market By Region
North America
- The US
- Canada
- Rest of North America
Europe
- Germany
- France
- The UK
- Spain
- Italy
- Russia
- Netherlands
- Rest of Europe
Asia-Pacific
- China
- Japan
- South Korea
- India
- New Zealand
- Singapore
- Thailand
- Vietnam
- Rest of Asia Pacific
Latin America
- Brazil
- Mexico
- Rest of Latin America
Middle East & Africa
- South Africa
- Saudi Arabia
- UAE
- Rest of Middle East & Africa
Fortified Rice Market Key Player Analysis
In the dynamic landscape of the fortified rice market, key players are in distinct niches, leveraging unique strengths to influence this burgeoning sector. Cargill Incorporated and Bunge Limited, renowned for their agricultural commodity prowess, have strategically positioned themselves as vital players, ensuring supply chain robustness and raw material excellence. These companies underscore the market's reliance on efficient logistics and quality inputs. Bühler AG's technological innovation in rice fortification processes sets them apart, underscoring the importance of R&D in this sector.
BASF SE and Koninklijke DSM N.V., with their expertise in nutritional additives, have become pivotal in enhancing the value proposition of fortified grains, aligning closely with global health and nutritional goals. Their focus on micronutrient enrichment reflects the market's shift towards health-centric offerings. General Mills, Inc., known for its consumer-centric approach, and Wilmar International Ltd., with its extensive Asian market presence, have adeptly navigated consumer preferences, shaping market trends and demand dynamics.
Kohinoor Specialty Foods India Private Ltd., by focusing on regional tastes and dietary needs, highlights the market's geographical nuances and the importance of localized strategies. Collectively, these key players not only drive the fortified grains market's growth but also underscore the significance of innovation, strategic supply chain management, and alignment with global health objectives in shaping the market
Fortified Rice Industry Key Players
- Cargill Incorporated
- Bunge Limited
- Bühler AG
- BASF SE
- General Mills, Inc.
- Koninklijke DSM N.V.
- Wilmar International Ltd.
- Kohinoor Specialty Foods India Private Ltd.
- KRBL Limited
- REI Agro Ltd.
- Freedom Foods Group Limited
- LT Foods
Recent Development
- In October 2023, The Pilot Production of Fortified Rice in Nigeria was launched through a collaboration between the Global Alliance for Improved Nutrition (GAIN), the United Nations World Food Programme (WFP), the Federal Ministry of Health, and the Kebbi State Government. This marked a significant milestone in the efforts to combat malnutrition in Nigeria, particularly in addressing micronutrient deficiencies.
- In October 2023, Guyana became the first country in the Latin America and Caribbean region (LAC) to cultivate a bio-fortified rice variety known as GRDB IICA 17. This variety, designated as G18-113, contains 17 to 20mg of zinc per kilogram.
- In February 2022, Jesica Kincaid, Senior Manager of International Trade Policy at USA, highlighted the importance of staple food for over 3.5 billion people worldwide. She also emphasized the role of the United States in grain production and its contribution to global food security.
- In May 2022, Scoping of fortified and nutritious food products for targeted households and strengthening the distribution network to the last mile was commissioned by Joint Action for Nutrition Outcome (JANO), CARE Bangladesh, and conducted by icddr,b.
Report Scope
Report Features Description Market Value (2022) USD 19.10 Billion Forecast Revenue (2032) USD 32.5 Billion CAGR (2023-2032) 5.6% Base Year for Estimation 2022 Historic Period 2016-2022 Forecast Period 2023-2032 Report Coverage Revenue Forecast, Market Dynamics, COVID-19 Impact, Competitive Landscape, Recent Developments Segments Covered By Nature(Conventional, Organic), By Distribution Channel(Offline, Online), By Ingredients(Vitamins, Organic, Minerals), By Technology(Coating & Encapsulation, Drying, Extrusion, Others), By End User(Commercial, Residential) Regional Analysis North America - The US, Canada, Rest of North America, Europe - Germany, France, The UK, Spain, Italy, Russia, Netherlands, Rest of Europe, Asia-Pacific - China, Japan, South Korea, India, New Zealand, Singapore, Thailand, Vietnam, Rest of Asia Pacific, Latin America - Brazil, Mexico, Rest of Latin America, Middle East & Africa - South Africa, Saudi Arabia, UAE, Rest of Middle East & Africa Competitive Landscape Cargill Incorporated, Bunge Limited, Bühler AG, BASF SE, General Mills, Inc., Koninklijke DSM N.V., Wilmar International Ltd., Kohinoor Specialty Foods India Private Ltd., KRBL Limited, REI Agro Ltd., Freedom Foods Group Limited, LT Foods Customization Scope Customization for segments, region/country-level will be provided. Moreover, additional customization can be done based on the requirements. Purchase Options We have three licenses to opt for Single User License, Multi-User License (Up to 5 Users), Corporate Use License (Unlimited User and Printable PDF) -
- 1. Executive Summary
- 1.1. Definition
- 1.2. Taxonomy
- 1.3. Research Scope
- 1.4. Key Analysis
- 1.5. Key Findings by Major Segments
- 1.6. Top strategies by Major Players
- 2. Global Fortified Rice Market Overview
- 2.1. Fortified Rice Market Dynamics
- 2.1.1. Drivers
- 2.1.2. Opportunities
- 2.1.3. Restraints
- 2.1.4. Challenges
- 2.2. Macro-economic Factors
- 2.3. Regulatory Framework
- 2.4. Market Investment Feasibility Index
- 2.5. PEST Analysis
- 2.6. PORTER’S Five Force Analysis
- 2.7. Drivers & Restraints Impact Analysis
- 2.8. Industry Chain Analysis
- 2.9. Cost Structure Analysis
- 2.10. Marketing Strategy
- 2.11. Russia-Ukraine War Impact Analysis
- 2.12. Opportunity Map Analysis
- 2.13. Market Competition Scenario Analysis
- 2.14. Product Life Cycle Analysis
- 2.15. Opportunity Orbits
- 2.16. Manufacturer Intensity Map
- 2.17. Major Companies sales by Value & Volume
- 2.1. Fortified Rice Market Dynamics
- 3. Global Fortified Rice Market Analysis, Opportunity and Forecast, 2016-2032
- 3.1. Global Fortified Rice Market Analysis, 2016-2021
- 3.2. Global Fortified Rice Market Opportunity and Forecast, 2023-2032
- 3.3. Global Fortified Rice Market Analysis, Opportunity and Forecast, By By Nature, 2016-2032
- 3.3.1. Global Fortified Rice Market Analysis by By Nature: Introduction
- 3.3.2. Market Size Absolute $ Opportunity Analysis and Forecast, By By Nature, 2016-2032
- 3.3.3. Conventional
- 3.3.4. Organic
- 3.4. Global Fortified Rice Market Analysis, Opportunity and Forecast, By By Distribution Channel, 2016-2032
- 3.4.1. Global Fortified Rice Market Analysis by By Distribution Channel: Introduction
- 3.4.2. Market Size Absolute $ Opportunity Analysis and Forecast, By By Distribution Channel, 2016-2032
- 3.4.3. Offline
- 3.4.4. Online
- 3.5. Global Fortified Rice Market Analysis, Opportunity and Forecast, By By Ingredients, 2016-2032
- 3.5.1. Global Fortified Rice Market Analysis by By Ingredients: Introduction
- 3.5.2. Market Size Absolute $ Opportunity Analysis and Forecast, By By Ingredients, 2016-2032
- 3.5.3. Vitamins
- 3.5.4. Organic
- 3.5.5. Minerals
- 3.6. Global Fortified Rice Market Analysis, Opportunity and Forecast, By By Technology, 2016-2032
- 3.6.1. Global Fortified Rice Market Analysis by By Technology: Introduction
- 3.6.2. Market Size Absolute $ Opportunity Analysis and Forecast, By By Technology, 2016-2032
- 3.6.3. Coating & Encapsulation
- 3.6.4. Drying
- 3.6.5. Extrusion
- 3.6.6. Others
- 3.7. Global Fortified Rice Market Analysis, Opportunity and Forecast, By By End User, 2016-2032
- 3.7.1. Global Fortified Rice Market Analysis by By End User: Introduction
- 3.7.2. Market Size Absolute $ Opportunity Analysis and Forecast, By By End User, 2016-2032
- 3.7.3. Commercial
- 3.7.4. Residential
- 4. North America Fortified Rice Market Analysis, Opportunity and Forecast, 2016-2032
- 4.1. North America Fortified Rice Market Analysis, 2016-2021
- 4.2. North America Fortified Rice Market Opportunity and Forecast, 2023-2032
- 4.3. North America Fortified Rice Market Analysis, Opportunity and Forecast, By By Nature, 2016-2032
- 4.3.1. North America Fortified Rice Market Analysis by By Nature: Introduction
- 4.3.2. Market Size Absolute $ Opportunity Analysis and Forecast, By By Nature, 2016-2032
- 4.3.3. Conventional
- 4.3.4. Organic
- 4.4. North America Fortified Rice Market Analysis, Opportunity and Forecast, By By Distribution Channel, 2016-2032
- 4.4.1. North America Fortified Rice Market Analysis by By Distribution Channel: Introduction
- 4.4.2. Market Size Absolute $ Opportunity Analysis and Forecast, By By Distribution Channel, 2016-2032
- 4.4.3. Offline
- 4.4.4. Online
- 4.5. North America Fortified Rice Market Analysis, Opportunity and Forecast, By By Ingredients, 2016-2032
- 4.5.1. North America Fortified Rice Market Analysis by By Ingredients: Introduction
- 4.5.2. Market Size Absolute $ Opportunity Analysis and Forecast, By By Ingredients, 2016-2032
- 4.5.3. Vitamins
- 4.5.4. Organic
- 4.5.5. Minerals
- 4.6. North America Fortified Rice Market Analysis, Opportunity and Forecast, By By Technology, 2016-2032
- 4.6.1. North America Fortified Rice Market Analysis by By Technology: Introduction
- 4.6.2. Market Size Absolute $ Opportunity Analysis and Forecast, By By Technology, 2016-2032
- 4.6.3. Coating & Encapsulation
- 4.6.4. Drying
- 4.6.5. Extrusion
- 4.6.6. Others
- 4.7. North America Fortified Rice Market Analysis, Opportunity and Forecast, By By End User, 2016-2032
- 4.7.1. North America Fortified Rice Market Analysis by By End User: Introduction
- 4.7.2. Market Size Absolute $ Opportunity Analysis and Forecast, By By End User, 2016-2032
- 4.7.3. Commercial
- 4.7.4. Residential
- 4.8. North America Fortified Rice Market Analysis, Opportunity and Forecast, By Country , 2016-2032
- 4.8.1. North America Fortified Rice Market Analysis by Country : Introduction
- 4.8.2. Market Size Absolute $ Opportunity Analysis and Forecast, Country , 2016-2032
- 4.8.2.1. The US
- 4.8.2.2. Canada
- 4.8.2.3. Mexico
- 5. Western Europe Fortified Rice Market Analysis, Opportunity and Forecast, 2016-2032
- 5.1. Western Europe Fortified Rice Market Analysis, 2016-2021
- 5.2. Western Europe Fortified Rice Market Opportunity and Forecast, 2023-2032
- 5.3. Western Europe Fortified Rice Market Analysis, Opportunity and Forecast, By By Nature, 2016-2032
- 5.3.1. Western Europe Fortified Rice Market Analysis by By Nature: Introduction
- 5.3.2. Market Size Absolute $ Opportunity Analysis and Forecast, By By Nature, 2016-2032
- 5.3.3. Conventional
- 5.3.4. Organic
- 5.4. Western Europe Fortified Rice Market Analysis, Opportunity and Forecast, By By Distribution Channel, 2016-2032
- 5.4.1. Western Europe Fortified Rice Market Analysis by By Distribution Channel: Introduction
- 5.4.2. Market Size Absolute $ Opportunity Analysis and Forecast, By By Distribution Channel, 2016-2032
- 5.4.3. Offline
- 5.4.4. Online
- 5.5. Western Europe Fortified Rice Market Analysis, Opportunity and Forecast, By By Ingredients, 2016-2032
- 5.5.1. Western Europe Fortified Rice Market Analysis by By Ingredients: Introduction
- 5.5.2. Market Size Absolute $ Opportunity Analysis and Forecast, By By Ingredients, 2016-2032
- 5.5.3. Vitamins
- 5.5.4. Organic
- 5.5.5. Minerals
- 5.6. Western Europe Fortified Rice Market Analysis, Opportunity and Forecast, By By Technology, 2016-2032
- 5.6.1. Western Europe Fortified Rice Market Analysis by By Technology: Introduction
- 5.6.2. Market Size Absolute $ Opportunity Analysis and Forecast, By By Technology, 2016-2032
- 5.6.3. Coating & Encapsulation
- 5.6.4. Drying
- 5.6.5. Extrusion
- 5.6.6. Others
- 5.7. Western Europe Fortified Rice Market Analysis, Opportunity and Forecast, By By End User, 2016-2032
- 5.7.1. Western Europe Fortified Rice Market Analysis by By End User: Introduction
- 5.7.2. Market Size Absolute $ Opportunity Analysis and Forecast, By By End User, 2016-2032
- 5.7.3. Commercial
- 5.7.4. Residential
- 5.8. Western Europe Fortified Rice Market Analysis, Opportunity and Forecast, By Country , 2016-2032
- 5.8.1. Western Europe Fortified Rice Market Analysis by Country : Introduction
- 5.8.2. Market Size Absolute $ Opportunity Analysis and Forecast, Country , 2016-2032
- 5.8.2.1. Germany
- 5.8.2.2. France
- 5.8.2.3. The UK
- 5.8.2.4. Spain
- 5.8.2.5. Italy
- 5.8.2.6. Portugal
- 5.8.2.7. Ireland
- 5.8.2.8. Austria
- 5.8.2.9. Switzerland
- 5.8.2.10. Benelux
- 5.8.2.11. Nordic
- 5.8.2.12. Rest of Western Europe
- 6. Eastern Europe Fortified Rice Market Analysis, Opportunity and Forecast, 2016-2032
- 6.1. Eastern Europe Fortified Rice Market Analysis, 2016-2021
- 6.2. Eastern Europe Fortified Rice Market Opportunity and Forecast, 2023-2032
- 6.3. Eastern Europe Fortified Rice Market Analysis, Opportunity and Forecast, By By Nature, 2016-2032
- 6.3.1. Eastern Europe Fortified Rice Market Analysis by By Nature: Introduction
- 6.3.2. Market Size Absolute $ Opportunity Analysis and Forecast, By By Nature, 2016-2032
- 6.3.3. Conventional
- 6.3.4. Organic
- 6.4. Eastern Europe Fortified Rice Market Analysis, Opportunity and Forecast, By By Distribution Channel, 2016-2032
- 6.4.1. Eastern Europe Fortified Rice Market Analysis by By Distribution Channel: Introduction
- 6.4.2. Market Size Absolute $ Opportunity Analysis and Forecast, By By Distribution Channel, 2016-2032
- 6.4.3. Offline
- 6.4.4. Online
- 6.5. Eastern Europe Fortified Rice Market Analysis, Opportunity and Forecast, By By Ingredients, 2016-2032
- 6.5.1. Eastern Europe Fortified Rice Market Analysis by By Ingredients: Introduction
- 6.5.2. Market Size Absolute $ Opportunity Analysis and Forecast, By By Ingredients, 2016-2032
- 6.5.3. Vitamins
- 6.5.4. Organic
- 6.5.5. Minerals
- 6.6. Eastern Europe Fortified Rice Market Analysis, Opportunity and Forecast, By By Technology, 2016-2032
- 6.6.1. Eastern Europe Fortified Rice Market Analysis by By Technology: Introduction
- 6.6.2. Market Size Absolute $ Opportunity Analysis and Forecast, By By Technology, 2016-2032
- 6.6.3. Coating & Encapsulation
- 6.6.4. Drying
- 6.6.5. Extrusion
- 6.6.6. Others
- 6.7. Eastern Europe Fortified Rice Market Analysis, Opportunity and Forecast, By By End User, 2016-2032
- 6.7.1. Eastern Europe Fortified Rice Market Analysis by By End User: Introduction
- 6.7.2. Market Size Absolute $ Opportunity Analysis and Forecast, By By End User, 2016-2032
- 6.7.3. Commercial
- 6.7.4. Residential
- 6.8. Eastern Europe Fortified Rice Market Analysis, Opportunity and Forecast, By Country , 2016-2032
- 6.8.1. Eastern Europe Fortified Rice Market Analysis by Country : Introduction
- 6.8.2. Market Size Absolute $ Opportunity Analysis and Forecast, Country , 2016-2032
- 6.8.2.1. Russia
- 6.8.2.2. Poland
- 6.8.2.3. The Czech Republic
- 6.8.2.4. Greece
- 6.8.2.5. Rest of Eastern Europe
- 7. APAC Fortified Rice Market Analysis, Opportunity and Forecast, 2016-2032
- 7.1. APAC Fortified Rice Market Analysis, 2016-2021
- 7.2. APAC Fortified Rice Market Opportunity and Forecast, 2023-2032
- 7.3. APAC Fortified Rice Market Analysis, Opportunity and Forecast, By By Nature, 2016-2032
- 7.3.1. APAC Fortified Rice Market Analysis by By Nature: Introduction
- 7.3.2. Market Size Absolute $ Opportunity Analysis and Forecast, By By Nature, 2016-2032
- 7.3.3. Conventional
- 7.3.4. Organic
- 7.4. APAC Fortified Rice Market Analysis, Opportunity and Forecast, By By Distribution Channel, 2016-2032
- 7.4.1. APAC Fortified Rice Market Analysis by By Distribution Channel: Introduction
- 7.4.2. Market Size Absolute $ Opportunity Analysis and Forecast, By By Distribution Channel, 2016-2032
- 7.4.3. Offline
- 7.4.4. Online
- 7.5. APAC Fortified Rice Market Analysis, Opportunity and Forecast, By By Ingredients, 2016-2032
- 7.5.1. APAC Fortified Rice Market Analysis by By Ingredients: Introduction
- 7.5.2. Market Size Absolute $ Opportunity Analysis and Forecast, By By Ingredients, 2016-2032
- 7.5.3. Vitamins
- 7.5.4. Organic
- 7.5.5. Minerals
- 7.6. APAC Fortified Rice Market Analysis, Opportunity and Forecast, By By Technology, 2016-2032
- 7.6.1. APAC Fortified Rice Market Analysis by By Technology: Introduction
- 7.6.2. Market Size Absolute $ Opportunity Analysis and Forecast, By By Technology, 2016-2032
- 7.6.3. Coating & Encapsulation
- 7.6.4. Drying
- 7.6.5. Extrusion
- 7.6.6. Others
- 7.7. APAC Fortified Rice Market Analysis, Opportunity and Forecast, By By End User, 2016-2032
- 7.7.1. APAC Fortified Rice Market Analysis by By End User: Introduction
- 7.7.2. Market Size Absolute $ Opportunity Analysis and Forecast, By By End User, 2016-2032
- 7.7.3. Commercial
- 7.7.4. Residential
- 7.8. APAC Fortified Rice Market Analysis, Opportunity and Forecast, By Country , 2016-2032
- 7.8.1. APAC Fortified Rice Market Analysis by Country : Introduction
- 7.8.2. Market Size Absolute $ Opportunity Analysis and Forecast, Country , 2016-2032
- 7.8.2.1. China
- 7.8.2.2. Japan
- 7.8.2.3. South Korea
- 7.8.2.4. India
- 7.8.2.5. Australia & New Zeland
- 7.8.2.6. Indonesia
- 7.8.2.7. Malaysia
- 7.8.2.8. Philippines
- 7.8.2.9. Singapore
- 7.8.2.10. Thailand
- 7.8.2.11. Vietnam
- 7.8.2.12. Rest of APAC
- 8. Latin America Fortified Rice Market Analysis, Opportunity and Forecast, 2016-2032
- 8.1. Latin America Fortified Rice Market Analysis, 2016-2021
- 8.2. Latin America Fortified Rice Market Opportunity and Forecast, 2023-2032
- 8.3. Latin America Fortified Rice Market Analysis, Opportunity and Forecast, By By Nature, 2016-2032
- 8.3.1. Latin America Fortified Rice Market Analysis by By Nature: Introduction
- 8.3.2. Market Size Absolute $ Opportunity Analysis and Forecast, By By Nature, 2016-2032
- 8.3.3. Conventional
- 8.3.4. Organic
- 8.4. Latin America Fortified Rice Market Analysis, Opportunity and Forecast, By By Distribution Channel, 2016-2032
- 8.4.1. Latin America Fortified Rice Market Analysis by By Distribution Channel: Introduction
- 8.4.2. Market Size Absolute $ Opportunity Analysis and Forecast, By By Distribution Channel, 2016-2032
- 8.4.3. Offline
- 8.4.4. Online
- 8.5. Latin America Fortified Rice Market Analysis, Opportunity and Forecast, By By Ingredients, 2016-2032
- 8.5.1. Latin America Fortified Rice Market Analysis by By Ingredients: Introduction
- 8.5.2. Market Size Absolute $ Opportunity Analysis and Forecast, By By Ingredients, 2016-2032
- 8.5.3. Vitamins
- 8.5.4. Organic
- 8.5.5. Minerals
- 8.6. Latin America Fortified Rice Market Analysis, Opportunity and Forecast, By By Technology, 2016-2032
- 8.6.1. Latin America Fortified Rice Market Analysis by By Technology: Introduction
- 8.6.2. Market Size Absolute $ Opportunity Analysis and Forecast, By By Technology, 2016-2032
- 8.6.3. Coating & Encapsulation
- 8.6.4. Drying
- 8.6.5. Extrusion
- 8.6.6. Others
- 8.7. Latin America Fortified Rice Market Analysis, Opportunity and Forecast, By By End User, 2016-2032
- 8.7.1. Latin America Fortified Rice Market Analysis by By End User: Introduction
- 8.7.2. Market Size Absolute $ Opportunity Analysis and Forecast, By By End User, 2016-2032
- 8.7.3. Commercial
- 8.7.4. Residential
- 8.8. Latin America Fortified Rice Market Analysis, Opportunity and Forecast, By Country , 2016-2032
- 8.8.1. Latin America Fortified Rice Market Analysis by Country : Introduction
- 8.8.2. Market Size Absolute $ Opportunity Analysis and Forecast, Country , 2016-2032
- 8.8.2.1. Brazil
- 8.8.2.2. Colombia
- 8.8.2.3. Chile
- 8.8.2.4. Argentina
- 8.8.2.5. Costa Rica
- 8.8.2.6. Rest of Latin America
- 9. Middle East & Africa Fortified Rice Market Analysis, Opportunity and Forecast, 2016-2032
- 9.1. Middle East & Africa Fortified Rice Market Analysis, 2016-2021
- 9.2. Middle East & Africa Fortified Rice Market Opportunity and Forecast, 2023-2032
- 9.3. Middle East & Africa Fortified Rice Market Analysis, Opportunity and Forecast, By By Nature, 2016-2032
- 9.3.1. Middle East & Africa Fortified Rice Market Analysis by By Nature: Introduction
- 9.3.2. Market Size Absolute $ Opportunity Analysis and Forecast, By By Nature, 2016-2032
- 9.3.3. Conventional
- 9.3.4. Organic
- 9.4. Middle East & Africa Fortified Rice Market Analysis, Opportunity and Forecast, By By Distribution Channel, 2016-2032
- 9.4.1. Middle East & Africa Fortified Rice Market Analysis by By Distribution Channel: Introduction
- 9.4.2. Market Size Absolute $ Opportunity Analysis and Forecast, By By Distribution Channel, 2016-2032
- 9.4.3. Offline
- 9.4.4. Online
- 9.5. Middle East & Africa Fortified Rice Market Analysis, Opportunity and Forecast, By By Ingredients, 2016-2032
- 9.5.1. Middle East & Africa Fortified Rice Market Analysis by By Ingredients: Introduction
- 9.5.2. Market Size Absolute $ Opportunity Analysis and Forecast, By By Ingredients, 2016-2032
- 9.5.3. Vitamins
- 9.5.4. Organic
- 9.5.5. Minerals
- 9.6. Middle East & Africa Fortified Rice Market Analysis, Opportunity and Forecast, By By Technology, 2016-2032
- 9.6.1. Middle East & Africa Fortified Rice Market Analysis by By Technology: Introduction
- 9.6.2. Market Size Absolute $ Opportunity Analysis and Forecast, By By Technology, 2016-2032
- 9.6.3. Coating & Encapsulation
- 9.6.4. Drying
- 9.6.5. Extrusion
- 9.6.6. Others
- 9.7. Middle East & Africa Fortified Rice Market Analysis, Opportunity and Forecast, By By End User, 2016-2032
- 9.7.1. Middle East & Africa Fortified Rice Market Analysis by By End User: Introduction
- 9.7.2. Market Size Absolute $ Opportunity Analysis and Forecast, By By End User, 2016-2032
- 9.7.3. Commercial
- 9.7.4. Residential
- 9.8. Middle East & Africa Fortified Rice Market Analysis, Opportunity and Forecast, By Country , 2016-2032
- 9.8.1. Middle East & Africa Fortified Rice Market Analysis by Country : Introduction
- 9.8.2. Market Size Absolute $ Opportunity Analysis and Forecast, Country , 2016-2032
- 9.8.2.1. Algeria
- 9.8.2.2. Egypt
- 9.8.2.3. Israel
- 9.8.2.4. Kuwait
- 9.8.2.5. Nigeria
- 9.8.2.6. Saudi Arabia
- 9.8.2.7. South Africa
- 9.8.2.8. Turkey
- 9.8.2.9. The UAE
- 9.8.2.10. Rest of MEA
- 10. Global Fortified Rice Market Analysis, Opportunity and Forecast, By Region , 2016-2032
- 10.1. Global Fortified Rice Market Analysis by Region : Introduction
- 10.2. Market Size Absolute $ Opportunity Analysis and Forecast, By Region , 2016-2032
- 10.2.1. North America
- 10.2.2. Western Europe
- 10.2.3. Eastern Europe
- 10.2.4. APAC
- 10.2.5. Latin America
- 10.2.6. Middle East & Africa
- 11. Global Fortified Rice Market Competitive Landscape, Market Share Analysis, and Company Profiles
- 11.1. Market Share Analysis
- 11.2. Company Profiles
- 11.3. Cargill Incorporated
- 11.3.1. Company Overview
- 11.3.2. Financial Highlights
- 11.3.3. Product Portfolio
- 11.3.4. SWOT Analysis
- 11.3.5. Key Strategies and Developments
- 11.4. Bunge Limited
- 11.4.1. Company Overview
- 11.4.2. Financial Highlights
- 11.4.3. Product Portfolio
- 11.4.4. SWOT Analysis
- 11.4.5. Key Strategies and Developments
- 11.5. Bühler AG
- 11.5.1. Company Overview
- 11.5.2. Financial Highlights
- 11.5.3. Product Portfolio
- 11.5.4. SWOT Analysis
- 11.5.5. Key Strategies and Developments
- 11.6. BASF SE
- 11.6.1. Company Overview
- 11.6.2. Financial Highlights
- 11.6.3. Product Portfolio
- 11.6.4. SWOT Analysis
- 11.6.5. Key Strategies and Developments
- 11.7. General Mills, Inc.
- 11.7.1. Company Overview
- 11.7.2. Financial Highlights
- 11.7.3. Product Portfolio
- 11.7.4. SWOT Analysis
- 11.7.5. Key Strategies and Developments
- 11.8. Koninklijke DSM N.V.
- 11.8.1. Company Overview
- 11.8.2. Financial Highlights
- 11.8.3. Product Portfolio
- 11.8.4. SWOT Analysis
- 11.8.5. Key Strategies and Developments
- 11.9. Wilmar International Ltd.
- 11.9.1. Company Overview
- 11.9.2. Financial Highlights
- 11.9.3. Product Portfolio
- 11.9.4. SWOT Analysis
- 11.9.5. Key Strategies and Developments
- 11.10. Kohinoor Specialty Foods India Private Ltd.
- 11.10.1. Company Overview
- 11.10.2. Financial Highlights
- 11.10.3. Product Portfolio
- 11.10.4. SWOT Analysis
- 11.10.5. Key Strategies and Developments
- 11.11. KRBL Limited
- 11.11.1. Company Overview
- 11.11.2. Financial Highlights
- 11.11.3. Product Portfolio
- 11.11.4. SWOT Analysis
- 11.11.5. Key Strategies and Developments
- 11.12. REI Agro Ltd.
- 11.12.1. Company Overview
- 11.12.2. Financial Highlights
- 11.12.3. Product Portfolio
- 11.12.4. SWOT Analysis
- 11.12.5. Key Strategies and Developments
- 11.13.1. Company Overview
- 11.13.2. Financial Highlights
- 11.13.3. Product Portfolio
- 11.13.4. SWOT Analysis
- 11.13.5. Key Strategies and Developments
- 11.14. Freedom Foods Group Limited
- 11.14.1. Company Overview
- 11.14.2. Financial Highlights
- 11.14.3. Product Portfolio
- 11.14.4. SWOT Analysis
- 11.14.5. Key Strategies and Developments
- 12. Assumptions and Acronyms
- 13. Research Methodology
- 14. Contact
"
- List of Figures
- "
- Figure 1: Global Fortified Rice Market Revenue (US$ Mn) Market Share by By Nature in 2022
- Figure 2: Global Fortified Rice Market Market Attractiveness Analysis by By Nature, 2016-2032
- Figure 3: Global Fortified Rice Market Revenue (US$ Mn) Market Share by By Distribution Channelin 2022
- Figure 4: Global Fortified Rice Market Market Attractiveness Analysis by By Distribution Channel, 2016-2032
- Figure 5: Global Fortified Rice Market Revenue (US$ Mn) Market Share by By Ingredientsin 2022
- Figure 6: Global Fortified Rice Market Market Attractiveness Analysis by By Ingredients, 2016-2032
- Figure 7: Global Fortified Rice Market Revenue (US$ Mn) Market Share by By Technologyin 2022
- Figure 8: Global Fortified Rice Market Market Attractiveness Analysis by By Technology, 2016-2032
- Figure 9: Global Fortified Rice Market Revenue (US$ Mn) Market Share by By End Userin 2022
- Figure 10: Global Fortified Rice Market Market Attractiveness Analysis by By End User, 2016-2032
- Figure 11: Global Fortified Rice Market Revenue (US$ Mn) Market Share by Region in 2022
- Figure 12: Global Fortified Rice Market Market Attractiveness Analysis by Region, 2016-2032
- Figure 13: Global Fortified Rice Market Market Revenue (US$ Mn) (2016-2032)
- Figure 14: Global Fortified Rice Market Market Revenue (US$ Mn) Comparison by Region (2016-2032)
- Figure 15: Global Fortified Rice Market Market Revenue (US$ Mn) Comparison by By Nature (2016-2032)
- Figure 16: Global Fortified Rice Market Market Revenue (US$ Mn) Comparison by By Distribution Channel (2016-2032)
- Figure 17: Global Fortified Rice Market Market Revenue (US$ Mn) Comparison by By Ingredients (2016-2032)
- Figure 18: Global Fortified Rice Market Market Revenue (US$ Mn) Comparison by By Technology (2016-2032)
- Figure 19: Global Fortified Rice Market Market Revenue (US$ Mn) Comparison by By End User (2016-2032)
- Figure 20: Global Fortified Rice Market Market Y-o-Y Growth Rate Comparison by Region (2016-2032)
- Figure 21: Global Fortified Rice Market Market Y-o-Y Growth Rate Comparison by By Nature (2016-2032)
- Figure 22: Global Fortified Rice Market Market Y-o-Y Growth Rate Comparison by By Distribution Channel (2016-2032)
- Figure 23: Global Fortified Rice Market Market Y-o-Y Growth Rate Comparison by By Ingredients (2016-2032)
- Figure 24: Global Fortified Rice Market Market Y-o-Y Growth Rate Comparison by By Technology (2016-2032)
- Figure 25: Global Fortified Rice Market Market Y-o-Y Growth Rate Comparison by By End User (2016-2032)
- Figure 26: Global Fortified Rice Market Market Share Comparison by Region (2016-2032)
- Figure 27: Global Fortified Rice Market Market Share Comparison by By Nature (2016-2032)
- Figure 28: Global Fortified Rice Market Market Share Comparison by By Distribution Channel (2016-2032)
- Figure 29: Global Fortified Rice Market Market Share Comparison by By Ingredients (2016-2032)
- Figure 30: Global Fortified Rice Market Market Share Comparison by By Technology (2016-2032)
- Figure 31: Global Fortified Rice Market Market Share Comparison by By End User (2016-2032)
- Figure 32: North America Fortified Rice Market Revenue (US$ Mn) Market Share by By Naturein 2022
- Figure 33: North America Fortified Rice Market Market Attractiveness Analysis by By Nature, 2016-2032
- Figure 34: North America Fortified Rice Market Revenue (US$ Mn) Market Share by By Distribution Channelin 2022
- Figure 35: North America Fortified Rice Market Market Attractiveness Analysis by By Distribution Channel, 2016-2032
- Figure 36: North America Fortified Rice Market Revenue (US$ Mn) Market Share by By Ingredientsin 2022
- Figure 37: North America Fortified Rice Market Market Attractiveness Analysis by By Ingredients, 2016-2032
- Figure 38: North America Fortified Rice Market Revenue (US$ Mn) Market Share by By Technologyin 2022
- Figure 39: North America Fortified Rice Market Market Attractiveness Analysis by By Technology, 2016-2032
- Figure 40: North America Fortified Rice Market Revenue (US$ Mn) Market Share by By End Userin 2022
- Figure 41: North America Fortified Rice Market Market Attractiveness Analysis by By End User, 2016-2032
- Figure 42: North America Fortified Rice Market Revenue (US$ Mn) Market Share by Country in 2022
- Figure 43: North America Fortified Rice Market Market Attractiveness Analysis by Country, 2016-2032
- Figure 44: North America Fortified Rice Market Market Revenue (US$ Mn) (2016-2032)
- Figure 45: North America Fortified Rice Market Market Revenue (US$ Mn) Comparison by Country (2016-2032)
- Figure 46: North America Fortified Rice Market Market Revenue (US$ Mn) Comparison by By Nature (2016-2032)
- Figure 47: North America Fortified Rice Market Market Revenue (US$ Mn) Comparison by By Distribution Channel (2016-2032)
- Figure 48: North America Fortified Rice Market Market Revenue (US$ Mn) Comparison by By Ingredients (2016-2032)
- Figure 49: North America Fortified Rice Market Market Revenue (US$ Mn) Comparison by By Technology (2016-2032)
- Figure 50: North America Fortified Rice Market Market Revenue (US$ Mn) Comparison by By End User (2016-2032)
- Figure 51: North America Fortified Rice Market Market Y-o-Y Growth Rate Comparison by Country (2016-2032)
- Figure 52: North America Fortified Rice Market Market Y-o-Y Growth Rate Comparison by By Nature (2016-2032)
- Figure 53: North America Fortified Rice Market Market Y-o-Y Growth Rate Comparison by By Distribution Channel (2016-2032)
- Figure 54: North America Fortified Rice Market Market Y-o-Y Growth Rate Comparison by By Ingredients (2016-2032)
- Figure 55: North America Fortified Rice Market Market Y-o-Y Growth Rate Comparison by By Technology (2016-2032)
- Figure 56: North America Fortified Rice Market Market Y-o-Y Growth Rate Comparison by By End User (2016-2032)
- Figure 57: North America Fortified Rice Market Market Share Comparison by Country (2016-2032)
- Figure 58: North America Fortified Rice Market Market Share Comparison by By Nature (2016-2032)
- Figure 59: North America Fortified Rice Market Market Share Comparison by By Distribution Channel (2016-2032)
- Figure 60: North America Fortified Rice Market Market Share Comparison by By Ingredients (2016-2032)
- Figure 61: North America Fortified Rice Market Market Share Comparison by By Technology (2016-2032)
- Figure 62: North America Fortified Rice Market Market Share Comparison by By End User (2016-2032)
- Figure 63: Western Europe Fortified Rice Market Revenue (US$ Mn) Market Share by By Naturein 2022
- Figure 64: Western Europe Fortified Rice Market Market Attractiveness Analysis by By Nature, 2016-2032
- Figure 65: Western Europe Fortified Rice Market Revenue (US$ Mn) Market Share by By Distribution Channelin 2022
- Figure 66: Western Europe Fortified Rice Market Market Attractiveness Analysis by By Distribution Channel, 2016-2032
- Figure 67: Western Europe Fortified Rice Market Revenue (US$ Mn) Market Share by By Ingredientsin 2022
- Figure 68: Western Europe Fortified Rice Market Market Attractiveness Analysis by By Ingredients, 2016-2032
- Figure 69: Western Europe Fortified Rice Market Revenue (US$ Mn) Market Share by By Technologyin 2022
- Figure 70: Western Europe Fortified Rice Market Market Attractiveness Analysis by By Technology, 2016-2032
- Figure 71: Western Europe Fortified Rice Market Revenue (US$ Mn) Market Share by By End Userin 2022
- Figure 72: Western Europe Fortified Rice Market Market Attractiveness Analysis by By End User, 2016-2032
- Figure 73: Western Europe Fortified Rice Market Revenue (US$ Mn) Market Share by Country in 2022
- Figure 74: Western Europe Fortified Rice Market Market Attractiveness Analysis by Country, 2016-2032
- Figure 75: Western Europe Fortified Rice Market Market Revenue (US$ Mn) (2016-2032)
- Figure 76: Western Europe Fortified Rice Market Market Revenue (US$ Mn) Comparison by Country (2016-2032)
- Figure 77: Western Europe Fortified Rice Market Market Revenue (US$ Mn) Comparison by By Nature (2016-2032)
- Figure 78: Western Europe Fortified Rice Market Market Revenue (US$ Mn) Comparison by By Distribution Channel (2016-2032)
- Figure 79: Western Europe Fortified Rice Market Market Revenue (US$ Mn) Comparison by By Ingredients (2016-2032)
- Figure 80: Western Europe Fortified Rice Market Market Revenue (US$ Mn) Comparison by By Technology (2016-2032)
- Figure 81: Western Europe Fortified Rice Market Market Revenue (US$ Mn) Comparison by By End User (2016-2032)
- Figure 82: Western Europe Fortified Rice Market Market Y-o-Y Growth Rate Comparison by Country (2016-2032)
- Figure 83: Western Europe Fortified Rice Market Market Y-o-Y Growth Rate Comparison by By Nature (2016-2032)
- Figure 84: Western Europe Fortified Rice Market Market Y-o-Y Growth Rate Comparison by By Distribution Channel (2016-2032)
- Figure 85: Western Europe Fortified Rice Market Market Y-o-Y Growth Rate Comparison by By Ingredients (2016-2032)
- Figure 86: Western Europe Fortified Rice Market Market Y-o-Y Growth Rate Comparison by By Technology (2016-2032)
- Figure 87: Western Europe Fortified Rice Market Market Y-o-Y Growth Rate Comparison by By End User (2016-2032)
- Figure 88: Western Europe Fortified Rice Market Market Share Comparison by Country (2016-2032)
- Figure 89: Western Europe Fortified Rice Market Market Share Comparison by By Nature (2016-2032)
- Figure 90: Western Europe Fortified Rice Market Market Share Comparison by By Distribution Channel (2016-2032)
- Figure 91: Western Europe Fortified Rice Market Market Share Comparison by By Ingredients (2016-2032)
- Figure 92: Western Europe Fortified Rice Market Market Share Comparison by By Technology (2016-2032)
- Figure 93: Western Europe Fortified Rice Market Market Share Comparison by By End User (2016-2032)
- Figure 94: Eastern Europe Fortified Rice Market Revenue (US$ Mn) Market Share by By Naturein 2022
- Figure 95: Eastern Europe Fortified Rice Market Market Attractiveness Analysis by By Nature, 2016-2032
- Figure 96: Eastern Europe Fortified Rice Market Revenue (US$ Mn) Market Share by By Distribution Channelin 2022
- Figure 97: Eastern Europe Fortified Rice Market Market Attractiveness Analysis by By Distribution Channel, 2016-2032
- Figure 98: Eastern Europe Fortified Rice Market Revenue (US$ Mn) Market Share by By Ingredientsin 2022
- Figure 99: Eastern Europe Fortified Rice Market Market Attractiveness Analysis by By Ingredients, 2016-2032
- Figure 100: Eastern Europe Fortified Rice Market Revenue (US$ Mn) Market Share by By Technologyin 2022
- Figure 101: Eastern Europe Fortified Rice Market Market Attractiveness Analysis by By Technology, 2016-2032
- Figure 102: Eastern Europe Fortified Rice Market Revenue (US$ Mn) Market Share by By End Userin 2022
- Figure 103: Eastern Europe Fortified Rice Market Market Attractiveness Analysis by By End User, 2016-2032
- Figure 104: Eastern Europe Fortified Rice Market Revenue (US$ Mn) Market Share by Country in 2022
- Figure 105: Eastern Europe Fortified Rice Market Market Attractiveness Analysis by Country, 2016-2032
- Figure 106: Eastern Europe Fortified Rice Market Market Revenue (US$ Mn) (2016-2032)
- Figure 107: Eastern Europe Fortified Rice Market Market Revenue (US$ Mn) Comparison by Country (2016-2032)
- Figure 108: Eastern Europe Fortified Rice Market Market Revenue (US$ Mn) Comparison by By Nature (2016-2032)
- Figure 109: Eastern Europe Fortified Rice Market Market Revenue (US$ Mn) Comparison by By Distribution Channel (2016-2032)
- Figure 110: Eastern Europe Fortified Rice Market Market Revenue (US$ Mn) Comparison by By Ingredients (2016-2032)
- Figure 111: Eastern Europe Fortified Rice Market Market Revenue (US$ Mn) Comparison by By Technology (2016-2032)
- Figure 112: Eastern Europe Fortified Rice Market Market Revenue (US$ Mn) Comparison by By End User (2016-2032)
- Figure 113: Eastern Europe Fortified Rice Market Market Y-o-Y Growth Rate Comparison by Country (2016-2032)
- Figure 114: Eastern Europe Fortified Rice Market Market Y-o-Y Growth Rate Comparison by By Nature (2016-2032)
- Figure 115: Eastern Europe Fortified Rice Market Market Y-o-Y Growth Rate Comparison by By Distribution Channel (2016-2032)
- Figure 116: Eastern Europe Fortified Rice Market Market Y-o-Y Growth Rate Comparison by By Ingredients (2016-2032)
- Figure 117: Eastern Europe Fortified Rice Market Market Y-o-Y Growth Rate Comparison by By Technology (2016-2032)
- Figure 118: Eastern Europe Fortified Rice Market Market Y-o-Y Growth Rate Comparison by By End User (2016-2032)
- Figure 119: Eastern Europe Fortified Rice Market Market Share Comparison by Country (2016-2032)
- Figure 120: Eastern Europe Fortified Rice Market Market Share Comparison by By Nature (2016-2032)
- Figure 121: Eastern Europe Fortified Rice Market Market Share Comparison by By Distribution Channel (2016-2032)
- Figure 122: Eastern Europe Fortified Rice Market Market Share Comparison by By Ingredients (2016-2032)
- Figure 123: Eastern Europe Fortified Rice Market Market Share Comparison by By Technology (2016-2032)
- Figure 124: Eastern Europe Fortified Rice Market Market Share Comparison by By End User (2016-2032)
- Figure 125: APAC Fortified Rice Market Revenue (US$ Mn) Market Share by By Naturein 2022
- Figure 126: APAC Fortified Rice Market Market Attractiveness Analysis by By Nature, 2016-2032
- Figure 127: APAC Fortified Rice Market Revenue (US$ Mn) Market Share by By Distribution Channelin 2022
- Figure 128: APAC Fortified Rice Market Market Attractiveness Analysis by By Distribution Channel, 2016-2032
- Figure 129: APAC Fortified Rice Market Revenue (US$ Mn) Market Share by By Ingredientsin 2022
- Figure 130: APAC Fortified Rice Market Market Attractiveness Analysis by By Ingredients, 2016-2032
- Figure 131: APAC Fortified Rice Market Revenue (US$ Mn) Market Share by By Technologyin 2022
- Figure 132: APAC Fortified Rice Market Market Attractiveness Analysis by By Technology, 2016-2032
- Figure 133: APAC Fortified Rice Market Revenue (US$ Mn) Market Share by By End Userin 2022
- Figure 134: APAC Fortified Rice Market Market Attractiveness Analysis by By End User, 2016-2032
- Figure 135: APAC Fortified Rice Market Revenue (US$ Mn) Market Share by Country in 2022
- Figure 136: APAC Fortified Rice Market Market Attractiveness Analysis by Country, 2016-2032
- Figure 137: APAC Fortified Rice Market Market Revenue (US$ Mn) (2016-2032)
- Figure 138: APAC Fortified Rice Market Market Revenue (US$ Mn) Comparison by Country (2016-2032)
- Figure 139: APAC Fortified Rice Market Market Revenue (US$ Mn) Comparison by By Nature (2016-2032)
- Figure 140: APAC Fortified Rice Market Market Revenue (US$ Mn) Comparison by By Distribution Channel (2016-2032)
- Figure 141: APAC Fortified Rice Market Market Revenue (US$ Mn) Comparison by By Ingredients (2016-2032)
- Figure 142: APAC Fortified Rice Market Market Revenue (US$ Mn) Comparison by By Technology (2016-2032)
- Figure 143: APAC Fortified Rice Market Market Revenue (US$ Mn) Comparison by By End User (2016-2032)
- Figure 144: APAC Fortified Rice Market Market Y-o-Y Growth Rate Comparison by Country (2016-2032)
- Figure 145: APAC Fortified Rice Market Market Y-o-Y Growth Rate Comparison by By Nature (2016-2032)
- Figure 146: APAC Fortified Rice Market Market Y-o-Y Growth Rate Comparison by By Distribution Channel (2016-2032)
- Figure 147: APAC Fortified Rice Market Market Y-o-Y Growth Rate Comparison by By Ingredients (2016-2032)
- Figure 148: APAC Fortified Rice Market Market Y-o-Y Growth Rate Comparison by By Technology (2016-2032)
- Figure 149: APAC Fortified Rice Market Market Y-o-Y Growth Rate Comparison by By End User (2016-2032)
- Figure 150: APAC Fortified Rice Market Market Share Comparison by Country (2016-2032)
- Figure 151: APAC Fortified Rice Market Market Share Comparison by By Nature (2016-2032)
- Figure 152: APAC Fortified Rice Market Market Share Comparison by By Distribution Channel (2016-2032)
- Figure 153: APAC Fortified Rice Market Market Share Comparison by By Ingredients (2016-2032)
- Figure 154: APAC Fortified Rice Market Market Share Comparison by By Technology (2016-2032)
- Figure 155: APAC Fortified Rice Market Market Share Comparison by By End User (2016-2032)
- Figure 156: Latin America Fortified Rice Market Revenue (US$ Mn) Market Share by By Naturein 2022
- Figure 157: Latin America Fortified Rice Market Market Attractiveness Analysis by By Nature, 2016-2032
- Figure 158: Latin America Fortified Rice Market Revenue (US$ Mn) Market Share by By Distribution Channelin 2022
- Figure 159: Latin America Fortified Rice Market Market Attractiveness Analysis by By Distribution Channel, 2016-2032
- Figure 160: Latin America Fortified Rice Market Revenue (US$ Mn) Market Share by By Ingredientsin 2022
- Figure 161: Latin America Fortified Rice Market Market Attractiveness Analysis by By Ingredients, 2016-2032
- Figure 162: Latin America Fortified Rice Market Revenue (US$ Mn) Market Share by By Technologyin 2022
- Figure 163: Latin America Fortified Rice Market Market Attractiveness Analysis by By Technology, 2016-2032
- Figure 164: Latin America Fortified Rice Market Revenue (US$ Mn) Market Share by By End Userin 2022
- Figure 165: Latin America Fortified Rice Market Market Attractiveness Analysis by By End User, 2016-2032
- Figure 166: Latin America Fortified Rice Market Revenue (US$ Mn) Market Share by Country in 2022
- Figure 167: Latin America Fortified Rice Market Market Attractiveness Analysis by Country, 2016-2032
- Figure 168: Latin America Fortified Rice Market Market Revenue (US$ Mn) (2016-2032)
- Figure 169: Latin America Fortified Rice Market Market Revenue (US$ Mn) Comparison by Country (2016-2032)
- Figure 170: Latin America Fortified Rice Market Market Revenue (US$ Mn) Comparison by By Nature (2016-2032)
- Figure 171: Latin America Fortified Rice Market Market Revenue (US$ Mn) Comparison by By Distribution Channel (2016-2032)
- Figure 172: Latin America Fortified Rice Market Market Revenue (US$ Mn) Comparison by By Ingredients (2016-2032)
- Figure 173: Latin America Fortified Rice Market Market Revenue (US$ Mn) Comparison by By Technology (2016-2032)
- Figure 174: Latin America Fortified Rice Market Market Revenue (US$ Mn) Comparison by By End User (2016-2032)
- Figure 175: Latin America Fortified Rice Market Market Y-o-Y Growth Rate Comparison by Country (2016-2032)
- Figure 176: Latin America Fortified Rice Market Market Y-o-Y Growth Rate Comparison by By Nature (2016-2032)
- Figure 177: Latin America Fortified Rice Market Market Y-o-Y Growth Rate Comparison by By Distribution Channel (2016-2032)
- Figure 178: Latin America Fortified Rice Market Market Y-o-Y Growth Rate Comparison by By Ingredients (2016-2032)
- Figure 179: Latin America Fortified Rice Market Market Y-o-Y Growth Rate Comparison by By Technology (2016-2032)
- Figure 180: Latin America Fortified Rice Market Market Y-o-Y Growth Rate Comparison by By End User (2016-2032)
- Figure 181: Latin America Fortified Rice Market Market Share Comparison by Country (2016-2032)
- Figure 182: Latin America Fortified Rice Market Market Share Comparison by By Nature (2016-2032)
- Figure 183: Latin America Fortified Rice Market Market Share Comparison by By Distribution Channel (2016-2032)
- Figure 184: Latin America Fortified Rice Market Market Share Comparison by By Ingredients (2016-2032)
- Figure 185: Latin America Fortified Rice Market Market Share Comparison by By Technology (2016-2032)
- Figure 186: Latin America Fortified Rice Market Market Share Comparison by By End User (2016-2032)
- Figure 187: Middle East & Africa Fortified Rice Market Revenue (US$ Mn) Market Share by By Naturein 2022
- Figure 188: Middle East & Africa Fortified Rice Market Market Attractiveness Analysis by By Nature, 2016-2032
- Figure 189: Middle East & Africa Fortified Rice Market Revenue (US$ Mn) Market Share by By Distribution Channelin 2022
- Figure 190: Middle East & Africa Fortified Rice Market Market Attractiveness Analysis by By Distribution Channel, 2016-2032
- Figure 191: Middle East & Africa Fortified Rice Market Revenue (US$ Mn) Market Share by By Ingredientsin 2022
- Figure 192: Middle East & Africa Fortified Rice Market Market Attractiveness Analysis by By Ingredients, 2016-2032
- Figure 193: Middle East & Africa Fortified Rice Market Revenue (US$ Mn) Market Share by By Technologyin 2022
- Figure 194: Middle East & Africa Fortified Rice Market Market Attractiveness Analysis by By Technology, 2016-2032
- Figure 195: Middle East & Africa Fortified Rice Market Revenue (US$ Mn) Market Share by By End Userin 2022
- Figure 196: Middle East & Africa Fortified Rice Market Market Attractiveness Analysis by By End User, 2016-2032
- Figure 197: Middle East & Africa Fortified Rice Market Revenue (US$ Mn) Market Share by Country in 2022
- Figure 198: Middle East & Africa Fortified Rice Market Market Attractiveness Analysis by Country, 2016-2032
- Figure 199: Middle East & Africa Fortified Rice Market Market Revenue (US$ Mn) (2016-2032)
- Figure 200: Middle East & Africa Fortified Rice Market Market Revenue (US$ Mn) Comparison by Country (2016-2032)
- Figure 201: Middle East & Africa Fortified Rice Market Market Revenue (US$ Mn) Comparison by By Nature (2016-2032)
- Figure 202: Middle East & Africa Fortified Rice Market Market Revenue (US$ Mn) Comparison by By Distribution Channel (2016-2032)
- Figure 203: Middle East & Africa Fortified Rice Market Market Revenue (US$ Mn) Comparison by By Ingredients (2016-2032)
- Figure 204: Middle East & Africa Fortified Rice Market Market Revenue (US$ Mn) Comparison by By Technology (2016-2032)
- Figure 205: Middle East & Africa Fortified Rice Market Market Revenue (US$ Mn) Comparison by By End User (2016-2032)
- Figure 206: Middle East & Africa Fortified Rice Market Market Y-o-Y Growth Rate Comparison by Country (2016-2032)
- Figure 207: Middle East & Africa Fortified Rice Market Market Y-o-Y Growth Rate Comparison by By Nature (2016-2032)
- Figure 208: Middle East & Africa Fortified Rice Market Market Y-o-Y Growth Rate Comparison by By Distribution Channel (2016-2032)
- Figure 209: Middle East & Africa Fortified Rice Market Market Y-o-Y Growth Rate Comparison by By Ingredients (2016-2032)
- Figure 210: Middle East & Africa Fortified Rice Market Market Y-o-Y Growth Rate Comparison by By Technology (2016-2032)
- Figure 211: Middle East & Africa Fortified Rice Market Market Y-o-Y Growth Rate Comparison by By End User (2016-2032)
- Figure 212: Middle East & Africa Fortified Rice Market Market Share Comparison by Country (2016-2032)
- Figure 213: Middle East & Africa Fortified Rice Market Market Share Comparison by By Nature (2016-2032)
- Figure 214: Middle East & Africa Fortified Rice Market Market Share Comparison by By Distribution Channel (2016-2032)
- Figure 215: Middle East & Africa Fortified Rice Market Market Share Comparison by By Ingredients (2016-2032)
- Figure 216: Middle East & Africa Fortified Rice Market Market Share Comparison by By Technology (2016-2032)
- Figure 217: Middle East & Africa Fortified Rice Market Market Share Comparison by By End User (2016-2032)
"
- List of Tables
- "
- Table 1: Global Fortified Rice Market Market Comparison by By Nature (2016-2032)
- Table 2: Global Fortified Rice Market Market Comparison by By Distribution Channel (2016-2032)
- Table 3: Global Fortified Rice Market Market Comparison by By Ingredients (2016-2032)
- Table 4: Global Fortified Rice Market Market Comparison by By Technology (2016-2032)
- Table 5: Global Fortified Rice Market Market Comparison by By End User (2016-2032)
- Table 6: Global Fortified Rice Market Revenue (US$ Mn) Comparison by Region (2016-2032)
- Table 7: Global Fortified Rice Market Market Revenue (US$ Mn) (2016-2032)
- Table 8: Global Fortified Rice Market Market Revenue (US$ Mn) Comparison by Region (2016-2032)
- Table 9: Global Fortified Rice Market Market Revenue (US$ Mn) Comparison by By Nature (2016-2032)
- Table 10: Global Fortified Rice Market Market Revenue (US$ Mn) Comparison by By Distribution Channel (2016-2032)
- Table 11: Global Fortified Rice Market Market Revenue (US$ Mn) Comparison by By Ingredients (2016-2032)
- Table 12: Global Fortified Rice Market Market Revenue (US$ Mn) Comparison by By Technology (2016-2032)
- Table 13: Global Fortified Rice Market Market Revenue (US$ Mn) Comparison by By End User (2016-2032)
- Table 14: Global Fortified Rice Market Market Y-o-Y Growth Rate Comparison by Region (2016-2032)
- Table 15: Global Fortified Rice Market Market Y-o-Y Growth Rate Comparison by By Nature (2016-2032)
- Table 16: Global Fortified Rice Market Market Y-o-Y Growth Rate Comparison by By Distribution Channel (2016-2032)
- Table 17: Global Fortified Rice Market Market Y-o-Y Growth Rate Comparison by By Ingredients (2016-2032)
- Table 18: Global Fortified Rice Market Market Y-o-Y Growth Rate Comparison by By Technology (2016-2032)
- Table 19: Global Fortified Rice Market Market Y-o-Y Growth Rate Comparison by By End User (2016-2032)
- Table 20: Global Fortified Rice Market Market Share Comparison by Region (2016-2032)
- Table 21: Global Fortified Rice Market Market Share Comparison by By Nature (2016-2032)
- Table 22: Global Fortified Rice Market Market Share Comparison by By Distribution Channel (2016-2032)
- Table 23: Global Fortified Rice Market Market Share Comparison by By Ingredients (2016-2032)
- Table 24: Global Fortified Rice Market Market Share Comparison by By Technology (2016-2032)
- Table 25: Global Fortified Rice Market Market Share Comparison by By End User (2016-2032)
- Table 26: North America Fortified Rice Market Market Comparison by By Distribution Channel (2016-2032)
- Table 27: North America Fortified Rice Market Market Comparison by By Ingredients (2016-2032)
- Table 28: North America Fortified Rice Market Market Comparison by By Technology (2016-2032)
- Table 29: North America Fortified Rice Market Market Comparison by By End User (2016-2032)
- Table 30: North America Fortified Rice Market Revenue (US$ Mn) Comparison by Country (2016-2032)
- Table 31: North America Fortified Rice Market Market Revenue (US$ Mn) (2016-2032)
- Table 32: North America Fortified Rice Market Market Revenue (US$ Mn) Comparison by Country (2016-2032)
- Table 33: North America Fortified Rice Market Market Revenue (US$ Mn) Comparison by By Nature (2016-2032)
- Table 34: North America Fortified Rice Market Market Revenue (US$ Mn) Comparison by By Distribution Channel (2016-2032)
- Table 35: North America Fortified Rice Market Market Revenue (US$ Mn) Comparison by By Ingredients (2016-2032)
- Table 36: North America Fortified Rice Market Market Revenue (US$ Mn) Comparison by By Technology (2016-2032)
- Table 37: North America Fortified Rice Market Market Revenue (US$ Mn) Comparison by By End User (2016-2032)
- Table 38: North America Fortified Rice Market Market Y-o-Y Growth Rate Comparison by Country (2016-2032)
- Table 39: North America Fortified Rice Market Market Y-o-Y Growth Rate Comparison by By Nature (2016-2032)
- Table 40: North America Fortified Rice Market Market Y-o-Y Growth Rate Comparison by By Distribution Channel (2016-2032)
- Table 41: North America Fortified Rice Market Market Y-o-Y Growth Rate Comparison by By Ingredients (2016-2032)
- Table 42: North America Fortified Rice Market Market Y-o-Y Growth Rate Comparison by By Technology (2016-2032)
- Table 43: North America Fortified Rice Market Market Y-o-Y Growth Rate Comparison by By End User (2016-2032)
- Table 44: North America Fortified Rice Market Market Share Comparison by Country (2016-2032)
- Table 45: North America Fortified Rice Market Market Share Comparison by By Nature (2016-2032)
- Table 46: North America Fortified Rice Market Market Share Comparison by By Distribution Channel (2016-2032)
- Table 47: North America Fortified Rice Market Market Share Comparison by By Ingredients (2016-2032)
- Table 48: North America Fortified Rice Market Market Share Comparison by By Technology (2016-2032)
- Table 49: North America Fortified Rice Market Market Share Comparison by By End User (2016-2032)
- Table 50: Western Europe Fortified Rice Market Market Comparison by By Nature (2016-2032)
- Table 51: Western Europe Fortified Rice Market Market Comparison by By Distribution Channel (2016-2032)
- Table 52: Western Europe Fortified Rice Market Market Comparison by By Ingredients (2016-2032)
- Table 53: Western Europe Fortified Rice Market Market Comparison by By Technology (2016-2032)
- Table 54: Western Europe Fortified Rice Market Market Comparison by By End User (2016-2032)
- Table 55: Western Europe Fortified Rice Market Revenue (US$ Mn) Comparison by Country (2016-2032)
- Table 56: Western Europe Fortified Rice Market Market Revenue (US$ Mn) (2016-2032)
- Table 57: Western Europe Fortified Rice Market Market Revenue (US$ Mn) Comparison by Country (2016-2032)
- Table 58: Western Europe Fortified Rice Market Market Revenue (US$ Mn) Comparison by By Nature (2016-2032)
- Table 59: Western Europe Fortified Rice Market Market Revenue (US$ Mn) Comparison by By Distribution Channel (2016-2032)
- Table 60: Western Europe Fortified Rice Market Market Revenue (US$ Mn) Comparison by By Ingredients (2016-2032)
- Table 61: Western Europe Fortified Rice Market Market Revenue (US$ Mn) Comparison by By Technology (2016-2032)
- Table 62: Western Europe Fortified Rice Market Market Revenue (US$ Mn) Comparison by By End User (2016-2032)
- Table 63: Western Europe Fortified Rice Market Market Y-o-Y Growth Rate Comparison by Country (2016-2032)
- Table 64: Western Europe Fortified Rice Market Market Y-o-Y Growth Rate Comparison by By Nature (2016-2032)
- Table 65: Western Europe Fortified Rice Market Market Y-o-Y Growth Rate Comparison by By Distribution Channel (2016-2032)
- Table 66: Western Europe Fortified Rice Market Market Y-o-Y Growth Rate Comparison by By Ingredients (2016-2032)
- Table 67: Western Europe Fortified Rice Market Market Y-o-Y Growth Rate Comparison by By Technology (2016-2032)
- Table 68: Western Europe Fortified Rice Market Market Y-o-Y Growth Rate Comparison by By End User (2016-2032)
- Table 69: Western Europe Fortified Rice Market Market Share Comparison by Country (2016-2032)
- Table 70: Western Europe Fortified Rice Market Market Share Comparison by By Nature (2016-2032)
- Table 71: Western Europe Fortified Rice Market Market Share Comparison by By Distribution Channel (2016-2032)
- Table 72: Western Europe Fortified Rice Market Market Share Comparison by By Ingredients (2016-2032)
- Table 73: Western Europe Fortified Rice Market Market Share Comparison by By Technology (2016-2032)
- Table 74: Western Europe Fortified Rice Market Market Share Comparison by By End User (2016-2032)
- Table 75: Eastern Europe Fortified Rice Market Market Comparison by By Nature (2016-2032)
- Table 76: Eastern Europe Fortified Rice Market Market Comparison by By Distribution Channel (2016-2032)
- Table 77: Eastern Europe Fortified Rice Market Market Comparison by By Ingredients (2016-2032)
- Table 78: Eastern Europe Fortified Rice Market Market Comparison by By Technology (2016-2032)
- Table 79: Eastern Europe Fortified Rice Market Market Comparison by By End User (2016-2032)
- Table 80: Eastern Europe Fortified Rice Market Revenue (US$ Mn) Comparison by Country (2016-2032)
- Table 81: Eastern Europe Fortified Rice Market Market Revenue (US$ Mn) (2016-2032)
- Table 82: Eastern Europe Fortified Rice Market Market Revenue (US$ Mn) Comparison by Country (2016-2032)
- Table 83: Eastern Europe Fortified Rice Market Market Revenue (US$ Mn) Comparison by By Nature (2016-2032)
- Table 84: Eastern Europe Fortified Rice Market Market Revenue (US$ Mn) Comparison by By Distribution Channel (2016-2032)
- Table 85: Eastern Europe Fortified Rice Market Market Revenue (US$ Mn) Comparison by By Ingredients (2016-2032)
- Table 86: Eastern Europe Fortified Rice Market Market Revenue (US$ Mn) Comparison by By Technology (2016-2032)
- Table 87: Eastern Europe Fortified Rice Market Market Revenue (US$ Mn) Comparison by By End User (2016-2032)
- Table 88: Eastern Europe Fortified Rice Market Market Y-o-Y Growth Rate Comparison by Country (2016-2032)
- Table 89: Eastern Europe Fortified Rice Market Market Y-o-Y Growth Rate Comparison by By Nature (2016-2032)
- Table 90: Eastern Europe Fortified Rice Market Market Y-o-Y Growth Rate Comparison by By Distribution Channel (2016-2032)
- Table 91: Eastern Europe Fortified Rice Market Market Y-o-Y Growth Rate Comparison by By Ingredients (2016-2032)
- Table 92: Eastern Europe Fortified Rice Market Market Y-o-Y Growth Rate Comparison by By Technology (2016-2032)
- Table 93: Eastern Europe Fortified Rice Market Market Y-o-Y Growth Rate Comparison by By End User (2016-2032)
- Table 94: Eastern Europe Fortified Rice Market Market Share Comparison by Country (2016-2032)
- Table 95: Eastern Europe Fortified Rice Market Market Share Comparison by By Nature (2016-2032)
- Table 96: Eastern Europe Fortified Rice Market Market Share Comparison by By Distribution Channel (2016-2032)
- Table 97: Eastern Europe Fortified Rice Market Market Share Comparison by By Ingredients (2016-2032)
- Table 98: Eastern Europe Fortified Rice Market Market Share Comparison by By Technology (2016-2032)
- Table 99: Eastern Europe Fortified Rice Market Market Share Comparison by By End User (2016-2032)
- Table 100: APAC Fortified Rice Market Market Comparison by By Nature (2016-2032)
- Table 101: APAC Fortified Rice Market Market Comparison by By Distribution Channel (2016-2032)
- Table 102: APAC Fortified Rice Market Market Comparison by By Ingredients (2016-2032)
- Table 103: APAC Fortified Rice Market Market Comparison by By Technology (2016-2032)
- Table 104: APAC Fortified Rice Market Market Comparison by By End User (2016-2032)
- Table 105: APAC Fortified Rice Market Revenue (US$ Mn) Comparison by Country (2016-2032)
- Table 106: APAC Fortified Rice Market Market Revenue (US$ Mn) (2016-2032)
- Table 107: APAC Fortified Rice Market Market Revenue (US$ Mn) Comparison by Country (2016-2032)
- Table 108: APAC Fortified Rice Market Market Revenue (US$ Mn) Comparison by By Nature (2016-2032)
- Table 109: APAC Fortified Rice Market Market Revenue (US$ Mn) Comparison by By Distribution Channel (2016-2032)
- Table 110: APAC Fortified Rice Market Market Revenue (US$ Mn) Comparison by By Ingredients (2016-2032)
- Table 111: APAC Fortified Rice Market Market Revenue (US$ Mn) Comparison by By Technology (2016-2032)
- Table 112: APAC Fortified Rice Market Market Revenue (US$ Mn) Comparison by By End User (2016-2032)
- Table 113: APAC Fortified Rice Market Market Y-o-Y Growth Rate Comparison by Country (2016-2032)
- Table 114: APAC Fortified Rice Market Market Y-o-Y Growth Rate Comparison by By Nature (2016-2032)
- Table 115: APAC Fortified Rice Market Market Y-o-Y Growth Rate Comparison by By Distribution Channel (2016-2032)
- Table 116: APAC Fortified Rice Market Market Y-o-Y Growth Rate Comparison by By Ingredients (2016-2032)
- Table 117: APAC Fortified Rice Market Market Y-o-Y Growth Rate Comparison by By Technology (2016-2032)
- Table 118: APAC Fortified Rice Market Market Y-o-Y Growth Rate Comparison by By End User (2016-2032)
- Table 119: APAC Fortified Rice Market Market Share Comparison by Country (2016-2032)
- Table 120: APAC Fortified Rice Market Market Share Comparison by By Nature (2016-2032)
- Table 121: APAC Fortified Rice Market Market Share Comparison by By Distribution Channel (2016-2032)
- Table 122: APAC Fortified Rice Market Market Share Comparison by By Ingredients (2016-2032)
- Table 123: APAC Fortified Rice Market Market Share Comparison by By Technology (2016-2032)
- Table 124: APAC Fortified Rice Market Market Share Comparison by By End User (2016-2032)
- Table 125: Latin America Fortified Rice Market Market Comparison by By Nature (2016-2032)
- Table 126: Latin America Fortified Rice Market Market Comparison by By Distribution Channel (2016-2032)
- Table 127: Latin America Fortified Rice Market Market Comparison by By Ingredients (2016-2032)
- Table 128: Latin America Fortified Rice Market Market Comparison by By Technology (2016-2032)
- Table 129: Latin America Fortified Rice Market Market Comparison by By End User (2016-2032)
- Table 130: Latin America Fortified Rice Market Revenue (US$ Mn) Comparison by Country (2016-2032)
- Table 131: Latin America Fortified Rice Market Market Revenue (US$ Mn) (2016-2032)
- Table 132: Latin America Fortified Rice Market Market Revenue (US$ Mn) Comparison by Country (2016-2032)
- Table 133: Latin America Fortified Rice Market Market Revenue (US$ Mn) Comparison by By Nature (2016-2032)
- Table 134: Latin America Fortified Rice Market Market Revenue (US$ Mn) Comparison by By Distribution Channel (2016-2032)
- Table 135: Latin America Fortified Rice Market Market Revenue (US$ Mn) Comparison by By Ingredients (2016-2032)
- Table 136: Latin America Fortified Rice Market Market Revenue (US$ Mn) Comparison by By Technology (2016-2032)
- Table 137: Latin America Fortified Rice Market Market Revenue (US$ Mn) Comparison by By End User (2016-2032)
- Table 138: Latin America Fortified Rice Market Market Y-o-Y Growth Rate Comparison by Country (2016-2032)
- Table 139: Latin America Fortified Rice Market Market Y-o-Y Growth Rate Comparison by By Nature (2016-2032)
- Table 140: Latin America Fortified Rice Market Market Y-o-Y Growth Rate Comparison by By Distribution Channel (2016-2032)
- Table 141: Latin America Fortified Rice Market Market Y-o-Y Growth Rate Comparison by By Ingredients (2016-2032)
- Table 142: Latin America Fortified Rice Market Market Y-o-Y Growth Rate Comparison by By Technology (2016-2032)
- Table 143: Latin America Fortified Rice Market Market Y-o-Y Growth Rate Comparison by By End User (2016-2032)
- Table 144: Latin America Fortified Rice Market Market Share Comparison by Country (2016-2032)
- Table 145: Latin America Fortified Rice Market Market Share Comparison by By Nature (2016-2032)
- Table 146: Latin America Fortified Rice Market Market Share Comparison by By Distribution Channel (2016-2032)
- Table 147: Latin America Fortified Rice Market Market Share Comparison by By Ingredients (2016-2032)
- Table 148: Latin America Fortified Rice Market Market Share Comparison by By Technology (2016-2032)
- Table 149: Latin America Fortified Rice Market Market Share Comparison by By End User (2016-2032)
- Table 150: Middle East & Africa Fortified Rice Market Market Comparison by By Nature (2016-2032)
- Table 151: Middle East & Africa Fortified Rice Market Market Comparison by By Distribution Channel (2016-2032)
- Table 152: Middle East & Africa Fortified Rice Market Market Comparison by By Ingredients (2016-2032)
- Table 153: Middle East & Africa Fortified Rice Market Market Comparison by By Technology (2016-2032)
- Table 154: Middle East & Africa Fortified Rice Market Market Comparison by By End User (2016-2032)
- Table 155: Middle East & Africa Fortified Rice Market Revenue (US$ Mn) Comparison by Country (2016-2032)
- Table 156: Middle East & Africa Fortified Rice Market Market Revenue (US$ Mn) (2016-2032)
- Table 157: Middle East & Africa Fortified Rice Market Market Revenue (US$ Mn) Comparison by Country (2016-2032)
- Table 158: Middle East & Africa Fortified Rice Market Market Revenue (US$ Mn) Comparison by By Nature (2016-2032)
- Table 159: Middle East & Africa Fortified Rice Market Market Revenue (US$ Mn) Comparison by By Distribution Channel (2016-2032)
- Table 160: Middle East & Africa Fortified Rice Market Market Revenue (US$ Mn) Comparison by By Ingredients (2016-2032)
- Table 161: Middle East & Africa Fortified Rice Market Market Revenue (US$ Mn) Comparison by By Technology (2016-2032)
- Table 162: Middle East & Africa Fortified Rice Market Market Revenue (US$ Mn) Comparison by By End User (2016-2032)
- Table 163: Middle East & Africa Fortified Rice Market Market Y-o-Y Growth Rate Comparison by Country (2016-2032)
- Table 164: Middle East & Africa Fortified Rice Market Market Y-o-Y Growth Rate Comparison by By Nature (2016-2032)
- Table 165: Middle East & Africa Fortified Rice Market Market Y-o-Y Growth Rate Comparison by By Distribution Channel (2016-2032)
- Table 166: Middle East & Africa Fortified Rice Market Market Y-o-Y Growth Rate Comparison by By Ingredients (2016-2032)
- Table 167: Middle East & Africa Fortified Rice Market Market Y-o-Y Growth Rate Comparison by By Technology (2016-2032)
- Table 168: Middle East & Africa Fortified Rice Market Market Y-o-Y Growth Rate Comparison by By End User (2016-2032)
- Table 169: Middle East & Africa Fortified Rice Market Market Share Comparison by Country (2016-2032)
- Table 170: Middle East & Africa Fortified Rice Market Market Share Comparison by By Nature (2016-2032)
- Table 171: Middle East & Africa Fortified Rice Market Market Share Comparison by By Distribution Channel (2016-2032)
- Table 172: Middle East & Africa Fortified Rice Market Market Share Comparison by By Ingredients (2016-2032)
- Table 173: Middle East & Africa Fortified Rice Market Market Share Comparison by By Technology (2016-2032)
- Table 174: Middle East & Africa Fortified Rice Market Market Share Comparison by By End User (2016-2032)
- 1. Executive Summary
-
- Cargill Incorporated
- Bunge Limited
- Bühler AG
- BASF SE
- General Mills, Inc.
- Koninklijke DSM N.V.
- Wilmar International Ltd.
- Kohinoor Specialty Foods India Private Ltd.
- KRBL Limited
- REI Agro Ltd.
- Freedom Foods Group Limited
- LT Foods
Our Clients


View Our Licence Options
