
Global Fish Protein Hydrolysate Market By Form(Powder, Liquid), By Application(Food, Pharmaceuticals, Animal Feed & Pet Food, Personal Care, Agriculture), By Source(Anchovy, Herring, Salmon, Tuna, Others), By Region And Companies - Industry Segment Outlook, Market Assessment, Competition Scenario, Trends, And Forecast 2024-2033
-
48964
-
July 2024
-
300
-


-
This report was compiled by Shreyas Rokade Shreyas Rokade is a seasoned Research Analyst with CMFE, bringing extensive expertise in market research and consulting, with a strong background in Chemical Engineering. Correspondence Team Lead-CMFE Linkedin | Detailed Market research Methodology Our methodology involves a mix of primary research, including interviews with leading mental health experts, and secondary research from reputable medical journals and databases. View Detailed Methodology Page
-
Quick Navigation
Report Overview
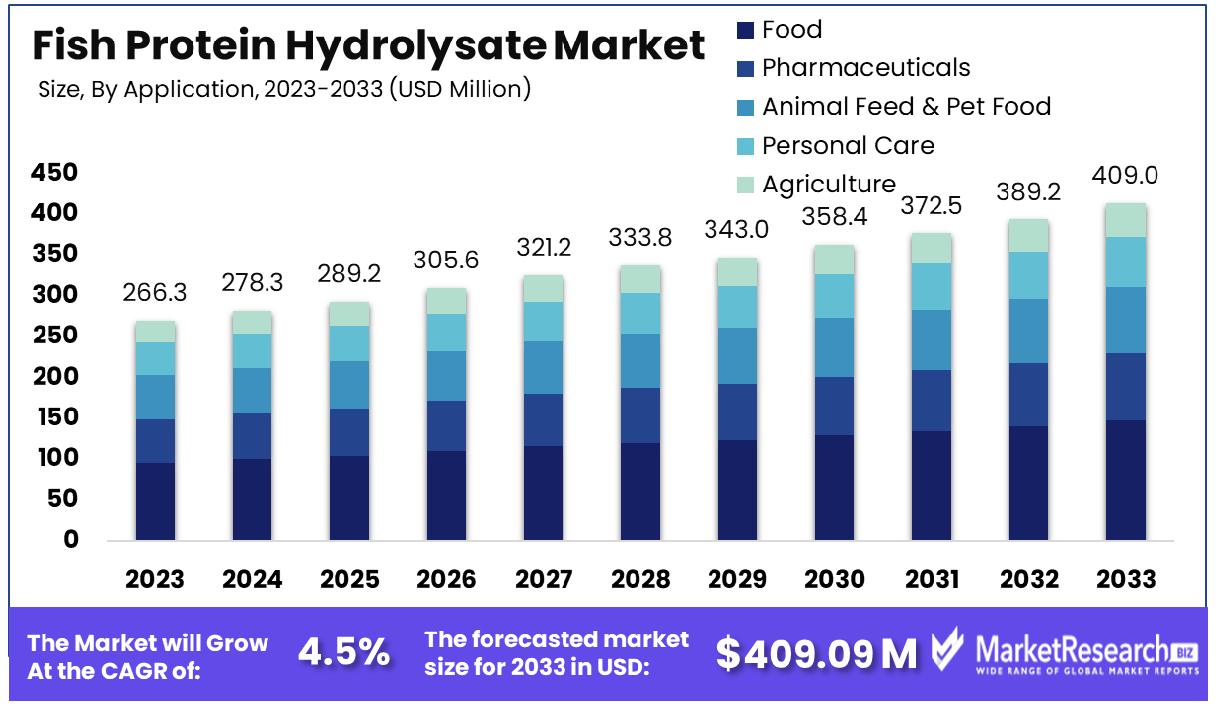
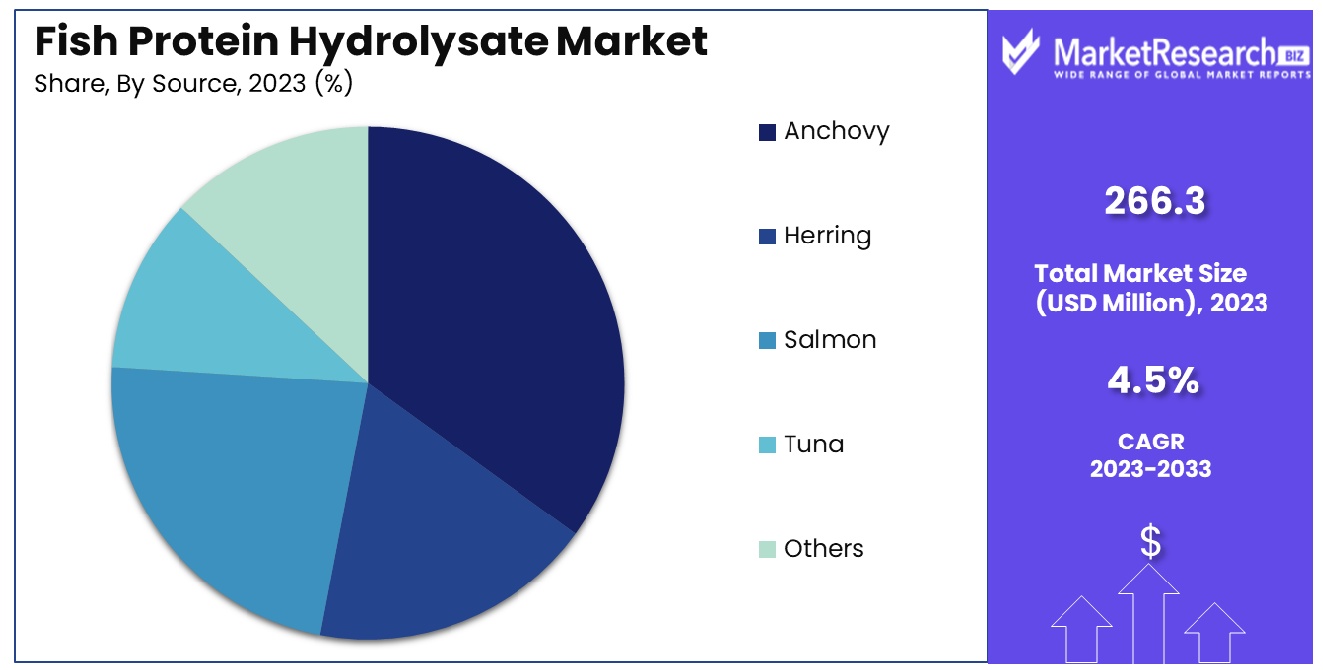
The Global Fish Protein Hydrolysate Market was valued at USD 266.3 million in 2023. It is expected to reach USD 409.0 million by 2033, with a CAGR of 4.5% during the forecast period from 2024 to 2033.
The Fish Protein Hydrolysate Market refers to the global industry involved in the production, distribution, and utilization of fish protein hydrolysates. These are bioactive compounds derived from the enzymatic hydrolysis of fish proteins, offering superior digestibility, solubility, and nutritional benefits. The market encompasses various applications, including animal feed, aquaculture, pharmaceuticals, cosmetics, and functional foods.
Key drivers include rising demand for sustainable and high-quality protein sources, advancements in biotechnology, and increasing consumer preference for natural and organic products. This market is characterized by ongoing innovation, strategic collaborations, and regulatory compliance, catering to diverse industry needs and driving significant growth opportunities.
The Fish Protein Hydrolysate Market is poised for substantial growth, driven by increasing demand for sustainable and high-quality protein sources across diverse industries. Fish protein hydrolysates, derived through enzymatic hydrolysis, offer significant advantages, including superior digestibility, solubility, and an excellent nutritional profile. Typically containing 16-20% protein by weight and high-quality amino acid profiles, fish protein hydrolysates meet the growing consumer preference for natural and organic products.
The high digestibility of fish protein, ranging from 85-90%, enhances its appeal in the animal feed and aquaculture sectors, where efficient nutrient absorption is critical. Additionally, the varying energy value of fish protein, with net energy content ranging from 805 kcal/kg to 180 kcal/kg, depending on protein and fat content, underscores its versatility and utility in formulating energy-dense dietary products.
In the pharmaceutical and cosmetics industries, fish protein hydrolysates are valued for their bioactive properties, contributing to skin health and overall wellness. The functional foods segment is also witnessing increased adoption, driven by consumers' pursuit of health-enhancing ingredients.
Ongoing advancements in biotechnology and strategic collaborations among key players are catalyzing innovation within the market. Regulatory compliance and sustainability practices further bolster the market's growth prospects. Companies are investing in research and development to optimize extraction processes and enhance product quality, thereby broadening the application spectrum of fish protein hydrolysates.
Key Takeaways
- Market Growth: The Global Fish Protein Hydrolysate Market was valued at USD 266.3 million in 2023. It is expected to reach USD 409.0 million by 2033, with a CAGR of 4.5% during the forecast period from 2024 to 2033.
- Regional Dominance: North America holds a dominant 35% share of the Fish Protein Hydrolysate Market.
- By Form: Powder form dominated the market, capturing a 68% share.
- By Application: Food application led the market, accounting for a 40% share.
- By Source: Anchovy source dominated the market, securing a 30% share.
Driving factors
Increasing Demand for Natural Ingredients in Animal Feed and Agricultural Products
The rising preference for natural and organic ingredients in animal feed and agricultural products is a significant driver for the Fish Protein Hydrolysate Market. As consumers become more health-conscious, there is an increasing demand for sustainably sourced and naturally derived feed ingredients.
Fish protein hydrolysates, with their high protein content of 16-20% by weight and digestibility rates of 85-90%, provide an optimal solution for enhancing the nutritional value of animal feed. This trend is further supported by the agricultural sector's shift towards natural fertilizers and soil conditioners, where fish protein hydrolysates are valued for their bioactive properties and environmental benefits.
Growing Awareness of the Health Benefits Associated with Fish Protein
The health benefits associated with fish protein are becoming more widely recognized, contributing to the market's expansion. Fish protein hydrolysates are rich in high-quality amino acids and offer superior digestibility, making them an excellent choice for various health applications.
The net energy content of fish protein, varying from 805 kcal/kg to 180 kcal/kg, highlights its efficiency as a dietary energy source. This has led to increased incorporation of fish protein hydrolysates in functional foods, dietary supplements, and pharmaceuticals, where they are prized for their potential to support muscle growth, improve digestion, and enhance overall health.
Expansion of the Nutraceutical Industry Requiring High-Quality Protein Ingredients
The rapid growth of the nutraceutical industry is a crucial factor driving the Fish Protein Hydrolysate Market. As consumers increasingly seek products that offer health benefits beyond basic nutrition, the demand for high-quality protein ingredients has surged. Fish protein hydrolysates, with their excellent nutritional profile and bioactive properties, are well-suited for nutraceutical applications.
This industry expansion is fueled by ongoing research and development efforts aimed at optimizing hydrolysis processes and improving product quality, thereby meeting the stringent requirements of nutraceutical manufacturers and positioning fish protein hydrolysates as a vital ingredient in this burgeoning market.
Restraining Factors
High Cost of Production and Processing of Fish Protein Hydrolysate
The high cost of production and processing is a significant restraining factor for the Fish Protein Hydrolysate Market. The enzymatic hydrolysis process, which is crucial for producing high-quality fish protein hydrolysates, involves advanced technology and significant energy input.
This leads to elevated production costs, which can hinder market growth by limiting the affordability and accessibility of the final product. Additionally, the need for specialized equipment and expertise adds to the overall cost, making it challenging for smaller manufacturers to enter the market. These financial barriers can slow down the expansion of the market, as cost-conscious consumers and businesses may opt for cheaper alternative protein sources.
Regulatory and Sustainability Concerns Related to Fish Sourcing
Regulatory and sustainability concerns related to fish sourcing present another major challenge for the Fish Protein Hydrolysate Market. The extraction of fish protein hydrolysates requires a reliable and sustainable supply of raw fish materials. Overfishing and unsustainable fishing practices have led to stringent regulations aimed at preserving marine ecosystems.
Compliance with these regulations can be complex and costly, impacting the availability and cost of raw materials. Additionally, there is growing scrutiny on the environmental impact of fish sourcing and processing. Companies must invest in sustainable practices and traceability systems to meet regulatory standards and consumer expectations for eco-friendly products. This can further escalate production costs and complicate the supply chain.
By Form Analysis
Powder, which dominated 68%, demonstrates a significant market preference for this versatile form.
In 2023, Powder held a dominant market position in the "By Form" segment of the Fish Protein Hydrolysate Market, capturing more than a 68% share. This substantial market share is indicative of the segment's robust demand across various applications where powder form is preferred for its ease of storage, stability, and versatility in integration with other dietary components. The powder form of fish protein hydrolysate is extensively utilized in dietary supplements, animal feed, and functional foods due to its high protein content and rapid absorbability.
On the other hand, the Liquid segment, while smaller in comparison, also plays a crucial role in the market. Liquid fish protein hydrolysate is valued for its immediate solubility and ease of application, particularly in agriculture and animal feed, promoting better nutrient absorption and improving overall health outcomes. Despite its benefits, the liquid form accounted for the remaining market share, which was considerably less than the powder form.
The dominance of the Powder segment can be attributed to its widespread acceptance in the health and wellness industry, where it is incorporated into nutrition bars, protein shakes, and health supplements. The versatility of powder form allows for broader commercial applications, driving its higher adoption rate. As market trends continue to favor high-protein, easily consumable products, the demand for powdered fish protein hydrolysate is expected to remain strong, supporting its dominant position in the market.
By Application Analysis
The food sector, accounting for 40%, showcases the primary utilization of this product.
In 2023, Food held a dominant market position in the "By Application" segment of the Fish Protein Hydrolysate Market, capturing more than a 40% share. This segment benefits significantly from the rising consumer awareness of the health benefits associated with fish protein, including improved digestion and enhanced nutritional profiles. The use of fish protein hydrolysate in food applications spans a broad spectrum, from functional foods and beverages to dietary supplements, where it is prized for its high amino acid content and hypoallergenic properties.
Pharmaceuticals, another key segment, leverage fish protein hydrolysate for its bioactive peptides that are beneficial in medicinal products aimed at improving immune responses and metabolic health. Although substantial, the share of this segment trails behind that of Food due to more stringent regulatory requirements and longer product development cycles.
The Animal Feed & Pet Food segment also represents a significant portion of the market. Fish protein hydrolysate is utilized here for its high digestibility and nutrient absorption properties, which are essential for the health of livestock and pets. This segment benefits from the ongoing trend toward premium pet food products that emphasize natural and healthful ingredients.
Personal Care and Agriculture are smaller segments. In personal care, fish protein hydrolysate is used in products that promote skin and hair health due to its moisturizing and repair properties. In agriculture, it serves as a bio-stimulant, enhancing plant growth and resilience by improving nutrient uptake and stress tolerance. Despite their smaller sizes, these segments are anticipated to grow, driven by sustainable and organic farming practices and the clean beauty trend in personal care.
By Source Analysis
Anchovy, representing 30%, highlights its critical role as a dominant source in the market.
In 2023, Anchovy held a dominant market position in the "By Source" segment of the Fish Protein Hydrolysate Market, capturing more than a 30% share. Renowned for their rich flavor and high protein content, anchovies are a preferred source for producing hydrolysates, which are increasingly used in various applications due to their nutritional benefits. Anchovies' abundant availability and cost-effectiveness make them particularly attractive for large-scale production of fish protein hydrolysates.
Following Anchovy, Herring, and Salmon are also significant contributors to the market. Herring, with its similar nutrient profile, provides a valuable alternative, particularly in regions where it is more readily available than anchovies. Salmon, known for its omega-3 fatty acids, is particularly favored in premium health and wellness products, adding value through its recognized health benefits.
Tuna, another important source, is utilized for its lean protein and is a popular choice in both the food and dietary supplement industries. The "Others" category, which includes various smaller fish species, also holds a niche yet vital part of the market, often utilized for specific regional preferences or unique product formulations.
The strong position of Anchovy in the market is attributed to its widespread acceptance and integration across multiple end-use sectors, including food, pharmaceuticals, and especially in pet foods, where fish-based proteins are highly valued for their quality and palatability. The continued growth in demand for natural and sustainable ingredients is likely to sustain, if not increase, the market share of anchovies in the coming years.
Key Market Segments
By Form
- Powder
- Liquid
By Application
- Food
- Pharmaceuticals
- Animal Feed & Pet Food
- Personal Care
- Agriculture
By Source
- Anchovy
- Herring
- Salmon
- Tuna
- Others
Growth Opportunity
Development of Innovative Product Applications in Cosmetics and Personal Care
In 2023, significant growth opportunities for the global Fish Protein Hydrolysate Market are anticipated, driven by the development of innovative product applications in cosmetics and personal care. Fish protein hydrolysates are increasingly being recognized for their bioactive properties, which offer numerous benefits for skin health, including hydration, anti-aging, and improved skin elasticity. The high-quality amino acid profile and superior digestibility of fish protein hydrolysates make them an ideal ingredient for formulations aimed at enhancing skin vitality and appearance.
As consumers continue to seek out natural and effective personal care products, the incorporation of fish protein hydrolysates in creams, lotions, and serums is expected to gain traction. This trend is supported by ongoing research and development efforts that focus on optimizing the extraction and formulation processes to maximize the efficacy of these bioactive compounds. Consequently, the cosmetics and personal care sector is poised to become a significant growth driver for the Fish Protein Hydrolysate Market.
Expansion into Emerging Markets with Growing Health Consciousness and Dietary Supplement Use
Another key growth opportunity in 2023 lies in the expansion into emerging markets, particularly those experiencing a rise in health consciousness and increased use of dietary supplements. Regions such as Asia-Pacific, Latin America, and the Middle East are witnessing a surge in demand for health-enhancing products due to improving economic conditions and greater awareness of the benefits of functional foods and supplements. Fish protein hydrolysates, with their high protein content and excellent digestibility, are well-positioned to meet this growing demand.
The energy value of fish protein, ranging from 805 kcal/kg to 180 kcal/kg, further enhances its appeal as a nutritional supplement. Companies targeting these emerging markets can leverage local partnerships and tailored marketing strategies to capitalize on the increasing consumer interest in natural and bioactive protein sources. By addressing the specific dietary needs and preferences of these markets, the Fish Protein Hydrolysate Market can achieve substantial growth and expand its global footprint in 2023.
Latest Trends
Increasing Use of Enzymatic Hydrolysis for Cleaner Labels and Enhanced Nutritional Profiles
In 2023, a prominent trend in the global Fish Protein Hydrolysate Market is the increasing use of enzymatic hydrolysis, driven by the demand for cleaner labels and enhanced nutritional profiles. Enzymatic hydrolysis is preferred for its ability to produce fish protein hydrolysates with superior digestibility and high-quality amino acid profiles. This method avoids the use of harsh chemicals, resulting in a more natural product that aligns with consumer preferences for clean-label ingredients.
As consumers become more health-conscious and scrutinize product labels, the transparency and simplicity offered by enzymatic hydrolysis become significant selling points. This process not only improves the nutritional value of fish protein hydrolysates but also enhances their appeal across various applications, including animal feed, aquaculture, functional foods, and dietary supplements. By leveraging enzymatic hydrolysis, manufacturers can cater to the growing segment of health-conscious consumers seeking natural and minimally processed protein sources.
Rise in Demand for Organic and Sustainably Sourced Fish Protein Products
The rise in demand for organic and sustainably sourced fish protein products is another critical trend shaping the Fish Protein Hydrolysate Market in 2023. Consumers are increasingly prioritizing sustainability and environmental responsibility, influencing their purchasing decisions. This shift is particularly evident in the protein supplement market, where eco-conscious consumers seek out products that support sustainable fishing practices and minimize environmental impact. Organic fish protein hydrolysates, derived from sustainably sourced fish, meet this demand by offering a natural, environmentally friendly alternative to conventional protein sources.
Companies are investing in certifications and traceability systems to ensure their products meet these sustainability criteria, thereby enhancing their market appeal. This trend not only drives the adoption of fish protein hydrolysates but also fosters innovation in sustainable sourcing and production methods. As a result, the market is expected to witness increased growth as more consumers and businesses prioritize sustainability in their protein sourcing choices, reinforcing the importance of eco-friendly practices in the industry.
Regional Analysis
North America dominates the Fish Protein Hydrolysate Market, accounting for a substantial 35% share.
North America dominates the global market, holding a substantial 35% share. This region's leadership is attributed to the high demand for sustainable and high-quality protein sources, driven by the robust nutraceutical and functional food industries. The increasing consumer awareness about health benefits and the presence of advanced biotechnological facilities further bolster market growth. The United States and Canada, with their strong focus on organic and natural products, are key contributors to this dominance.
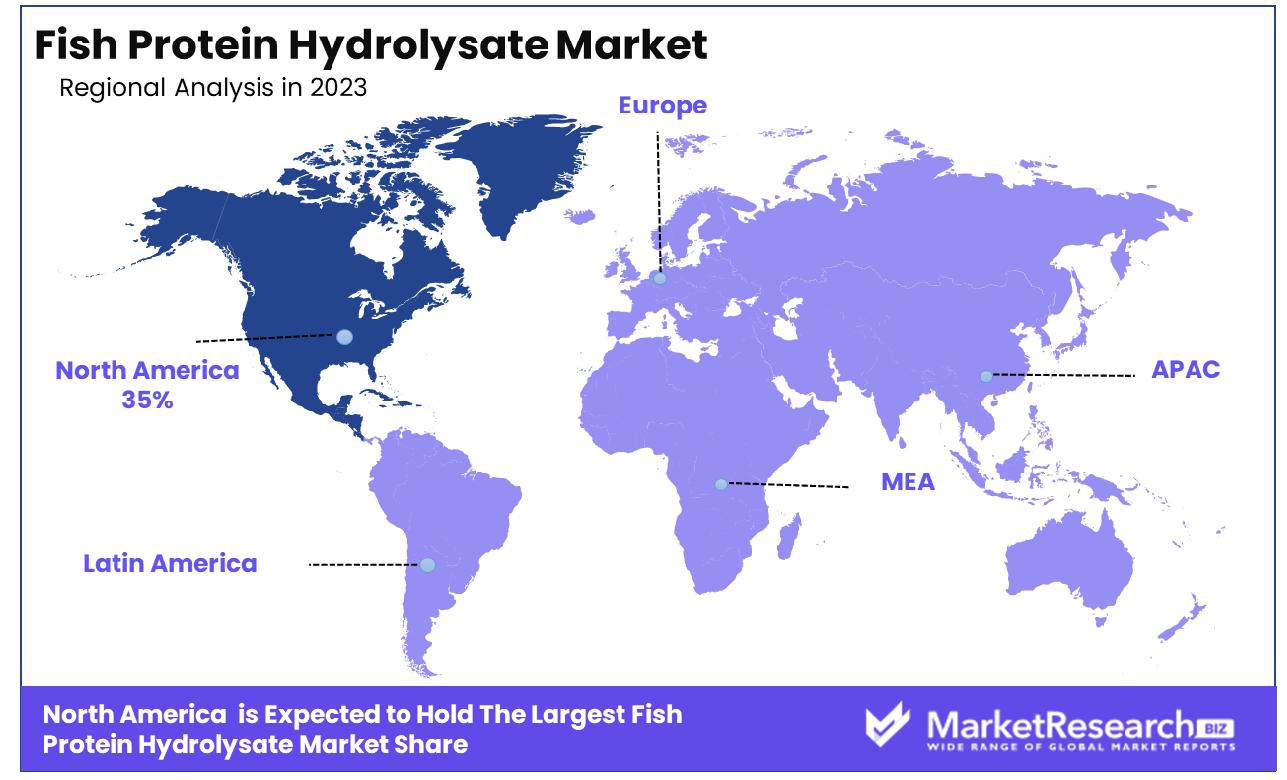
Europe follows closely, with significant contributions from countries like Germany, France, and the United Kingdom. The region's market is driven by stringent regulatory standards promoting sustainable and clean-label ingredients. The well-established cosmetics and personal care industry in Europe also significantly boosts the demand for fish protein hydrolysates. Additionally, the rising trend of functional foods and dietary supplements supports market expansion.
Asia Pacific is witnessing rapid growth, fueled by increasing health consciousness and expanding middle-class populations in countries such as China, Japan, and India. The region's burgeoning aquaculture industry, coupled with a growing preference for natural and organic ingredients, propels the market. Moreover, the high digestibility and superior nutritional profile of fish protein hydrolysates make them popular in animal feed and aquaculture applications.
Latin America and the Middle East & Africa are emerging markets with significant growth potential. In Latin America, countries like Brazil and Mexico are seeing rising demand for functional foods and nutraceutical packaging, driven by increasing health awareness and economic growth. The Middle East & Africa region, while currently smaller in market size, is expanding due to improving economic conditions and a growing focus on sustainable agricultural practices.
Key Regions and Countries
North America
- The US
- Canada
- Rest of North America
Europe
- Germany
- France
- The UK
- Spain
- Netherlands
- Russia
- Italy
- Rest of Europe
Asia-Pacific
- China
- Japan
- Singapore
- Thailand
- South Korea
- Vietnam
- India
- New Zealand
- Rest of Asia Pacific
Latin America
- Mexico
- Brazil
- Rest of Latin America
Middle East & Africa
- Saudi Arabia
- South Africa
- UAE
- Rest of Middle East & Africa
Key Players Analysis
Hofseth BioCare ASA stands out for its advanced biotechnological processes and commitment to sustainable sourcing. Their focus on high-quality fish protein hydrolysates for nutraceuticals and functional foods positions them as a market leader.
Diana Group (Symrise) leverages its extensive experience in natural ingredients to offer premium fish protein hydrolysates, particularly for the cosmetics and personal care sectors. Their comprehensive research and development capabilities ensure continuous product innovation.
Bio-marine Ingredients Ireland is notable for its strategic location and access to rich marine resources, enabling it to produce high-purity fish protein hydrolysates. Their products are widely used in the European functional foods and nutraceutical markets.
Copalis specializes in marine-based bioactive ingredients and has a strong presence in both the European and Asian markets. Their sustainable fishing practices and high-quality product range contribute to their robust market position.
Janatha Fish Meal & Oil Products and Shenzhen Taier are key players in the Asian market, providing essential inputs for animal feed and aquaculture. Their strategic market positioning helps meet the growing demand for sustainable and high-protein animal feed ingredients.
Scanbio Marine Group AS and Omega Protein Corporation focus on the North American market, offering high-quality fish protein hydrolysates for various applications, including pet food, aquaculture, and dietary supplements. Their established market presence and extensive distribution networks are significant growth drivers.
Biomega and Pelagia emphasize sustainability and innovation, producing fish protein hydrolysates that cater to the growing demand for eco-friendly and health-oriented products. Their strategic investments in technology and sustainable practices are pivotal for market expansion.
Neptune’s Harvest specializes in organic fish protein hydrolysates, catering to the increasing consumer preference for natural and organic products in North America. Their dedication to sustainable fishing and organic certification underpins their market success.
Market Key Players
- Hofseth BioCare ASA
- Diana Group (Symrise)
- Bio-marine Ingredients Ireland
- Copalis
- Janatha Fish Meal & Oil Products
- Scanbio Marine Group AS
- Shenzhen Taier
- Omega Protein Corporation
- Biomega
- Pelagia
- Neptune’s Harvest
Recent Development
- In March 2024, Bio-marine Ingredients Ireland announced the expansion of its production facility, increasing capacity by 30%. This expansion is in response to the growing demand for fish protein hydrolysate in the food and beverage industry. Bio-marine Ingredients Ireland aims to meet the increasing market needs with this significant investment.
- In February 2024, Copalis, a French company specializing in marine-based ingredients, secured a €10 million funding round to develop new fish protein hydrolysate applications for the cosmetics industry. This funding will enable Copalis to explore innovative uses and enhance its product portfolio. The investment highlights the potential of marine ingredients in non-food sectors.
Report Scope
Report Features Description Market Value (2023) USD 266.3 Million Forecast Revenue (2033) USD 409.0 Million CAGR (2024-2032) 4.5% Base Year for Estimation 2023 Historic Period 2016-2023 Forecast Period 2024-2033 Report Coverage Revenue Forecast, Market Dynamics, COVID-19 Impact, Competitive Landscape, Recent Developments Segments Covered By Form(Powder, Liquid), By Application(Food, Pharmaceuticals, Animal Feed & Pet Food, Personal Care, Agriculture), By Source(Anchovy, Herring, Salmon, Tuna, Others) Regional Analysis North America - The US, Canada, Rest of North America, Europe - Germany, France, The UK, Spain, Italy, Russia, Netherlands, Rest of Europe, Asia-Pacific - China, Japan, South Korea, India, New Zealand, Singapore, Thailand, Vietnam, Rest of Asia Pacific, Latin America - Brazil, Mexico, Rest of Latin America, Middle East & Africa - South Africa, Saudi Arabia, UAE, Rest of Middle East & Africa Competitive Landscape Hofseth BioCare ASA, Diana Group (Symrise), Bio-marine Ingredients Ireland, Copalis, Janatha Fish Meal & Oil Products, Scanbio Marine Group AS, Shenzhen Taier, Omega Protein Corporation, Biomega, Pelagia, Neptune’s Harvest Customization Scope Customization for segments, region/country-level will be provided. Moreover, additional customization can be done based on the requirements. Purchase Options We have three licenses to opt for Single User License, Multi-User License (Up to 5 Users), Corporate Use License (Unlimited User and Printable PDF) -
- 1. Executive Summary
- 1.1. Definition
- 1.2. Taxonomy
- 1.3. Research Scope
- 1.4. Key Analysis
- 1.5. Key Findings by Major Segments
- 1.6. Top strategies by Major Players
- 2. Global Fish Protein Hydrolysate Market Overview
- 2.1. Fish Protein Hydrolysate Market Dynamics
- 2.1.1. Drivers
- 2.1.2. Opportunities
- 2.1.3. Restraints
- 2.1.4. Challenges
- 2.2. Macro-economic Factors
- 2.3. Regulatory Framework
- 2.4. Market Investment Feasibility Index
- 2.5. PEST Analysis
- 2.6. PORTER’S Five Force Analysis
- 2.7. Drivers & Restraints Impact Analysis
- 2.8. Industry Chain Analysis
- 2.9. Cost Structure Analysis
- 2.10. Marketing Strategy
- 2.11. Russia-Ukraine War Impact Analysis
- 2.12. Opportunity Map Analysis
- 2.13. Market Competition Scenario Analysis
- 2.14. Product Life Cycle Analysis
- 2.15. Opportunity Orbits
- 2.16. Manufacturer Intensity Map
- 2.17. Major Companies sales by Value & Volume
- 2.1. Fish Protein Hydrolysate Market Dynamics
- 3. Global Fish Protein Hydrolysate Market Analysis, Opportunity and Forecast, 2016-2032
- 3.1. Global Fish Protein Hydrolysate Market Analysis, 2016-2021
- 3.2. Global Fish Protein Hydrolysate Market Opportunity and Forecast, 2023-2032
- 3.3. Global Fish Protein Hydrolysate Market Analysis, Opportunity and Forecast, By By Form , 2016-2032
- 3.3.1. Global Fish Protein Hydrolysate Market Analysis by By Form : Introduction
- 3.3.2. Market Size Absolute $ Opportunity Analysis and Forecast, By By Form , 2016-2032
- 3.3.3. Powder
- 3.3.4. Liquid
- 3.4. Global Fish Protein Hydrolysate Market Analysis, Opportunity and Forecast, By By Application, 2016-2032
- 3.4.1. Global Fish Protein Hydrolysate Market Analysis by By Application: Introduction
- 3.4.2. Market Size Absolute $ Opportunity Analysis and Forecast, By By Application, 2016-2032
- 3.4.3. Food
- 3.4.4. Pharmaceuticals
- 3.4.5. Animal Feed & Pet Food
- 3.4.6. Personal Care
- 3.4.7. Agriculture
- 3.5. Global Fish Protein Hydrolysate Market Analysis, Opportunity and Forecast, By By Source , 2016-2032
- 3.5.1. Global Fish Protein Hydrolysate Market Analysis by By Source : Introduction
- 3.5.2. Market Size Absolute $ Opportunity Analysis and Forecast, By By Source , 2016-2032
- 3.5.3. Anchovy
- 3.5.4. Herring
- 3.5.5. Salmon
- 3.5.6. Tuna
- 3.5.7. Others
- 4. North America Fish Protein Hydrolysate Market Analysis, Opportunity and Forecast, 2016-2032
- 4.1. North America Fish Protein Hydrolysate Market Analysis, 2016-2021
- 4.2. North America Fish Protein Hydrolysate Market Opportunity and Forecast, 2023-2032
- 4.3. North America Fish Protein Hydrolysate Market Analysis, Opportunity and Forecast, By By Form , 2016-2032
- 4.3.1. North America Fish Protein Hydrolysate Market Analysis by By Form : Introduction
- 4.3.2. Market Size Absolute $ Opportunity Analysis and Forecast, By By Form , 2016-2032
- 4.3.3. Powder
- 4.3.4. Liquid
- 4.4. North America Fish Protein Hydrolysate Market Analysis, Opportunity and Forecast, By By Application, 2016-2032
- 4.4.1. North America Fish Protein Hydrolysate Market Analysis by By Application: Introduction
- 4.4.2. Market Size Absolute $ Opportunity Analysis and Forecast, By By Application, 2016-2032
- 4.4.3. Food
- 4.4.4. Pharmaceuticals
- 4.4.5. Animal Feed & Pet Food
- 4.4.6. Personal Care
- 4.4.7. Agriculture
- 4.5. North America Fish Protein Hydrolysate Market Analysis, Opportunity and Forecast, By By Source , 2016-2032
- 4.5.1. North America Fish Protein Hydrolysate Market Analysis by By Source : Introduction
- 4.5.2. Market Size Absolute $ Opportunity Analysis and Forecast, By By Source , 2016-2032
- 4.5.3. Anchovy
- 4.5.4. Herring
- 4.5.5. Salmon
- 4.5.6. Tuna
- 4.5.7. Others
- 4.6. North America Fish Protein Hydrolysate Market Analysis, Opportunity and Forecast, By Country , 2016-2032
- 4.6.1. North America Fish Protein Hydrolysate Market Analysis by Country : Introduction
- 4.6.2. Market Size Absolute $ Opportunity Analysis and Forecast, Country , 2016-2032
- 4.6.2.1. The US
- 4.6.2.2. Canada
- 4.6.2.3. Mexico
- 5. Western Europe Fish Protein Hydrolysate Market Analysis, Opportunity and Forecast, 2016-2032
- 5.1. Western Europe Fish Protein Hydrolysate Market Analysis, 2016-2021
- 5.2. Western Europe Fish Protein Hydrolysate Market Opportunity and Forecast, 2023-2032
- 5.3. Western Europe Fish Protein Hydrolysate Market Analysis, Opportunity and Forecast, By By Form , 2016-2032
- 5.3.1. Western Europe Fish Protein Hydrolysate Market Analysis by By Form : Introduction
- 5.3.2. Market Size Absolute $ Opportunity Analysis and Forecast, By By Form , 2016-2032
- 5.3.3. Powder
- 5.3.4. Liquid
- 5.4. Western Europe Fish Protein Hydrolysate Market Analysis, Opportunity and Forecast, By By Application, 2016-2032
- 5.4.1. Western Europe Fish Protein Hydrolysate Market Analysis by By Application: Introduction
- 5.4.2. Market Size Absolute $ Opportunity Analysis and Forecast, By By Application, 2016-2032
- 5.4.3. Food
- 5.4.4. Pharmaceuticals
- 5.4.5. Animal Feed & Pet Food
- 5.4.6. Personal Care
- 5.4.7. Agriculture
- 5.5. Western Europe Fish Protein Hydrolysate Market Analysis, Opportunity and Forecast, By By Source , 2016-2032
- 5.5.1. Western Europe Fish Protein Hydrolysate Market Analysis by By Source : Introduction
- 5.5.2. Market Size Absolute $ Opportunity Analysis and Forecast, By By Source , 2016-2032
- 5.5.3. Anchovy
- 5.5.4. Herring
- 5.5.5. Salmon
- 5.5.6. Tuna
- 5.5.7. Others
- 5.6. Western Europe Fish Protein Hydrolysate Market Analysis, Opportunity and Forecast, By Country , 2016-2032
- 5.6.1. Western Europe Fish Protein Hydrolysate Market Analysis by Country : Introduction
- 5.6.2. Market Size Absolute $ Opportunity Analysis and Forecast, Country , 2016-2032
- 5.6.2.1. Germany
- 5.6.2.2. France
- 5.6.2.3. The UK
- 5.6.2.4. Spain
- 5.6.2.5. Italy
- 5.6.2.6. Portugal
- 5.6.2.7. Ireland
- 5.6.2.8. Austria
- 5.6.2.9. Switzerland
- 5.6.2.10. Benelux
- 5.6.2.11. Nordic
- 5.6.2.12. Rest of Western Europe
- 6. Eastern Europe Fish Protein Hydrolysate Market Analysis, Opportunity and Forecast, 2016-2032
- 6.1. Eastern Europe Fish Protein Hydrolysate Market Analysis, 2016-2021
- 6.2. Eastern Europe Fish Protein Hydrolysate Market Opportunity and Forecast, 2023-2032
- 6.3. Eastern Europe Fish Protein Hydrolysate Market Analysis, Opportunity and Forecast, By By Form , 2016-2032
- 6.3.1. Eastern Europe Fish Protein Hydrolysate Market Analysis by By Form : Introduction
- 6.3.2. Market Size Absolute $ Opportunity Analysis and Forecast, By By Form , 2016-2032
- 6.3.3. Powder
- 6.3.4. Liquid
- 6.4. Eastern Europe Fish Protein Hydrolysate Market Analysis, Opportunity and Forecast, By By Application, 2016-2032
- 6.4.1. Eastern Europe Fish Protein Hydrolysate Market Analysis by By Application: Introduction
- 6.4.2. Market Size Absolute $ Opportunity Analysis and Forecast, By By Application, 2016-2032
- 6.4.3. Food
- 6.4.4. Pharmaceuticals
- 6.4.5. Animal Feed & Pet Food
- 6.4.6. Personal Care
- 6.4.7. Agriculture
- 6.5. Eastern Europe Fish Protein Hydrolysate Market Analysis, Opportunity and Forecast, By By Source , 2016-2032
- 6.5.1. Eastern Europe Fish Protein Hydrolysate Market Analysis by By Source : Introduction
- 6.5.2. Market Size Absolute $ Opportunity Analysis and Forecast, By By Source , 2016-2032
- 6.5.3. Anchovy
- 6.5.4. Herring
- 6.5.5. Salmon
- 6.5.6. Tuna
- 6.5.7. Others
- 6.6. Eastern Europe Fish Protein Hydrolysate Market Analysis, Opportunity and Forecast, By Country , 2016-2032
- 6.6.1. Eastern Europe Fish Protein Hydrolysate Market Analysis by Country : Introduction
- 6.6.2. Market Size Absolute $ Opportunity Analysis and Forecast, Country , 2016-2032
- 6.6.2.1. Russia
- 6.6.2.2. Poland
- 6.6.2.3. The Czech Republic
- 6.6.2.4. Greece
- 6.6.2.5. Rest of Eastern Europe
- 7. APAC Fish Protein Hydrolysate Market Analysis, Opportunity and Forecast, 2016-2032
- 7.1. APAC Fish Protein Hydrolysate Market Analysis, 2016-2021
- 7.2. APAC Fish Protein Hydrolysate Market Opportunity and Forecast, 2023-2032
- 7.3. APAC Fish Protein Hydrolysate Market Analysis, Opportunity and Forecast, By By Form , 2016-2032
- 7.3.1. APAC Fish Protein Hydrolysate Market Analysis by By Form : Introduction
- 7.3.2. Market Size Absolute $ Opportunity Analysis and Forecast, By By Form , 2016-2032
- 7.3.3. Powder
- 7.3.4. Liquid
- 7.4. APAC Fish Protein Hydrolysate Market Analysis, Opportunity and Forecast, By By Application, 2016-2032
- 7.4.1. APAC Fish Protein Hydrolysate Market Analysis by By Application: Introduction
- 7.4.2. Market Size Absolute $ Opportunity Analysis and Forecast, By By Application, 2016-2032
- 7.4.3. Food
- 7.4.4. Pharmaceuticals
- 7.4.5. Animal Feed & Pet Food
- 7.4.6. Personal Care
- 7.4.7. Agriculture
- 7.5. APAC Fish Protein Hydrolysate Market Analysis, Opportunity and Forecast, By By Source , 2016-2032
- 7.5.1. APAC Fish Protein Hydrolysate Market Analysis by By Source : Introduction
- 7.5.2. Market Size Absolute $ Opportunity Analysis and Forecast, By By Source , 2016-2032
- 7.5.3. Anchovy
- 7.5.4. Herring
- 7.5.5. Salmon
- 7.5.6. Tuna
- 7.5.7. Others
- 7.6. APAC Fish Protein Hydrolysate Market Analysis, Opportunity and Forecast, By Country , 2016-2032
- 7.6.1. APAC Fish Protein Hydrolysate Market Analysis by Country : Introduction
- 7.6.2. Market Size Absolute $ Opportunity Analysis and Forecast, Country , 2016-2032
- 7.6.2.1. China
- 7.6.2.2. Japan
- 7.6.2.3. South Korea
- 7.6.2.4. India
- 7.6.2.5. Australia & New Zeland
- 7.6.2.6. Indonesia
- 7.6.2.7. Malaysia
- 7.6.2.8. Philippines
- 7.6.2.9. Singapore
- 7.6.2.10. Thailand
- 7.6.2.11. Vietnam
- 7.6.2.12. Rest of APAC
- 8. Latin America Fish Protein Hydrolysate Market Analysis, Opportunity and Forecast, 2016-2032
- 8.1. Latin America Fish Protein Hydrolysate Market Analysis, 2016-2021
- 8.2. Latin America Fish Protein Hydrolysate Market Opportunity and Forecast, 2023-2032
- 8.3. Latin America Fish Protein Hydrolysate Market Analysis, Opportunity and Forecast, By By Form , 2016-2032
- 8.3.1. Latin America Fish Protein Hydrolysate Market Analysis by By Form : Introduction
- 8.3.2. Market Size Absolute $ Opportunity Analysis and Forecast, By By Form , 2016-2032
- 8.3.3. Powder
- 8.3.4. Liquid
- 8.4. Latin America Fish Protein Hydrolysate Market Analysis, Opportunity and Forecast, By By Application, 2016-2032
- 8.4.1. Latin America Fish Protein Hydrolysate Market Analysis by By Application: Introduction
- 8.4.2. Market Size Absolute $ Opportunity Analysis and Forecast, By By Application, 2016-2032
- 8.4.3. Food
- 8.4.4. Pharmaceuticals
- 8.4.5. Animal Feed & Pet Food
- 8.4.6. Personal Care
- 8.4.7. Agriculture
- 8.5. Latin America Fish Protein Hydrolysate Market Analysis, Opportunity and Forecast, By By Source , 2016-2032
- 8.5.1. Latin America Fish Protein Hydrolysate Market Analysis by By Source : Introduction
- 8.5.2. Market Size Absolute $ Opportunity Analysis and Forecast, By By Source , 2016-2032
- 8.5.3. Anchovy
- 8.5.4. Herring
- 8.5.5. Salmon
- 8.5.6. Tuna
- 8.5.7. Others
- 8.6. Latin America Fish Protein Hydrolysate Market Analysis, Opportunity and Forecast, By Country , 2016-2032
- 8.6.1. Latin America Fish Protein Hydrolysate Market Analysis by Country : Introduction
- 8.6.2. Market Size Absolute $ Opportunity Analysis and Forecast, Country , 2016-2032
- 8.6.2.1. Brazil
- 8.6.2.2. Colombia
- 8.6.2.3. Chile
- 8.6.2.4. Argentina
- 8.6.2.5. Costa Rica
- 8.6.2.6. Rest of Latin America
- 9. Middle East & Africa Fish Protein Hydrolysate Market Analysis, Opportunity and Forecast, 2016-2032
- 9.1. Middle East & Africa Fish Protein Hydrolysate Market Analysis, 2016-2021
- 9.2. Middle East & Africa Fish Protein Hydrolysate Market Opportunity and Forecast, 2023-2032
- 9.3. Middle East & Africa Fish Protein Hydrolysate Market Analysis, Opportunity and Forecast, By By Form , 2016-2032
- 9.3.1. Middle East & Africa Fish Protein Hydrolysate Market Analysis by By Form : Introduction
- 9.3.2. Market Size Absolute $ Opportunity Analysis and Forecast, By By Form , 2016-2032
- 9.3.3. Powder
- 9.3.4. Liquid
- 9.4. Middle East & Africa Fish Protein Hydrolysate Market Analysis, Opportunity and Forecast, By By Application, 2016-2032
- 9.4.1. Middle East & Africa Fish Protein Hydrolysate Market Analysis by By Application: Introduction
- 9.4.2. Market Size Absolute $ Opportunity Analysis and Forecast, By By Application, 2016-2032
- 9.4.3. Food
- 9.4.4. Pharmaceuticals
- 9.4.5. Animal Feed & Pet Food
- 9.4.6. Personal Care
- 9.4.7. Agriculture
- 9.5. Middle East & Africa Fish Protein Hydrolysate Market Analysis, Opportunity and Forecast, By By Source , 2016-2032
- 9.5.1. Middle East & Africa Fish Protein Hydrolysate Market Analysis by By Source : Introduction
- 9.5.2. Market Size Absolute $ Opportunity Analysis and Forecast, By By Source , 2016-2032
- 9.5.3. Anchovy
- 9.5.4. Herring
- 9.5.5. Salmon
- 9.5.6. Tuna
- 9.5.7. Others
- 9.6. Middle East & Africa Fish Protein Hydrolysate Market Analysis, Opportunity and Forecast, By Country , 2016-2032
- 9.6.1. Middle East & Africa Fish Protein Hydrolysate Market Analysis by Country : Introduction
- 9.6.2. Market Size Absolute $ Opportunity Analysis and Forecast, Country , 2016-2032
- 9.6.2.1. Algeria
- 9.6.2.2. Egypt
- 9.6.2.3. Israel
- 9.6.2.4. Kuwait
- 9.6.2.5. Nigeria
- 9.6.2.6. Saudi Arabia
- 9.6.2.7. South Africa
- 9.6.2.8. Turkey
- 9.6.2.9. The UAE
- 9.6.2.10. Rest of MEA
- 10. Global Fish Protein Hydrolysate Market Analysis, Opportunity and Forecast, By Region , 2016-2032
- 10.1. Global Fish Protein Hydrolysate Market Analysis by Region : Introduction
- 10.2. Market Size Absolute $ Opportunity Analysis and Forecast, By Region , 2016-2032
- 10.2.1. North America
- 10.2.2. Western Europe
- 10.2.3. Eastern Europe
- 10.2.4. APAC
- 10.2.5. Latin America
- 10.2.6. Middle East & Africa
- 11. Global Fish Protein Hydrolysate Market Competitive Landscape, Market Share Analysis, and Company Profiles
- 11.1. Market Share Analysis
- 11.2. Company Profiles
- 11.3. Hofseth BioCare ASA
- 11.3.1. Company Overview
- 11.3.2. Financial Highlights
- 11.3.3. Product Portfolio
- 11.3.4. SWOT Analysis
- 11.3.5. Key Strategies and Developments
- 11.4. Diana Group (Symrise)
- 11.4.1. Company Overview
- 11.4.2. Financial Highlights
- 11.4.3. Product Portfolio
- 11.4.4. SWOT Analysis
- 11.4.5. Key Strategies and Developments
- 11.5. Bio-marine Ingredients Ireland
- 11.5.1. Company Overview
- 11.5.2. Financial Highlights
- 11.5.3. Product Portfolio
- 11.5.4. SWOT Analysis
- 11.5.5. Key Strategies and Developments
- 11.6. Copalis
- 11.6.1. Company Overview
- 11.6.2. Financial Highlights
- 11.6.3. Product Portfolio
- 11.6.4. SWOT Analysis
- 11.6.5. Key Strategies and Developments
- 11.7. Janatha Fish Meal & Oil Products
- 11.7.1. Company Overview
- 11.7.2. Financial Highlights
- 11.7.3. Product Portfolio
- 11.7.4. SWOT Analysis
- 11.7.5. Key Strategies and Developments
- 11.8. Scanbio Marine Group AS
- 11.8.1. Company Overview
- 11.8.2. Financial Highlights
- 11.8.3. Product Portfolio
- 11.8.4. SWOT Analysis
- 11.8.5. Key Strategies and Developments
- 11.9. Shenzhen Taier
- 11.9.1. Company Overview
- 11.9.2. Financial Highlights
- 11.9.3. Product Portfolio
- 11.9.4. SWOT Analysis
- 11.9.5. Key Strategies and Developments
- 11.10. Omega Protein Corporation
- 11.10.1. Company Overview
- 11.10.2. Financial Highlights
- 11.10.3. Product Portfolio
- 11.10.4. SWOT Analysis
- 11.10.5. Key Strategies and Developments
- 11.11. Biomega
- 11.11.1. Company Overview
- 11.11.2. Financial Highlights
- 11.11.3. Product Portfolio
- 11.11.4. SWOT Analysis
- 11.11.5. Key Strategies and Developments
- 11.12. Pelagia
- 11.12.1. Company Overview
- 11.12.2. Financial Highlights
- 11.12.3. Product Portfolio
- 11.12.4. SWOT Analysis
- 11.12.5. Key Strategies and Developments
- 11.13.1. Company Overview
- 11.13.2. Financial Highlights
- 11.13.3. Product Portfolio
- 11.13.4. SWOT Analysis
- 11.13.5. Key Strategies and Developments
- 11.14. Neptune’s Harvest
- 11.14.1. Company Overview
- 11.14.2. Financial Highlights
- 11.14.3. Product Portfolio
- 11.14.4. SWOT Analysis
- 11.14.5. Key Strategies and Developments
- 12. Assumptions and Acronyms
- 13. Research Methodology
- 14. Contact
"
- List of Figures
- "
- Figure 1: Global Fish Protein Hydrolysate Market Revenue (US$ Mn) Market Share by By Form in 2022
- Figure 2: Global Fish Protein Hydrolysate Market Market Attractiveness Analysis by By Form , 2016-2032
- Figure 3: Global Fish Protein Hydrolysate Market Revenue (US$ Mn) Market Share by By Applicationin 2022
- Figure 4: Global Fish Protein Hydrolysate Market Market Attractiveness Analysis by By Application, 2016-2032
- Figure 5: Global Fish Protein Hydrolysate Market Revenue (US$ Mn) Market Share by By Source in 2022
- Figure 6: Global Fish Protein Hydrolysate Market Market Attractiveness Analysis by By Source , 2016-2032
- Figure 7: Global Fish Protein Hydrolysate Market Revenue (US$ Mn) Market Share by Region in 2022
- Figure 8: Global Fish Protein Hydrolysate Market Market Attractiveness Analysis by Region, 2016-2032
- Figure 9: Global Fish Protein Hydrolysate Market Market Revenue (US$ Mn) (2016-2032)
- Figure 10: Global Fish Protein Hydrolysate Market Market Revenue (US$ Mn) Comparison by Region (2016-2032)
- Figure 11: Global Fish Protein Hydrolysate Market Market Revenue (US$ Mn) Comparison by By Form (2016-2032)
- Figure 12: Global Fish Protein Hydrolysate Market Market Revenue (US$ Mn) Comparison by By Application (2016-2032)
- Figure 13: Global Fish Protein Hydrolysate Market Market Revenue (US$ Mn) Comparison by By Source (2016-2032)
- Figure 14: Global Fish Protein Hydrolysate Market Market Y-o-Y Growth Rate Comparison by Region (2016-2032)
- Figure 15: Global Fish Protein Hydrolysate Market Market Y-o-Y Growth Rate Comparison by By Form (2016-2032)
- Figure 16: Global Fish Protein Hydrolysate Market Market Y-o-Y Growth Rate Comparison by By Application (2016-2032)
- Figure 17: Global Fish Protein Hydrolysate Market Market Y-o-Y Growth Rate Comparison by By Source (2016-2032)
- Figure 18: Global Fish Protein Hydrolysate Market Market Share Comparison by Region (2016-2032)
- Figure 19: Global Fish Protein Hydrolysate Market Market Share Comparison by By Form (2016-2032)
- Figure 20: Global Fish Protein Hydrolysate Market Market Share Comparison by By Application (2016-2032)
- Figure 21: Global Fish Protein Hydrolysate Market Market Share Comparison by By Source (2016-2032)
- Figure 22: North America Fish Protein Hydrolysate Market Revenue (US$ Mn) Market Share by By Form in 2022
- Figure 23: North America Fish Protein Hydrolysate Market Market Attractiveness Analysis by By Form , 2016-2032
- Figure 24: North America Fish Protein Hydrolysate Market Revenue (US$ Mn) Market Share by By Applicationin 2022
- Figure 25: North America Fish Protein Hydrolysate Market Market Attractiveness Analysis by By Application, 2016-2032
- Figure 26: North America Fish Protein Hydrolysate Market Revenue (US$ Mn) Market Share by By Source in 2022
- Figure 27: North America Fish Protein Hydrolysate Market Market Attractiveness Analysis by By Source , 2016-2032
- Figure 28: North America Fish Protein Hydrolysate Market Revenue (US$ Mn) Market Share by Country in 2022
- Figure 29: North America Fish Protein Hydrolysate Market Market Attractiveness Analysis by Country, 2016-2032
- Figure 30: North America Fish Protein Hydrolysate Market Market Revenue (US$ Mn) (2016-2032)
- Figure 31: North America Fish Protein Hydrolysate Market Market Revenue (US$ Mn) Comparison by Country (2016-2032)
- Figure 32: North America Fish Protein Hydrolysate Market Market Revenue (US$ Mn) Comparison by By Form (2016-2032)
- Figure 33: North America Fish Protein Hydrolysate Market Market Revenue (US$ Mn) Comparison by By Application (2016-2032)
- Figure 34: North America Fish Protein Hydrolysate Market Market Revenue (US$ Mn) Comparison by By Source (2016-2032)
- Figure 35: North America Fish Protein Hydrolysate Market Market Y-o-Y Growth Rate Comparison by Country (2016-2032)
- Figure 36: North America Fish Protein Hydrolysate Market Market Y-o-Y Growth Rate Comparison by By Form (2016-2032)
- Figure 37: North America Fish Protein Hydrolysate Market Market Y-o-Y Growth Rate Comparison by By Application (2016-2032)
- Figure 38: North America Fish Protein Hydrolysate Market Market Y-o-Y Growth Rate Comparison by By Source (2016-2032)
- Figure 39: North America Fish Protein Hydrolysate Market Market Share Comparison by Country (2016-2032)
- Figure 40: North America Fish Protein Hydrolysate Market Market Share Comparison by By Form (2016-2032)
- Figure 41: North America Fish Protein Hydrolysate Market Market Share Comparison by By Application (2016-2032)
- Figure 42: North America Fish Protein Hydrolysate Market Market Share Comparison by By Source (2016-2032)
- Figure 43: Western Europe Fish Protein Hydrolysate Market Revenue (US$ Mn) Market Share by By Form in 2022
- Figure 44: Western Europe Fish Protein Hydrolysate Market Market Attractiveness Analysis by By Form , 2016-2032
- Figure 45: Western Europe Fish Protein Hydrolysate Market Revenue (US$ Mn) Market Share by By Applicationin 2022
- Figure 46: Western Europe Fish Protein Hydrolysate Market Market Attractiveness Analysis by By Application, 2016-2032
- Figure 47: Western Europe Fish Protein Hydrolysate Market Revenue (US$ Mn) Market Share by By Source in 2022
- Figure 48: Western Europe Fish Protein Hydrolysate Market Market Attractiveness Analysis by By Source , 2016-2032
- Figure 49: Western Europe Fish Protein Hydrolysate Market Revenue (US$ Mn) Market Share by Country in 2022
- Figure 50: Western Europe Fish Protein Hydrolysate Market Market Attractiveness Analysis by Country, 2016-2032
- Figure 51: Western Europe Fish Protein Hydrolysate Market Market Revenue (US$ Mn) (2016-2032)
- Figure 52: Western Europe Fish Protein Hydrolysate Market Market Revenue (US$ Mn) Comparison by Country (2016-2032)
- Figure 53: Western Europe Fish Protein Hydrolysate Market Market Revenue (US$ Mn) Comparison by By Form (2016-2032)
- Figure 54: Western Europe Fish Protein Hydrolysate Market Market Revenue (US$ Mn) Comparison by By Application (2016-2032)
- Figure 55: Western Europe Fish Protein Hydrolysate Market Market Revenue (US$ Mn) Comparison by By Source (2016-2032)
- Figure 56: Western Europe Fish Protein Hydrolysate Market Market Y-o-Y Growth Rate Comparison by Country (2016-2032)
- Figure 57: Western Europe Fish Protein Hydrolysate Market Market Y-o-Y Growth Rate Comparison by By Form (2016-2032)
- Figure 58: Western Europe Fish Protein Hydrolysate Market Market Y-o-Y Growth Rate Comparison by By Application (2016-2032)
- Figure 59: Western Europe Fish Protein Hydrolysate Market Market Y-o-Y Growth Rate Comparison by By Source (2016-2032)
- Figure 60: Western Europe Fish Protein Hydrolysate Market Market Share Comparison by Country (2016-2032)
- Figure 61: Western Europe Fish Protein Hydrolysate Market Market Share Comparison by By Form (2016-2032)
- Figure 62: Western Europe Fish Protein Hydrolysate Market Market Share Comparison by By Application (2016-2032)
- Figure 63: Western Europe Fish Protein Hydrolysate Market Market Share Comparison by By Source (2016-2032)
- Figure 64: Eastern Europe Fish Protein Hydrolysate Market Revenue (US$ Mn) Market Share by By Form in 2022
- Figure 65: Eastern Europe Fish Protein Hydrolysate Market Market Attractiveness Analysis by By Form , 2016-2032
- Figure 66: Eastern Europe Fish Protein Hydrolysate Market Revenue (US$ Mn) Market Share by By Applicationin 2022
- Figure 67: Eastern Europe Fish Protein Hydrolysate Market Market Attractiveness Analysis by By Application, 2016-2032
- Figure 68: Eastern Europe Fish Protein Hydrolysate Market Revenue (US$ Mn) Market Share by By Source in 2022
- Figure 69: Eastern Europe Fish Protein Hydrolysate Market Market Attractiveness Analysis by By Source , 2016-2032
- Figure 70: Eastern Europe Fish Protein Hydrolysate Market Revenue (US$ Mn) Market Share by Country in 2022
- Figure 71: Eastern Europe Fish Protein Hydrolysate Market Market Attractiveness Analysis by Country, 2016-2032
- Figure 72: Eastern Europe Fish Protein Hydrolysate Market Market Revenue (US$ Mn) (2016-2032)
- Figure 73: Eastern Europe Fish Protein Hydrolysate Market Market Revenue (US$ Mn) Comparison by Country (2016-2032)
- Figure 74: Eastern Europe Fish Protein Hydrolysate Market Market Revenue (US$ Mn) Comparison by By Form (2016-2032)
- Figure 75: Eastern Europe Fish Protein Hydrolysate Market Market Revenue (US$ Mn) Comparison by By Application (2016-2032)
- Figure 76: Eastern Europe Fish Protein Hydrolysate Market Market Revenue (US$ Mn) Comparison by By Source (2016-2032)
- Figure 77: Eastern Europe Fish Protein Hydrolysate Market Market Y-o-Y Growth Rate Comparison by Country (2016-2032)
- Figure 78: Eastern Europe Fish Protein Hydrolysate Market Market Y-o-Y Growth Rate Comparison by By Form (2016-2032)
- Figure 79: Eastern Europe Fish Protein Hydrolysate Market Market Y-o-Y Growth Rate Comparison by By Application (2016-2032)
- Figure 80: Eastern Europe Fish Protein Hydrolysate Market Market Y-o-Y Growth Rate Comparison by By Source (2016-2032)
- Figure 81: Eastern Europe Fish Protein Hydrolysate Market Market Share Comparison by Country (2016-2032)
- Figure 82: Eastern Europe Fish Protein Hydrolysate Market Market Share Comparison by By Form (2016-2032)
- Figure 83: Eastern Europe Fish Protein Hydrolysate Market Market Share Comparison by By Application (2016-2032)
- Figure 84: Eastern Europe Fish Protein Hydrolysate Market Market Share Comparison by By Source (2016-2032)
- Figure 85: APAC Fish Protein Hydrolysate Market Revenue (US$ Mn) Market Share by By Form in 2022
- Figure 86: APAC Fish Protein Hydrolysate Market Market Attractiveness Analysis by By Form , 2016-2032
- Figure 87: APAC Fish Protein Hydrolysate Market Revenue (US$ Mn) Market Share by By Applicationin 2022
- Figure 88: APAC Fish Protein Hydrolysate Market Market Attractiveness Analysis by By Application, 2016-2032
- Figure 89: APAC Fish Protein Hydrolysate Market Revenue (US$ Mn) Market Share by By Source in 2022
- Figure 90: APAC Fish Protein Hydrolysate Market Market Attractiveness Analysis by By Source , 2016-2032
- Figure 91: APAC Fish Protein Hydrolysate Market Revenue (US$ Mn) Market Share by Country in 2022
- Figure 92: APAC Fish Protein Hydrolysate Market Market Attractiveness Analysis by Country, 2016-2032
- Figure 93: APAC Fish Protein Hydrolysate Market Market Revenue (US$ Mn) (2016-2032)
- Figure 94: APAC Fish Protein Hydrolysate Market Market Revenue (US$ Mn) Comparison by Country (2016-2032)
- Figure 95: APAC Fish Protein Hydrolysate Market Market Revenue (US$ Mn) Comparison by By Form (2016-2032)
- Figure 96: APAC Fish Protein Hydrolysate Market Market Revenue (US$ Mn) Comparison by By Application (2016-2032)
- Figure 97: APAC Fish Protein Hydrolysate Market Market Revenue (US$ Mn) Comparison by By Source (2016-2032)
- Figure 98: APAC Fish Protein Hydrolysate Market Market Y-o-Y Growth Rate Comparison by Country (2016-2032)
- Figure 99: APAC Fish Protein Hydrolysate Market Market Y-o-Y Growth Rate Comparison by By Form (2016-2032)
- Figure 100: APAC Fish Protein Hydrolysate Market Market Y-o-Y Growth Rate Comparison by By Application (2016-2032)
- Figure 101: APAC Fish Protein Hydrolysate Market Market Y-o-Y Growth Rate Comparison by By Source (2016-2032)
- Figure 102: APAC Fish Protein Hydrolysate Market Market Share Comparison by Country (2016-2032)
- Figure 103: APAC Fish Protein Hydrolysate Market Market Share Comparison by By Form (2016-2032)
- Figure 104: APAC Fish Protein Hydrolysate Market Market Share Comparison by By Application (2016-2032)
- Figure 105: APAC Fish Protein Hydrolysate Market Market Share Comparison by By Source (2016-2032)
- Figure 106: Latin America Fish Protein Hydrolysate Market Revenue (US$ Mn) Market Share by By Form in 2022
- Figure 107: Latin America Fish Protein Hydrolysate Market Market Attractiveness Analysis by By Form , 2016-2032
- Figure 108: Latin America Fish Protein Hydrolysate Market Revenue (US$ Mn) Market Share by By Applicationin 2022
- Figure 109: Latin America Fish Protein Hydrolysate Market Market Attractiveness Analysis by By Application, 2016-2032
- Figure 110: Latin America Fish Protein Hydrolysate Market Revenue (US$ Mn) Market Share by By Source in 2022
- Figure 111: Latin America Fish Protein Hydrolysate Market Market Attractiveness Analysis by By Source , 2016-2032
- Figure 112: Latin America Fish Protein Hydrolysate Market Revenue (US$ Mn) Market Share by Country in 2022
- Figure 113: Latin America Fish Protein Hydrolysate Market Market Attractiveness Analysis by Country, 2016-2032
- Figure 114: Latin America Fish Protein Hydrolysate Market Market Revenue (US$ Mn) (2016-2032)
- Figure 115: Latin America Fish Protein Hydrolysate Market Market Revenue (US$ Mn) Comparison by Country (2016-2032)
- Figure 116: Latin America Fish Protein Hydrolysate Market Market Revenue (US$ Mn) Comparison by By Form (2016-2032)
- Figure 117: Latin America Fish Protein Hydrolysate Market Market Revenue (US$ Mn) Comparison by By Application (2016-2032)
- Figure 118: Latin America Fish Protein Hydrolysate Market Market Revenue (US$ Mn) Comparison by By Source (2016-2032)
- Figure 119: Latin America Fish Protein Hydrolysate Market Market Y-o-Y Growth Rate Comparison by Country (2016-2032)
- Figure 120: Latin America Fish Protein Hydrolysate Market Market Y-o-Y Growth Rate Comparison by By Form (2016-2032)
- Figure 121: Latin America Fish Protein Hydrolysate Market Market Y-o-Y Growth Rate Comparison by By Application (2016-2032)
- Figure 122: Latin America Fish Protein Hydrolysate Market Market Y-o-Y Growth Rate Comparison by By Source (2016-2032)
- Figure 123: Latin America Fish Protein Hydrolysate Market Market Share Comparison by Country (2016-2032)
- Figure 124: Latin America Fish Protein Hydrolysate Market Market Share Comparison by By Form (2016-2032)
- Figure 125: Latin America Fish Protein Hydrolysate Market Market Share Comparison by By Application (2016-2032)
- Figure 126: Latin America Fish Protein Hydrolysate Market Market Share Comparison by By Source (2016-2032)
- Figure 127: Middle East & Africa Fish Protein Hydrolysate Market Revenue (US$ Mn) Market Share by By Form in 2022
- Figure 128: Middle East & Africa Fish Protein Hydrolysate Market Market Attractiveness Analysis by By Form , 2016-2032
- Figure 129: Middle East & Africa Fish Protein Hydrolysate Market Revenue (US$ Mn) Market Share by By Applicationin 2022
- Figure 130: Middle East & Africa Fish Protein Hydrolysate Market Market Attractiveness Analysis by By Application, 2016-2032
- Figure 131: Middle East & Africa Fish Protein Hydrolysate Market Revenue (US$ Mn) Market Share by By Source in 2022
- Figure 132: Middle East & Africa Fish Protein Hydrolysate Market Market Attractiveness Analysis by By Source , 2016-2032
- Figure 133: Middle East & Africa Fish Protein Hydrolysate Market Revenue (US$ Mn) Market Share by Country in 2022
- Figure 134: Middle East & Africa Fish Protein Hydrolysate Market Market Attractiveness Analysis by Country, 2016-2032
- Figure 135: Middle East & Africa Fish Protein Hydrolysate Market Market Revenue (US$ Mn) (2016-2032)
- Figure 136: Middle East & Africa Fish Protein Hydrolysate Market Market Revenue (US$ Mn) Comparison by Country (2016-2032)
- Figure 137: Middle East & Africa Fish Protein Hydrolysate Market Market Revenue (US$ Mn) Comparison by By Form (2016-2032)
- Figure 138: Middle East & Africa Fish Protein Hydrolysate Market Market Revenue (US$ Mn) Comparison by By Application (2016-2032)
- Figure 139: Middle East & Africa Fish Protein Hydrolysate Market Market Revenue (US$ Mn) Comparison by By Source (2016-2032)
- Figure 140: Middle East & Africa Fish Protein Hydrolysate Market Market Y-o-Y Growth Rate Comparison by Country (2016-2032)
- Figure 141: Middle East & Africa Fish Protein Hydrolysate Market Market Y-o-Y Growth Rate Comparison by By Form (2016-2032)
- Figure 142: Middle East & Africa Fish Protein Hydrolysate Market Market Y-o-Y Growth Rate Comparison by By Application (2016-2032)
- Figure 143: Middle East & Africa Fish Protein Hydrolysate Market Market Y-o-Y Growth Rate Comparison by By Source (2016-2032)
- Figure 144: Middle East & Africa Fish Protein Hydrolysate Market Market Share Comparison by Country (2016-2032)
- Figure 145: Middle East & Africa Fish Protein Hydrolysate Market Market Share Comparison by By Form (2016-2032)
- Figure 146: Middle East & Africa Fish Protein Hydrolysate Market Market Share Comparison by By Application (2016-2032)
- Figure 147: Middle East & Africa Fish Protein Hydrolysate Market Market Share Comparison by By Source (2016-2032)
"
- List of Tables
- "
- Table 1: Global Fish Protein Hydrolysate Market Market Comparison by By Form (2016-2032)
- Table 2: Global Fish Protein Hydrolysate Market Market Comparison by By Application (2016-2032)
- Table 3: Global Fish Protein Hydrolysate Market Market Comparison by By Source (2016-2032)
- Table 4: Global Fish Protein Hydrolysate Market Revenue (US$ Mn) Comparison by Region (2016-2032)
- Table 5: Global Fish Protein Hydrolysate Market Market Revenue (US$ Mn) (2016-2032)
- Table 6: Global Fish Protein Hydrolysate Market Market Revenue (US$ Mn) Comparison by Region (2016-2032)
- Table 7: Global Fish Protein Hydrolysate Market Market Revenue (US$ Mn) Comparison by By Form (2016-2032)
- Table 8: Global Fish Protein Hydrolysate Market Market Revenue (US$ Mn) Comparison by By Application (2016-2032)
- Table 9: Global Fish Protein Hydrolysate Market Market Revenue (US$ Mn) Comparison by By Source (2016-2032)
- Table 10: Global Fish Protein Hydrolysate Market Market Y-o-Y Growth Rate Comparison by Region (2016-2032)
- Table 11: Global Fish Protein Hydrolysate Market Market Y-o-Y Growth Rate Comparison by By Form (2016-2032)
- Table 12: Global Fish Protein Hydrolysate Market Market Y-o-Y Growth Rate Comparison by By Application (2016-2032)
- Table 13: Global Fish Protein Hydrolysate Market Market Y-o-Y Growth Rate Comparison by By Source (2016-2032)
- Table 14: Global Fish Protein Hydrolysate Market Market Share Comparison by Region (2016-2032)
- Table 15: Global Fish Protein Hydrolysate Market Market Share Comparison by By Form (2016-2032)
- Table 16: Global Fish Protein Hydrolysate Market Market Share Comparison by By Application (2016-2032)
- Table 17: Global Fish Protein Hydrolysate Market Market Share Comparison by By Source (2016-2032)
- Table 18: North America Fish Protein Hydrolysate Market Market Comparison by By Application (2016-2032)
- Table 19: North America Fish Protein Hydrolysate Market Market Comparison by By Source (2016-2032)
- Table 20: North America Fish Protein Hydrolysate Market Revenue (US$ Mn) Comparison by Country (2016-2032)
- Table 21: North America Fish Protein Hydrolysate Market Market Revenue (US$ Mn) (2016-2032)
- Table 22: North America Fish Protein Hydrolysate Market Market Revenue (US$ Mn) Comparison by Country (2016-2032)
- Table 23: North America Fish Protein Hydrolysate Market Market Revenue (US$ Mn) Comparison by By Form (2016-2032)
- Table 24: North America Fish Protein Hydrolysate Market Market Revenue (US$ Mn) Comparison by By Application (2016-2032)
- Table 25: North America Fish Protein Hydrolysate Market Market Revenue (US$ Mn) Comparison by By Source (2016-2032)
- Table 26: North America Fish Protein Hydrolysate Market Market Y-o-Y Growth Rate Comparison by Country (2016-2032)
- Table 27: North America Fish Protein Hydrolysate Market Market Y-o-Y Growth Rate Comparison by By Form (2016-2032)
- Table 28: North America Fish Protein Hydrolysate Market Market Y-o-Y Growth Rate Comparison by By Application (2016-2032)
- Table 29: North America Fish Protein Hydrolysate Market Market Y-o-Y Growth Rate Comparison by By Source (2016-2032)
- Table 30: North America Fish Protein Hydrolysate Market Market Share Comparison by Country (2016-2032)
- Table 31: North America Fish Protein Hydrolysate Market Market Share Comparison by By Form (2016-2032)
- Table 32: North America Fish Protein Hydrolysate Market Market Share Comparison by By Application (2016-2032)
- Table 33: North America Fish Protein Hydrolysate Market Market Share Comparison by By Source (2016-2032)
- Table 34: Western Europe Fish Protein Hydrolysate Market Market Comparison by By Form (2016-2032)
- Table 35: Western Europe Fish Protein Hydrolysate Market Market Comparison by By Application (2016-2032)
- Table 36: Western Europe Fish Protein Hydrolysate Market Market Comparison by By Source (2016-2032)
- Table 37: Western Europe Fish Protein Hydrolysate Market Revenue (US$ Mn) Comparison by Country (2016-2032)
- Table 38: Western Europe Fish Protein Hydrolysate Market Market Revenue (US$ Mn) (2016-2032)
- Table 39: Western Europe Fish Protein Hydrolysate Market Market Revenue (US$ Mn) Comparison by Country (2016-2032)
- Table 40: Western Europe Fish Protein Hydrolysate Market Market Revenue (US$ Mn) Comparison by By Form (2016-2032)
- Table 41: Western Europe Fish Protein Hydrolysate Market Market Revenue (US$ Mn) Comparison by By Application (2016-2032)
- Table 42: Western Europe Fish Protein Hydrolysate Market Market Revenue (US$ Mn) Comparison by By Source (2016-2032)
- Table 43: Western Europe Fish Protein Hydrolysate Market Market Y-o-Y Growth Rate Comparison by Country (2016-2032)
- Table 44: Western Europe Fish Protein Hydrolysate Market Market Y-o-Y Growth Rate Comparison by By Form (2016-2032)
- Table 45: Western Europe Fish Protein Hydrolysate Market Market Y-o-Y Growth Rate Comparison by By Application (2016-2032)
- Table 46: Western Europe Fish Protein Hydrolysate Market Market Y-o-Y Growth Rate Comparison by By Source (2016-2032)
- Table 47: Western Europe Fish Protein Hydrolysate Market Market Share Comparison by Country (2016-2032)
- Table 48: Western Europe Fish Protein Hydrolysate Market Market Share Comparison by By Form (2016-2032)
- Table 49: Western Europe Fish Protein Hydrolysate Market Market Share Comparison by By Application (2016-2032)
- Table 50: Western Europe Fish Protein Hydrolysate Market Market Share Comparison by By Source (2016-2032)
- Table 51: Eastern Europe Fish Protein Hydrolysate Market Market Comparison by By Form (2016-2032)
- Table 52: Eastern Europe Fish Protein Hydrolysate Market Market Comparison by By Application (2016-2032)
- Table 53: Eastern Europe Fish Protein Hydrolysate Market Market Comparison by By Source (2016-2032)
- Table 54: Eastern Europe Fish Protein Hydrolysate Market Revenue (US$ Mn) Comparison by Country (2016-2032)
- Table 55: Eastern Europe Fish Protein Hydrolysate Market Market Revenue (US$ Mn) (2016-2032)
- Table 56: Eastern Europe Fish Protein Hydrolysate Market Market Revenue (US$ Mn) Comparison by Country (2016-2032)
- Table 57: Eastern Europe Fish Protein Hydrolysate Market Market Revenue (US$ Mn) Comparison by By Form (2016-2032)
- Table 58: Eastern Europe Fish Protein Hydrolysate Market Market Revenue (US$ Mn) Comparison by By Application (2016-2032)
- Table 59: Eastern Europe Fish Protein Hydrolysate Market Market Revenue (US$ Mn) Comparison by By Source (2016-2032)
- Table 60: Eastern Europe Fish Protein Hydrolysate Market Market Y-o-Y Growth Rate Comparison by Country (2016-2032)
- Table 61: Eastern Europe Fish Protein Hydrolysate Market Market Y-o-Y Growth Rate Comparison by By Form (2016-2032)
- Table 62: Eastern Europe Fish Protein Hydrolysate Market Market Y-o-Y Growth Rate Comparison by By Application (2016-2032)
- Table 63: Eastern Europe Fish Protein Hydrolysate Market Market Y-o-Y Growth Rate Comparison by By Source (2016-2032)
- Table 64: Eastern Europe Fish Protein Hydrolysate Market Market Share Comparison by Country (2016-2032)
- Table 65: Eastern Europe Fish Protein Hydrolysate Market Market Share Comparison by By Form (2016-2032)
- Table 66: Eastern Europe Fish Protein Hydrolysate Market Market Share Comparison by By Application (2016-2032)
- Table 67: Eastern Europe Fish Protein Hydrolysate Market Market Share Comparison by By Source (2016-2032)
- Table 68: APAC Fish Protein Hydrolysate Market Market Comparison by By Form (2016-2032)
- Table 69: APAC Fish Protein Hydrolysate Market Market Comparison by By Application (2016-2032)
- Table 70: APAC Fish Protein Hydrolysate Market Market Comparison by By Source (2016-2032)
- Table 71: APAC Fish Protein Hydrolysate Market Revenue (US$ Mn) Comparison by Country (2016-2032)
- Table 72: APAC Fish Protein Hydrolysate Market Market Revenue (US$ Mn) (2016-2032)
- Table 73: APAC Fish Protein Hydrolysate Market Market Revenue (US$ Mn) Comparison by Country (2016-2032)
- Table 74: APAC Fish Protein Hydrolysate Market Market Revenue (US$ Mn) Comparison by By Form (2016-2032)
- Table 75: APAC Fish Protein Hydrolysate Market Market Revenue (US$ Mn) Comparison by By Application (2016-2032)
- Table 76: APAC Fish Protein Hydrolysate Market Market Revenue (US$ Mn) Comparison by By Source (2016-2032)
- Table 77: APAC Fish Protein Hydrolysate Market Market Y-o-Y Growth Rate Comparison by Country (2016-2032)
- Table 78: APAC Fish Protein Hydrolysate Market Market Y-o-Y Growth Rate Comparison by By Form (2016-2032)
- Table 79: APAC Fish Protein Hydrolysate Market Market Y-o-Y Growth Rate Comparison by By Application (2016-2032)
- Table 80: APAC Fish Protein Hydrolysate Market Market Y-o-Y Growth Rate Comparison by By Source (2016-2032)
- Table 81: APAC Fish Protein Hydrolysate Market Market Share Comparison by Country (2016-2032)
- Table 82: APAC Fish Protein Hydrolysate Market Market Share Comparison by By Form (2016-2032)
- Table 83: APAC Fish Protein Hydrolysate Market Market Share Comparison by By Application (2016-2032)
- Table 84: APAC Fish Protein Hydrolysate Market Market Share Comparison by By Source (2016-2032)
- Table 85: Latin America Fish Protein Hydrolysate Market Market Comparison by By Form (2016-2032)
- Table 86: Latin America Fish Protein Hydrolysate Market Market Comparison by By Application (2016-2032)
- Table 87: Latin America Fish Protein Hydrolysate Market Market Comparison by By Source (2016-2032)
- Table 88: Latin America Fish Protein Hydrolysate Market Revenue (US$ Mn) Comparison by Country (2016-2032)
- Table 89: Latin America Fish Protein Hydrolysate Market Market Revenue (US$ Mn) (2016-2032)
- Table 90: Latin America Fish Protein Hydrolysate Market Market Revenue (US$ Mn) Comparison by Country (2016-2032)
- Table 91: Latin America Fish Protein Hydrolysate Market Market Revenue (US$ Mn) Comparison by By Form (2016-2032)
- Table 92: Latin America Fish Protein Hydrolysate Market Market Revenue (US$ Mn) Comparison by By Application (2016-2032)
- Table 93: Latin America Fish Protein Hydrolysate Market Market Revenue (US$ Mn) Comparison by By Source (2016-2032)
- Table 94: Latin America Fish Protein Hydrolysate Market Market Y-o-Y Growth Rate Comparison by Country (2016-2032)
- Table 95: Latin America Fish Protein Hydrolysate Market Market Y-o-Y Growth Rate Comparison by By Form (2016-2032)
- Table 96: Latin America Fish Protein Hydrolysate Market Market Y-o-Y Growth Rate Comparison by By Application (2016-2032)
- Table 97: Latin America Fish Protein Hydrolysate Market Market Y-o-Y Growth Rate Comparison by By Source (2016-2032)
- Table 98: Latin America Fish Protein Hydrolysate Market Market Share Comparison by Country (2016-2032)
- Table 99: Latin America Fish Protein Hydrolysate Market Market Share Comparison by By Form (2016-2032)
- Table 100: Latin America Fish Protein Hydrolysate Market Market Share Comparison by By Application (2016-2032)
- Table 101: Latin America Fish Protein Hydrolysate Market Market Share Comparison by By Source (2016-2032)
- Table 102: Middle East & Africa Fish Protein Hydrolysate Market Market Comparison by By Form (2016-2032)
- Table 103: Middle East & Africa Fish Protein Hydrolysate Market Market Comparison by By Application (2016-2032)
- Table 104: Middle East & Africa Fish Protein Hydrolysate Market Market Comparison by By Source (2016-2032)
- Table 105: Middle East & Africa Fish Protein Hydrolysate Market Revenue (US$ Mn) Comparison by Country (2016-2032)
- Table 106: Middle East & Africa Fish Protein Hydrolysate Market Market Revenue (US$ Mn) (2016-2032)
- Table 107: Middle East & Africa Fish Protein Hydrolysate Market Market Revenue (US$ Mn) Comparison by Country (2016-2032)
- Table 108: Middle East & Africa Fish Protein Hydrolysate Market Market Revenue (US$ Mn) Comparison by By Form (2016-2032)
- Table 109: Middle East & Africa Fish Protein Hydrolysate Market Market Revenue (US$ Mn) Comparison by By Application (2016-2032)
- Table 110: Middle East & Africa Fish Protein Hydrolysate Market Market Revenue (US$ Mn) Comparison by By Source (2016-2032)
- Table 111: Middle East & Africa Fish Protein Hydrolysate Market Market Y-o-Y Growth Rate Comparison by Country (2016-2032)
- Table 112: Middle East & Africa Fish Protein Hydrolysate Market Market Y-o-Y Growth Rate Comparison by By Form (2016-2032)
- Table 113: Middle East & Africa Fish Protein Hydrolysate Market Market Y-o-Y Growth Rate Comparison by By Application (2016-2032)
- Table 114: Middle East & Africa Fish Protein Hydrolysate Market Market Y-o-Y Growth Rate Comparison by By Source (2016-2032)
- Table 115: Middle East & Africa Fish Protein Hydrolysate Market Market Share Comparison by Country (2016-2032)
- Table 116: Middle East & Africa Fish Protein Hydrolysate Market Market Share Comparison by By Form (2016-2032)
- Table 117: Middle East & Africa Fish Protein Hydrolysate Market Market Share Comparison by By Application (2016-2032)
- Table 118: Middle East & Africa Fish Protein Hydrolysate Market Market Share Comparison by By Source (2016-2032)
- 1. Executive Summary
-
- Hofseth BioCare ASA
- Diana Group (Symrise)
- Bio-marine Ingredients Ireland
- Copalis
- Janatha Fish Meal & Oil Products
- Scanbio Marine Group AS
- Shenzhen Taier
- Omega Protein Corporation
- Biomega
- Pelagia
- Neptune’s Harvest
Our Clients


View Our Licence Options
