
Global Field Force Automation Market Forecast, Trend Analysis And Competition Tracking - Market Insights: 2015 – 2031
-
29098
-
May 2023
-
178190178190
-


-
This report was compiled by Kalyani Khudsange Kalyani Khudsange is a Research Analyst at Prudour Pvt. Ltd. with 2.5 years of experience in market research and a strong technical background in Chemical Engineering and manufacturing. Correspondence Sr. Research Analyst Linkedin | Detailed Market research Methodology Our methodology involves a mix of primary research, including interviews with leading mental health experts, and secondary research from reputable medical journals and databases. View Detailed Methodology Page
-
Quick Navigation
- Field Force Automation Market Overview:
- What is FFA?
- What are the potential benefits of FFA for business?
- Why do businesses use FFA?
- What is a typical workflow sequence within a typical FFA implementation?
- Benefits and Challenges of Field Force Automation
- Upfront Investments for Ensuring the Security of Mobile Devices
- Competitive Landscape
- Key Segments Covered
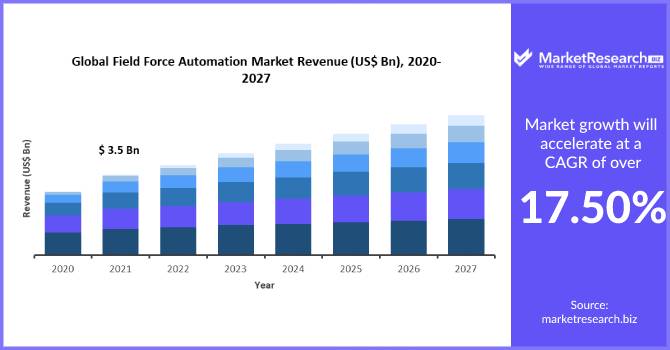
Field Force Automation Market Overview:
The Field Force Automation Market was valued at $21.40 million in 2021 & is projected to reach $54.52 million by 2027. It is expected to grow at a 12.4% CAGR between 2021 and 2027.
Field force automation is needed to improve productivity. It helps reduce the time it takes to process transactions, enabling businesses to keep up with the increased demand for services.
Automation also enables people to grow their businesses instead of spending time on mundane tasks requiring human intervention.
Implementing field force automation will allow organizations to maintain a competitive edge in the marketplace by providing customers with more offerings and greater convenience without sacrificing quality.
Field force automation can help improve productivity by reducing the time it takes to process orders, which also helps increase the efficiency and productivity of a company.
It is essential for people in charge of distribution and supply chains to stay on top of this technology as it continues to advance.
Field force automation is a software system that is designed to automate sales and customer service operations. A field force automation system automates tracking sales orders, managing inventory, and delivering products.
With a field force automation system, companies can reduce the time to process orders by automatically updating inventory levels with the most recent information from their suppliers.
In addition, because all data is stored in one place, employees can access customer information from any computer in the organization from any location.
The field force automation system is a computerized system for automating sales tasks. Typical tasks include calculating the pricing matrix, comparing existing products to new ones, and other administrative duties. This paper is about field force automation.
Field force automation, or FFA, is about decreasing the workforce needed at customer sites. This article will include the following topics:
-
What is FFA?
Field force automation is the process of automating document handling. Documents are scanned and put into a database or spreadsheet in this process. From here, these documents can be searched by keywords for easier retrieval. Documents can also be organized in folders to help with retrieval and organizing. The scanning of these documents can take a considerable amount of time, depending on the size and density of the document.
-
What are the potential benefits of FFA for business?
The article will discuss how companies use Field Force Automation (FFA) to increase productivity, decrease costs, and create better customer service. FFA is the technology that allows managers to track their field workers in real-time, improving the overall work process. It also helps keep employees accountable for their actions by assigning tasks or projects. This can be especially beneficial for industries with a large number of employees who need several supervisors.
-
Why do businesses use FFA?
There are many reasons that businesses use field force automation. First, there are cost savings. Businesses that outsource to providers of FFA can save a lot on payroll costs for scheduling and dispatching. This accessibility also means that a business can have a broader reach for making sales. Using FFA can also help with employee retention rates because it is an easy system to use – meaning employees won't need as much training time if they want to switch jobs.
-
What is a typical workflow sequence within a typical FFA implementation?
A typical workflow sequence for a typical FFA implementation starts with the first and foremost task: defining and designing an appropriate FFA. This is done by assigning the input parameters and constraints to different element types representing forces, forces' directions, or their geometrical configurations.
Benefits and Challenges of Field Force Automation
Field force automation is the use of software to get work done remotely. It enables businesses to improve productivity, offer greater customer service, and reduce costs.
The benefits of field force automation are seen in increased productivity, greater customer service, and long-term savings for your business. Here are five ways that it can help you save money.
In recent years, many companies have been finding ways to automate tasks their employees do. One such task is data collection.
To manage a field force, companies need to hire many employees and spend a lot of time training them. With the help of automation, this process can be done much more efficiently and without a large number of employees.
Companies have found ways to automate tasks that their employees used to do in the past. One recent example of this is field force automation.
Field force automation uses sensors and signposts placed strategically throughout a warehouse or factory to track where employees are located, what products they're handling, and even how fast they're moving.
This technology can lead to more efficient workflows, less clutter in warehouses, and reduced employee injuries.
Upfront Investments for Ensuring the Security of Mobile Devices
Mobile devices such as smartphones and tablets are responsible for the increase in technology use, but they're also responsible for an increased vulnerability to potential threats.
Little has been done to improve the security of these devices, which leaves them open to cyber-attacks and malicious software. To ensure your mobile device is secure and safe from all threats, invest in protective measures like antivirus and encryption software.
Mobile devices are used for nearly every aspect of our lives - from business transactions to accessing sensitive data. As people have become more reliant on their mobile phones, they have also become more vulnerable to security risks.
With the rise in cyber-attacks, it is now more important than ever to take precautionary measures before opening up personal information or finances. These precautions include securing all apps with a password, downloading only trusted apps, and utilizing encryption software.
Competitive Landscape
The field force automation market landscape appears highly consolidated, with a significant chunk being dominated by US players.
- ServiceMax
- Microsoft
- SAP
- Oracle
- Trimble
- ClickSoftware
- Salesforce
- Astea
- FieldEZ
- Accruent
- AcumaticaFolio3
- LeadSquared
- Kloudq
- Appobile Labs
- Mize
- Nimap Infotech
- Channel play
- Other Players
Key Segments Covered
Field force automation Market, By Component
- Solution
- Services
Field force automation Market, By Organization Size
- SMEs
- Large Enterprises
Field force automation Market, By Deployment Mode
- On-Premise
- Cloud
Field force automation Market, By Industry Vertical
- BFSI
- Government & Defense
- IT & Telecommunication
- Healthcare & Life Sciences
- Retail
- Manufacturing
- Education
- Other Industry Verticals
Attribute Report Details Market Size Ask For Market Size Growth Rate Ask For Growth Rate Key Companies Ask For Companies Report Coverage Revenue analysis, Competitive landscape, Key company analysis, Market Trends, Key segments, Distribution Channel, Market Dynamics, COVID-19 Impact Analysis and more… Historical Data Period 2015-2020 Base Year 2022 Forecast Period 2022-2031 Region Scope North America, Europe, Asia-Pacific, South America, Middle East & Africa Country Scope United States, Canada and Mexico, Germany, France, UK, Russia and Italy, China, Japan, Korea, India and Southeast Asia, Brazil, Argentina, Colombia etc.Saudi Arabia, UAE, Egypt, Nigeria and South Africa Revenue in US$ Mn -
- Chapter 1 Global Field Force Automation Market Outlook
- 1.1 Introduction
- 1.2 Segmentation of Field Force Automation Market Based On Component, Organization Size, Deployment Mode, Industry Vertical, and Region
- 1.3 Drivers
- 1.4 Restraints
- 1.5 Opportunities
- 1.6 Trends
- 1.7 Macro-economic Factors
- 1.8 Regulatory Framework
- 1.9 Global Field Force Automation Market Pricing Analysis by Region, 2021
- 1.10 Opportunity Map Analysis
- 1.10.1 Optimistic Scenario
- 1.10.2 Likely Scenario
- 1.10.3 Conservative Scenario
- 1.11 Opportunity Orbits
- 1.12 Market Investment Feasibility Index
- 1.13 PEST Analysis
- 1.14 PORTER’S Five Force Analysis
- 1.15 Drivers & Restraints Impact Analysis
- 1.16 Marketing Strategy
- 1.17 Product Life Cycle Analysis
- 1.18 Value Chain Analysis
- 1.19 Cost Structure Analysis
- 1.20 Regional Market Share and BPS Analysis in Field Force Automation Market
- 1.21 COVID-19 Impact Analysis
- Chapter 2 Global Field Force Automation Market Overview
- 2.1 Global Market Value Comparison by Component (2015-2031)
- 2.1.1 Global Market Value Market Share by Component in 2021
- 2.1.2 Global Market Attractiveness Analysis by Component , 2015–2022
- 2.2 Global Market Value Comparison by Organization Size (2015-2031)
- 2.2.1 Global Market Value Market Share by Organization Size in 2021
- 2.2.2 Global Market Attractiveness Analysis by Organization Size , 2015–2022
- 2.3 Global Market by Deployment Mode
- 2.3.1 Global Market Value Comparison by Deployment Mode (2015-2031)
- 2.3.2 Global Market Value Market Share by Deployment Mode in 2021
- 2.3.3 Global Market Attractiveness Analysis by Deployment Mode , 2015–2022
- 2.4 Global Market Value Comparison by Industry Vertical (2015-2031)
- 2.4.1 Global Market Value Market Share by Industry Vertical in 2021
- 2.4.2 Global Market Attractiveness Analysis by Industry Vertical , 2015–2022
- 2.5 Global Market Outlook by Region
- 2.5.1 Global Market Value Comparison by Region (2015-2031)
- 2.5.2 Global Market Value Market Share by Region in 2021
- 2.5.3 Global Market Attractiveness Analysis by Region, 2015–2022
- 2.6 Global Market Outlook (2015-2031)
- 2.6.1 Global Market Value (2015–2022)
- 2.6.2 Global Market Value (2023-2031)
- 2.7 Global Market Value by Regions
- 2.7.1 Global Market Value Comparison by Region (2015–2022)
- 2.7.2 Global Market Value Comparison by Region (2023-2031)
- 2.8 Global Market Value by Component
- 2.8.1 Global Market Value Comparison by Component (2015–2022)
- 2.8.2 Global Market Value Comparison by Component (2023-2031)
- 2.9 Global Market Value by Organization Size
- 2.9.1 Global Market Value Comparison by Organization Size (2015–2022)
- 2.9.2 Global Market Value Comparison by Organization Size (2023-2031)
- 2.10 Global Market Value by Deployment Mode
- 2.10.1 Global Market Value Comparison by Deployment Mode (2015–2022)
- 2.10.2 Global Market Value Comparison by Deployment Mode (2023-2031)
- 2.11 Global Market Value by Industry Vertical
- 2.11.1 Global Market Value Comparison by Industry Vertical (2015–2022)
- 2.11.2 Global Market Value Comparison by By Industry Vertical (2023-2031)
- 2.12 Global Market Y-o-Y Growth Rate Comparison 2016–2031
- 2.12.1 Global Market Y-o-Y Growth Rate by Region
- 2.12.2 Global Market Y-o-Y Growth Rate by Component
- 2.12.3 Global Market Y-o-Y Growth Rate by Organization Size
- 2.12.4 Global Market Y-o-Y Growth Rate by Deployment Mode
- 2.12.5 Global Market Y-o-Y Growth Rate by Industry Vertical
- 2.13 Global Market Share Comparison 2015–2030
- 2.13.1 Global Market Share by Region
- 2.13.2 Global Market Share by Component
- 2.13.3 Global Market Share by Organization Size
- 2.13.4 Global Market Share by Deployment Mode
- 2.13.5 Global Market Share by Industry Vertical
- 2.1 Global Market Value Comparison by Component (2015-2031)
- Chapter 3 North America Field Force Automation Market Overview
- 3.1 North America Market by Component
- 3.1.1 North America Market Value Comparison by Component (2015-2031)
- 3.1.2 North America Market Value Market Share by Component in 2021
- 3.2 Global Market Value Comparison by Organization Size (2015-2031)
- 3.2.1 North America Market Value Market Share by Organization Size in 2021
- 3.2.2 North America Market Attractiveness Analysis by Organization Size , 2015–2022
- 3.3 North America Market by Deployment Mode
- 3.3.1 North America Market Value Comparison by Deployment Mode (2015-2031)
- 3.3.2 North America Market Value Market Share by Deployment Mode in 2021
- 3.3.3 North America Market Attractiveness Analysis by Deployment Mode , 2015–2022
- 3.4 North America Market Value Comparison by Industry Vertical (2015-2031)
- 3.4.1 North America Market Value Market Share by Industry Vertical in 2021
- 3.4.2 North America Market Attractiveness Analysis by Industry Vertical , 2015–2022
- 3.5 North America Market Outlook by Region
- 3.5.1 North America Market Value Comparison by Region (2015-2031)
- 3.5.2 North America Market Value Market Share by Region in 2021
- 3.5.3 North America Market Attractiveness Analysis by Region, 2015–2022
- 3.6 North America Market Outlook (2015-2031)
- 3.6.1 North America Market Value (2015–2022)
- 3.6.2 North America Market Value (2023-2031)
- 3.7 North America Market Value by Regions
- 3.7.1 North America Market Value Comparison by Region (2015–2022)
- 3.7.2 North America Market Value Comparison by Region (2023-2031)
- 3.8 North America Market Value by Component
- 3.8.1 North America Market Value Comparison by Component (2015–2022)
- 3.8.2 North America Market Value Comparison by Component (2023-2031)
- 3.9 North America Market Value by Organization Size
- 3.9.1 North America Market Value Comparison by Organization Size (2015–2022)
- 3.9.2 North America Market Value Comparison by Organization Size (2023-2031)
- 3.10 North America Market Value by Deployment Mode
- 3.10.1 North America Market Value Comparison by Deployment Mode (2015–2022)
- 3.10.2 North America Market Value Comparison by Deployment Mode (2023-2031)
- 3.11 North America Market Value by Industry Vertical
- 3.11.1 North America Market Value Comparison by Industry Vertical (2015–2022)
- 3.11.2 North America Market Value Comparison by By Industry Vertical (2023-2031)
- 3.12 North America Market Y-o-Y Growth Rate Comparison 2016–2031
- 3.12.1 North America Market Y-o-Y Growth Rate by Region
- 3.12.2 North America Market Y-o-Y Growth Rate by Component
- 3.12.3 North America Market Y-o-Y Growth Rate by Organization Size
- 3.12.4 North America Market Y-o-Y Growth Rate by Deployment Mode
- 3.12.5 North America Market Y-o-Y Growth Rate by Industry Vertical
- 3.13 North America Market Share Comparison 2015–2030
- 3.13.1 North America Market Share by Region
- 3.13.2 North America Market Share by Component
- 3.13.3 North America Market Share by Organization Size
- 3.13.4 North America Market Share by Deployment Mode
- 3.13.5 North America Market Share by Industry Vertical
- 3.1 North America Market by Component
- Chapter 4 Europe Field Force Automation Market Overview
- 4.1 Europe Market by Component
- 4.1.1 Europe Market Value Comparison by Component (2015-2031)
- 4.1.2 Europe Market Value Market Share by Component in 2021
- 4.2 Europe Market Value Comparison by Organization Size (2015-2031)
- 4.2.1 Europe Market Value Market Share by Organization Size in 2021
- 4.2.2 Europe Market Attractiveness Analysis by Organization Size , 2015–2022
- 4.3 Europe Market by Deployment Mode
- 4.3.1 Europe Market Value Comparison by Deployment Mode (2015-2031)
- 4.3.2 Europe Market Value Market Share by Deployment Mode in 2021
- 4.3.3 Europe Market Attractiveness Analysis by Deployment Mode , 2015–2022
- 4.4 Europe Market Value Comparison by Industry Vertical (2015-2031)
- 4.4.1 Europe Market Value Market Share by Industry Vertical in 2021
- 4.4.2 Europe Market Attractiveness Analysis by Industry Vertical , 2015–2022
- 4.5 Europe Market Outlook by Region
- 4.5.1 Europe Market Value Comparison by Region (2015-2031)
- 4.5.2 Europe Market Value Market Share by Region in 2021
- 4.5.3 Europe Market Attractiveness Analysis by Region, 2015–2022
- 4.6 Europe Market Outlook (2015-2031)
- 4.6.1 Europe Market Value (2015–2022)
- 4.6.2 Europe Market Value (2023-2031)
- 4.7 Europe Market Value by Regions
- 4.7.1 Europe Market Value Comparison by Region (2015–2022)
- 4.7.2 Europe Market Value Comparison by Region (2023-2031)
- 4.8 Europe Market Value by Component
- 4.8.1 Europe Market Value Comparison by Component (2015–2022)
- 4.8.2 Europe Market Value Comparison by Component (2023-2031)
- 4.9 Europe Market Value by Organization Size
- 4.9.1 Europe Market Value Comparison by Organization Size (2015–2022)
- 4.9.2 Europe Market Value Comparison by Organization Size (2023-2031)
- 4.10 Europe Market Value by Deployment Mode
- 4.10.1 Europe Market Value Comparison by Deployment Mode (2015–2022)
- 4.10.2 Europe Market Value Comparison by Deployment Mode (2023-2031)
- 4.11 Europe Market Value by Industry Vertical
- 4.11.1 Europe Market Value Comparison by Industry Vertical (2015–2022)
- 4.11.2 Europe Market Value Comparison by By Industry Vertical (2023-2031)
- 4.12 Europe Market Y-o-Y Growth Rate Comparison 2016–2031
- 4.12.1 Europe Market Y-o-Y Growth Rate by Region
- 4.12.2 Europe Market Y-o-Y Growth Rate by Component
- 4.12.3 Europe Market Y-o-Y Growth Rate by Organization Size
- 4.12.4 Europe Market Y-o-Y Growth Rate by Deployment Mode
- 4.12.5 Europe Market Y-o-Y Growth Rate by Industry Vertical
- 4.13 Europe Market Share Comparison 2015–2030
- 4.13.1 Europe Market Share by Region
- 4.13.2 Europe Market Share by Component
- 4.13.3 Europe Market Share by Organization Size
- 4.13.4 Europe Market Share by Deployment Mode
- 4.13.5 Europe Market Share by Industry Vertical
- 4.1 Europe Market by Component
- Chapter 5 Asia-Pacific Field Force Automation Market Overview
- 5.1 Asia-Pacific Market by Component
- 5.1.1 Asia-Pacific Market Value Comparison by Component (2015-2031)
- 5.1.2 Asia-Pacific Market Value Market Share by Component in 2021
- 5.2 Asia-Pacific Market Value Comparison by Organization Size (2015-2031)
- 5.2.1 Asia-Pacific Market Value Market Share by Organization Size in 2021
- 5.2.2 Asia-Pacific Market Attractiveness Analysis by Organization Size , 2015–2022
- 5.3 Asia-Pacific Market by Deployment Mode
- 5.3.1 Asia-Pacific Market Value Comparison by Deployment Mode (2015-2031)
- 5.3.2 Asia-Pacific Market Value Market Share by Deployment Mode in 2021
- 5.3.3 Asia-Pacific Market Attractiveness Analysis by Deployment Mode , 2015–2022
- 5.4 Asia-Pacific Market Value Comparison by Industry Vertical (2015-2031)
- 5.4.1 Asia-Pacific Market Value Market Share by Industry Vertical in 2021
- 5.4.2 Asia-Pacific Market Attractiveness Analysis by Industry Vertical , 2015–2022
- 5.5 Asia-Pacific Market Outlook by Region
- 5.5.1 Asia-Pacific Market Value Comparison by Region (2015-2031)
- 5.5.2 Asia-Pacific Market Value Market Share by Region in 2021
- 5.5.3 Asia-Pacific Market Attractiveness Analysis by Region, 2015–2022
- 5.6 Asia-Pacific Market Outlook (2015-2031)
- 5.6.1 Asia-Pacific Market Value (2015–2022)
- 5.6.2 Asia-Pacific Market Value (2023-2031)
- 5.7 Asia-Pacific Market Value by Regions
- 5.7.1 Asia-Pacific Market Value Comparison by Region (2015–2022)
- 5.7.2 Asia-Pacific Market Value Comparison by Region (2023-2031)
- 5.8 Asia-Pacific Market Value by Component
- 5.8.1 Asia-Pacific Market Value Comparison by Component (2015–2022)
- 5.8.2 Asia-Pacific Market Value Comparison by Component (2023-2031)
- 5.9 Asia-Pacific Market Value by Organization Size
- 5.9.1 Asia-Pacific Market Value Comparison by Organization Size (2015–2022)
- 5.9.2 Asia-Pacific Market Value Comparison by Organization Size (2023-2031)
- 5.10 Asia-Pacific Market Value by Deployment Mode
- 5.10.1 Asia-Pacific Market Value Comparison by Deployment Mode (2015–2022)
- 5.10.2 Asia-Pacific Market Value Comparison by Deployment Mode (2023-2031)
- 5.11 Asia-Pacific Market Value by Industry Vertical
- 5.11.1 Asia-Pacific Market Value Comparison by Industry Vertical (2015–2022)
- 5.11.2 Asia-Pacific Market Value Comparison by By Industry Vertical (2023-2031)
- 5.12 Asia-Pacific Market Y-o-Y Growth Rate Comparison 2016–2031
- 5.12.1 Asia-Pacific Market Y-o-Y Growth Rate by Region
- 5.12.2 Asia-Pacific Market Y-o-Y Growth Rate by Component
- 5.12.3 Asia-Pacific Market Y-o-Y Growth Rate by Organization Size
- 5.12.4 Asia-Pacific Market Y-o-Y Growth Rate by Deployment Mode
- 5.12.5 Asia-Pacific Market Y-o-Y Growth Rate by Industry Vertical
- 5.13 Asia-Pacific Market Share Comparison 2015–2030
- 5.13.1 Asia-Pacific Market Share by Region
- 5.13.2 Asia-Pacific Market Share by Component
- 5.13.3 Asia-Pacific Market Share by Organization Size
- 5.13.4 Asia-Pacific Market Share by Deployment Mode
- 5.13.5 Asia-Pacific Market Share by Industry Vertical
- 5.1 Asia-Pacific Market by Component
- Chapter 6 South America Field Force Automation Market Overview
- 6.1 South America Market by Component
- 6.1.1 South America Market Value Comparison by Component (2015-2031)
- 6.1.2 South America Market Value Market Share by Component in 2021
- 6.2 South America Market Value Comparison by Organization Size (2015-2031)
- 6.2.1 South America Market Value Market Share by Organization Size in 2021
- 6.2.2 South America Market Attractiveness Analysis by Organization Size , 2015–2022
- 6.3 South America Market by Deployment Mode
- 6.3.1 South America Market Value Comparison by Deployment Mode (2015-2031)
- 6.3.2 South America Market Value Market Share by Deployment Mode in 2021
- 6.3.3 South America Market Attractiveness Analysis by Deployment Mode , 2015–2022
- 6.4 South America Market Value Comparison by Industry Vertical (2015-2031)
- 6.4.1 South America Market Value Market Share by Industry Vertical in 2021
- 6.4.2 South America Market Attractiveness Analysis by Industry Vertical , 2015–2022
- 6.5 South America Market Outlook by Region
- 6.5.1 South America Market Value Comparison by Region (2015-2031)
- 6.5.2 South America Market Value Market Share by Region in 2021
- 6.5.3 South America Market Attractiveness Analysis by Region, 2015–2022
- 6.6 South America Market Outlook (2015-2031)
- 6.6.1 South America Market Value (2015–2022)
- 6.6.2 South America Market Value (2023-2031)
- 6.7 South America Market Value by Regions
- 6.7.1 South America Market Value Comparison by Region (2015–2022)
- 6.7.2 South America Market Value Comparison by Region (2023-2031)
- 6.8 South America Market Value by Component
- 6.8.1 South America Market Value Comparison by Component (2015–2022)
- 6.8.2 South America Market Value Comparison by Component (2023-2031)
- 6.9 South America Market Value by Organization Size
- 6.9.1 South America Market Value Comparison by Organization Size (2015–2022)
- 6.9.2 South America Market Value Comparison by Organization Size (2023-2031)
- 6.10 South America Market Value by Deployment Mode
- 6.10.1 South America Market Value Comparison by Deployment Mode (2015–2022)
- 6.10.2 South America Market Value Comparison by Deployment Mode (2023-2031)
- 6.11 South America Market Value by Industry Vertical
- 6.11.1 South America Market Value Comparison by Industry Vertical (2015–2022)
- 6.11.2 South America Market Value Comparison by By Industry Vertical (2023-2031)
- 6.12 South America Market Y-o-Y Growth Rate Comparison 2016–2031
- 6.12.1 South America Market Y-o-Y Growth Rate by Region
- 6.12.2 South America Market Y-o-Y Growth Rate by Component
- 6.12.3 South America Market Y-o-Y Growth Rate by Organization Size
- 6.12.4 South America Market Y-o-Y Growth Rate by Deployment Mode
- 6.12.5 South America Market Y-o-Y Growth Rate by Industry Vertical
- 6.13 South America Market Share Comparison 2015–2030
- 6.13.1 South America Market Share by Region
- 6.13.2 South America Market Share by Component
- 6.13.3 South America Market Share by Organization Size
- 6.13.4 South America Market Share by Deployment Mode
- 6.13.5 South America Market Share by Industry Vertical
- 6.1 South America Market by Component
- Chapter 7 MEA Field Force Automation Market Overview
- 7.1 MEA Market by Component
- 7.1.1 MEA Market Value Comparison by Component (2015-2031)
- 7.1.2 MEA Market Value Market Share by Component in 2021
- 7.2 MEA Market Value Comparison by Organization Size (2015-2031)
- 7.2.1 MEA Market Value Market Share by Organization Size in 2021
- 7.2.2 MEA Market Attractiveness Analysis by Organization Size , 2015–2022
- 7.3 MEA Market by Deployment Mode
- 7.3.1 MEA Market Value Comparison by Deployment Mode (2015-2031)
- 7.3.2 MEA Market Value Market Share by Deployment Mode in 2021
- 7.3.3 MEA Market Attractiveness Analysis by Deployment Mode , 2015–2022
- 7.4 MEA Market Value Comparison by Industry Vertical (2015-2031)
- 7.4.1 MEA Market Value Market Share by Industry Vertical in 2021
- 7.4.2 MEA Market Attractiveness Analysis by Industry Vertical , 2015–2022
- 7.5 MEA Market Outlook by Region
- 7.5.1 MEA Market Value Comparison by Region (2015-2031)
- 7.5.2 MEA Market Value Market Share by Region in 2021
- 7.5.3 MEA Market Attractiveness Analysis by Region, 2015–2022
- 7.6 MEA Market Outlook (2015-2031)
- 7.6.1 MEA Market Value (2015–2022)
- 7.6.2 MEA Market Value (2023-2031)
- 7.7 MEA Market Value by Regions
- 7.7.1 MEA Market Value Comparison by Region (2015–2022)
- 7.7.2 MEA Market Value Comparison by Region (2023-2031)
- 7.8 MEA Market Value by Component
- 7.8.1 MEA Market Value Comparison by Component (2015–2022)
- 7.8.2 MEA Market Value Comparison by Component (2023-2031)
- 7.9 MEA Market Value by Organization Size
- 7.9.1 MEA Market Value Comparison by Organization Size (2015–2022)
- 7.9.2 MEA Market Value Comparison by Organization Size (2023-2031)
- 7.10 MEA Market Value by Deployment Mode
- 7.10.1 MEA Market Value Comparison by Deployment Mode (2015–2022)
- 7.10.2 MEA Market Value Comparison by Deployment Mode (2023-2031)
- 7.11 MEA Market Value by Industry Vertical
- 7.11.1 MEA Market Value Comparison by Industry Vertical (2015–2022)
- 7.11.2 MEA Market Value Comparison by By Industry Vertical (2023-2031)
- 7.12 MEA Market Y-o-Y Growth Rate Comparison 2016–2031
- 7.12.1 MEA Market Y-o-Y Growth Rate by Region
- 7.12.2 MEA Market Y-o-Y Growth Rate by Component
- 7.12.3 MEA Market Y-o-Y Growth Rate by Organization Size
- 7.12.4 MEA Market Y-o-Y Growth Rate by Deployment Mode
- 7.12.5 MEA Market Y-o-Y Growth Rate by Industry Vertical
- 7.13 MEA Market Share Comparison 2015–2030
- 7.13.1 MEA Market Share by Region
- 7.13.2 MEA Market Share by Component
- 7.13.3 MEA Market Share by Organization Size
- 7.13.4 MEA Market Share by Deployment Mode
- 7.13.5 MEA Market Share by Industry Vertical
- 7.1 MEA Market by Component
- Chapter 8 Global Field Force Automation Market Company Profiles
- 8.1 Market Competition Scenario Analysis, By Company
- 8.2 Competitor Landscape
- 8.3 Company Share Analysis
- 8.4 Company Profiles
- 8.4.1 ServiceMax
- 8.4.1.1 Company Overview
- 8.4.1.2 Business Description
- 8.4.1.3 Product Portfolio
- 8.4.1.4 Key Financials
- 8.4.1.5 Key Developments
- 8.4.1.6 SWOT Analysis
- 8.4.2 Microsoft
- 8.4.2.1 Company Overview
- 8.4.2.2 Business Description
- 8.4.2.3 Product Portfolio
- 8.4.2.4 Key Financials
- 8.4.2.5 Key Developments
- 8.4.2.6 SWOT Analysis
- 8.4.3 SAP
- 8.4.3.1 Company Overview
- 8.4.3.2 Business Description
- 8.4.3.3 Product Portfolio
- 8.4.3.4 Key Financials
- 8.4.3.5 Key Developments
- 8.4.3.6 SWOT Analysis
- 8.4.4 Oracle
- 8.4.4.1 Company Overview
- 8.4.4.2 Business Description
- 8.4.4.3 Product Portfolio
- 8.4.4.4 Key Financials
- 8.4.4.5 Key Developments
- 8.4.4.6 SWOT Analysis
- 8.4.5 Trimble
- 8.4.5.1 Company Overview
- 8.4.5.2 Business Description
- 8.4.5.3 Product Portfolio
- 8.4.5.4 Key Financials
- 8.4.5.5 Key Developments
- 8.4.5.6 SWOT Analysis
- 8.4.6 Salesforce
- 8.4.6.1 Company Overview
- 8.4.6.2 Business Description
- 8.4.6.3 Product Portfolio
- 8.4.6.4 Key Financials
- 8.4.6.5 Key Developments
- 8.4.6.6 SWOT Analysis
- 8.4.7 ClickSoftware
- 8.4.7.1 Company Overview
- 8.4.7.2 Business Description
- 8.4.7.3 Product Portfolio
- 8.4.7.4 Key Financials
- 8.4.7.5 Key Developments
- 8.4.7.6 SWOT Analysis
- 8.4.8 Astea
- 8.4.8.1 Company Overview
- 8.4.8.2 Business Description
- 8.4.8.3 Product Portfolio
- 8.4.8.4 Key Financials
- 8.4.8.5 Key Developments
- 8.4.8.6 SWOT Analysis
- 8.4.9 FieldEZ
- 8.4.9.1 Company Overview
- 8.4.9.2 Business Description
- 8.4.9.3 Product Portfolio
- 8.4.9.4 Key Financials
- 8.4.9.5 Key Developments
- 8.4.9.6 SWOT Analysis
- 8.4.10 Accruent
- 8.4.10.1 Company Overview
- 8.4.10.2 Business Description
- 8.4.10.3 Product Portfolio
- 8.4.10.4 Key Financials
- 8.4.10.5 Key Developments
- 8.4.10.6 SWOT Analysis
- 8.4.11 Other Key Players
- 8.4.1 ServiceMax
- Chapter 9 Research Methodology
- 9.1 Research Methodology
- 9.2 Primary Research
- 9.3 Secondary Research
- 9.4 Report Scope
- Chapter 10 About Us
- 10.1 Who we are:
- Chapter 11 Disclaimer
- Chapter 1 Global Field Force Automation Market Outlook
-
- ServiceMax
- Microsoft
- SAP
- Oracle
- Trimble
- ClickSoftware
- Salesforce
- Astea
- FieldEZ
- Accruent
- AcumaticaFolio3
- LeadSquared
- Kloudq
- Appobile Labs
- Mize
- Nimap Infotech
- Channelplay
- Other Players
Our Clients


View Our Licence Options
