
Global Engineering Design and Development Outsourcing Market By Service (Designing, Prototyping and Others), By Application (Hi-Tech/Telecom, Aerospace, Automotive and Others), and By Region - Global Forecast to 2030
-
17572
-
April 2023
-
332
-


-
This report was compiled by Vishwa Gaul Vishwa is an experienced market research and consulting professional with over 8 years of expertise in the ICT industry, contributing to over 700 reports across telecommunications, software, hardware, and digital solutions. Correspondence Team Lead- ICT Linkedin | Detailed Market research Methodology Our methodology involves a mix of primary research, including interviews with leading mental health experts, and secondary research from reputable medical journals and databases. View Detailed Methodology Page
-
Market.Biz announces publication of its most recently generated research report titled, “Global Engineering Design and Development Outsourcing Market by Service (Designing, Prototyping, System Integration, Testing and Other Services), By Application (Hi-Tech/Telecom, Aerospace, Automotive, Pharmaceuticals, Construction & Industrial Products, Consumer Electronics and Other Applications), and by Region – Global Forecast to 2030”, which offers a holistic view of the global Engineering Design and Development Outsourcing Market through systematic segmentation that covers every aspect of the target market.
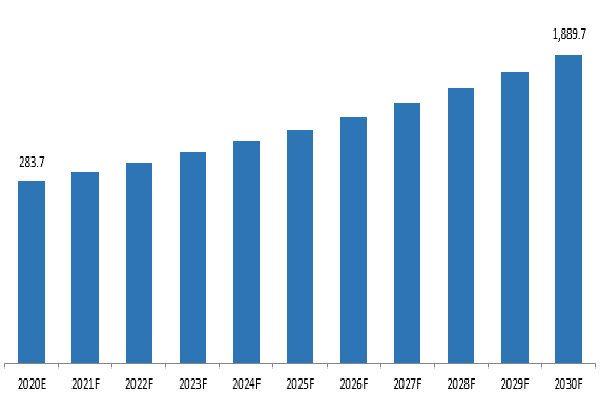
The Global Engineering Design and Development Outsourcing Market is projected to be US$ 283.7 Mn in 2020 to reach US$ 1,889.7 Mn by 2030 at a CAGR of 21.4%.
Outsourcing is a contract or agreement between two or more companies in which one company hires another company to perform a set of planned or existing activities. The outsourcing industry has various streams such as Information Technology Outsourcing (ITO), Business Process Outsourcing (BPO), Engineering Services Outsourcing (ESO), etc. Engineering Services Outsourcing (ESO) is developing as a large business platform after the rapid growth of ITO and BPO. In the early days, engineering design and development outsourcing used for non-complex services like architectural drawing two dimensional and three-dimensional drafting, but now engineering design and development outsourcing offers various complex services like high-value analysis & design services, computer-aided designing & engineering, finite element analysis, computational fluid dynamics, noise, vibration and harshness analysis (NVH) & other services.
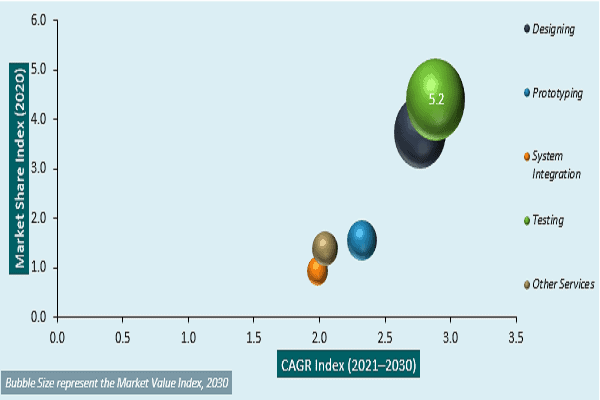
Among the service segment, the testing segment is estimated to register higher revenue growth during the forecast period due to the growing demand for software testing solutions to reduce manual intervention and overall project turnaround time. Among the application segment, the hi-tech/telecom segment is anticipated to capture a higher market share owing to the increasing use of smart and AI-based technologies during project development. Among all the regions, Asia Pacific is anticipated to grow at a high CAGR as countries such as India, China, etc. have a large number of engineering services providers that provide quality services at low cost.
The use of computer-aided designing (CAD) software, computer-aided manufacturing (CAM) software, computer-aided engineering (CAE) software & other Internet of things (IoT) during product development has increased. Engineering service provides software and other solutions according to the requirement. This factor is anticipated to bolster the growth of the target market. Moreover, companies are trying to reduce revenue expenses during the product design & development stages. Engineering design and development service provider delivers services from highly skilled professionals at a relatively low cost. This factor is estimated to drive the growth of the engineering design and development outsourcing market. Energy Engineering Services Outsourcing propels innovation in Automotive Transmission Engineering, optimizing efficiency and sustainability.
Global Engineering Design and Development Outsourcing Market Revenue (US$ Mn), 2020–2030
The outsourcing of engineering design and development services started in Western Europe & North America. Initially, companies used to focus on on-shore outsourcing as it was a safe option. After some time, major engineering services providers started setting up their divisions in different countries. Initially, companies used to outsource non-complex services like 2D drawing and drafting from the off-shore engineering service provider. But now companies are outsourcing complex engineering design and development services from off-shore service providers due to the available skilled workforce and lower cost of service. Earlier, only automotive firms used to hire engineering service providers; however, in recent years, it is seen that various industries like Aerospace, Telecom, Energy & Utility, Construction, etc. are hiring an engineering service provider during various stages of product development.
Global Engineering Design and Development Outsourcing Market is segmented based on service, application, and region. Based on Service, the market is segmented into Designing, Prototyping, System Integration, Testing and Other Services. The testing segment accounts for the majority share and is expected to witness significant share in terms of revenue over the forecast period. Based on Application, the market is segmented into Hi-Tech/Telecom, Aerospace, Automotive, Pharmaceuticals, Construction & Industrial Products, Consumer Electronics, and Other Applications. The Automotive segment accounts for significant revenue share in the next coming years.
Global Engineering Design and Development Outsourcing Market Attractiveness Analysis by Service, 2014–2030.
By region, the market is segmented into North America, Europe, APAC, South America, and Middle East Africa. Based on the region, Asia Pacific market is estimated to account for major revenue share and is projected to dominate the global Engineering Design and Development Outsourcing Market in the next coming years.
The research report on the global Engineering Design and Development Outsourcing Market includes profiles of some of the major companies such as Accenture plc, Tata Consultancy Services Ltd., Capgemini SE, Infosys Ltd., HCL Technologies Ltd., Wipro Ltd., Tech Mahindra Ltd., Alten SA, EPAM Systems, Inc., AKKA Technologies SE, Bertrandt AG, and KPIT Technologies Ltd.
Global Engineering Design and Development Outsourcing Market Segmentation:
By Service:
- Designing
- Prototyping
- System Integration
- Testing
- Other Services
By Application:
- Hi-Tech/Telecom
- Aerospace
- Automotive
- Pharmaceuticals
- Construction & Industrial Products
- Consumer Electronics
- Other Applications
By Region:
- North America
- Europe
- Asia-Pacific
- South America
- Middle East and Africa
Attribute Report Details Market Size Ask For Market Size Growth Rate Ask For Growth Rate Key Companies Ask For Companies Report Coverage Revenue analysis, Competitive landscape, Key company analysis, Market Trends, Key segments, Distribution Channel, Market Dynamics, COVID-19 Impact Analysis and more… Historical Data Period 2015-2020 Base Year 2022 Forecast Period 2022-2031 Region Scope North America, Europe, Asia-Pacific, South America, Middle East & Africa Country Scope United States, Canada and Mexico, Germany, France, UK, Russia and Italy, China, Japan, Korea, India and Southeast Asia, Brazil, Argentina, Colombia etc.Saudi Arabia, UAE, Egypt, Nigeria and South Africa Revenue in US$ Mn -
- Chapter 1 Global Engineering Design and Development Outsourcing Market Overview
- 1.1 Introduction
- 1.2 Global Engineering Design and Development Outsourcing Market Segmentation based on Service, Application and Region
- 1.3 Drivers for Global Engineering Design and Development Outsourcing Market
- 1.4 Restraints for Global Engineering Design and Development Outsourcing Market Growth
- 1.5 Opportunities in Global Engineering Design and Development Outsourcing Market
- 1.6 Trends in Global Engineering Design and Development Outsourcing Market
- 1.7 Drivers & Restraints Impact Analysis
- 1.8 PEST Analysis
- 1.9 PORTER'S Five Forces Analysis
- 1.10 Macroeconomic Factor
- 1.11 Opportunity Orbits
- 1.12 Opportunity Map Analysis
- 1.12.1 Optimistic Scenario
- 1.12.2 Likely Scenario
- 1.12.3 Conservative Scenario
- 1.13 Market Investment Feasibility Analysis
- 1.14 Go to Market Strategy – Market Maturity
- 1.15 Regional Market Share and BPS Analysis of Engineering Design and Development Outsourcing Market
- 1.16 COVID-19 Impact on Engineering D&D Outsourcing Market
- 1.16.1 Automotive Industry
- 1.16.2 Impact on Other Industries
- Chapter 2 Global Engineering Design and Development Outsourcing Market Overview
- 2.1 Global Engineering Design and Development Outsourcing Market by Service
- 2.1.1 Global Engineering Design and Development Outsourcing Revenue (US$ Bn) Comparison by Service (2014-2030)
- 2.1.2 Global Engineering Design and Development Outsourcing Revenue (US$ Bn) Market Share by Service in 2020
- 2.1.3 Global Engineering Design and Development Outsourcing Market Attractiveness Analysis by Service, 2014–2030
- 2.2 Global Engineering Design and Development Outsourcing Market by Application
- 2.2.1 Global Engineering Design and Development Outsourcing Revenue (US$ Bn) Comparison by Application (2014-2030)
- 2.2.2 Global Engineering Design and Development Outsourcing Revenue (US$ Bn) Market Share by Application in 2020
- 2.2.3 Global Engineering Design and Development Outsourcing Market Attractiveness Analysis by Application, 2014–2030
- 2.3 Global Engineering Design and Development Outsourcing Market Outlook by Region
- 2.3.1 Global Engineering Design and Development Outsourcing Revenue (US$ Bn) Comparison by Region (2014-2030)
- 2.3.2 Global Engineering Design and Development Outsourcing Revenue (US$ Bn) Market Share by Region in 2020
- 2.3.3 Global Engineering Design and Development Outsourcing Market Attractiveness Analysis by Region, 2014–2030
- 2.4 Global Engineering Design and Development Outsourcing Market Outlook (2014–2030)
- 2.4.1 Global Engineering Design and Development Outsourcing Revenue (US$ Bn) (2014–2021)
- 2.4.2 Global Engineering Design and Development Outsourcing Revenue (US$ Bn) (2022–2030)
- 2.5 Global Engineering Design and Development Outsourcing Revenue (US$ Bn) by Regions
- 2.5.1 Global Engineering Design and Development Outsourcing Revenue (US$ Bn) Comparison by Region (2014–2021)
- 2.5.2 Global Engineering Design and Development Outsourcing Revenue (US$ Bn) Comparison by Region (2022–2030)
- 2.6 Global Engineering Design and Development Outsourcing Revenue (US$ Bn) by Service
- 2.6.1 Global Engineering Design and Development Outsourcing Revenue (US$ Bn) Comparison by Service (2014–2021)
- 2.6.2 Global Engineering Design and Development Outsourcing Revenue (US$ Bn) Comparison by Service (2022–2030)
- 2.7 Global Engineering Design and Development Outsourcing Revenue (US$ Bn) by Application
- 2.7.1 Global Engineering Design and Development Outsourcing Revenue (US$ Bn) Comparison by Application (2014–2021)
- 2.7.2 Global Engineering Design and Development Outsourcing Revenue (US$ Bn) Comparison by Application (2022–2030)
- 2.8 Global Engineering Design and Development Outsourcing Y-o-Y Growth Rate Comparison 2015–2030
- 2.8.1 Global Engineering Design and Development Outsourcing Y-o-Y Growth Rate by Region
- 2.8.2 Global Engineering Design and Development Outsourcing Market Y-o-Y Growth Rate by Service
- 2.8.3 Global Engineering Design and Development Outsourcing Y-o-Y Growth Rate by Application
- 2.9 Global Engineering Design and Development Outsourcing Share Comparison 2014–2030
- 2.9.1 Global Engineering Design and Development Outsourcing Share by Region
- 2.9.2 Global Engineering Design and Development Outsourcing Market Share by Service
- 2.9.3 Global Engineering Design and Development Outsourcing Share by Application
- 2.1 Global Engineering Design and Development Outsourcing Market by Service
- Chapter 3 Europe Engineering Design and Development Outsourcing Market Overview
- 3.1 Europe Engineering Design and Development Outsourcing Market by Service
- 3.1.1 Europe Engineering Design and Development Outsourcing Revenue (US$ Bn) Comparison by Service (2014-2030)
- 3.1.2 Europe Engineering Design and Development Outsourcing Revenue (US$ Bn) Market Share by Service in 2020
- 3.1.3 Europe Engineering Design and Development Outsourcing Market Attractiveness Analysis by Service, 2014–2030
- 3.2 Europe Engineering Design and Development Outsourcing Market by Application
- 3.2.1 Europe Engineering Design and Development Outsourcing Revenue (US$ Bn) Comparison by Application (2014-2030)
- 3.2.2 Europe Engineering Design and Development Outsourcing Revenue (US$ Bn) Market Share by Application in 2020
- 3.2.3 Europe Engineering Design and Development Outsourcing Market Attractiveness Analysis by Application, 2014–2030
- 3.3 Europe Engineering Design and Development Outsourcing Market Outlook by Region
- 3.3.1 Europe Engineering Design and Development Outsourcing Revenue (US$ Bn) Comparison by Region (2014-2030)
- 3.3.2 Europe Engineering Design and Development Outsourcing Revenue (US$ Bn) Market Share by Region in 2020
- 3.3.3 Europe Engineering Design and Development Outsourcing Market Attractiveness Analysis by Region, 2014–2030
- 3.4 Europe Engineering Design and Development Outsourcing Market Outlook (2014–2030)
- 3.4.1 Europe Engineering Design and Development Outsourcing Revenue (US$ Bn) (2014–2021)
- 3.4.2 Europe Engineering Design and Development Outsourcing Revenue (US$ Bn) (2022–2030)
- 3.5 Europe Engineering Design and Development Outsourcing Revenue (US$ Bn) by Regions
- 3.5.1 Europe Engineering Design and Development Outsourcing Revenue (US$ Bn) Comparison by Region (2014–2021)
- 3.5.2 Europe Engineering Design and Development Outsourcing Revenue (US$ Bn) Comparison by Region (2022–2030)
- 3.6 Europe Engineering Design and Development Outsourcing Revenue (US$ Bn) by Service
- 3.6.1 Europe Engineering Design and Development Outsourcing Revenue (US$ Bn) Comparison by Service (2014–2021)
- 3.6.2 Europe Engineering Design and Development Outsourcing Revenue (US$ Bn) Comparison by Service (2022–2030)
- 3.7 Europe Engineering Design and Development Outsourcing Revenue (US$ Bn) by Application
- 3.7.1 Europe Engineering Design and Development Outsourcing Revenue (US$ Bn) Comparison by Application (2014–2021)
- 3.7.2 Europe Engineering Design and Development Outsourcing Revenue (US$ Bn) Comparison by Application (2022–2030)
- 3.8 Europe Engineering Design and Development Outsourcing Y-o-Y Growth Rate Comparison 2015–2030
- 3.8.1 Europe Engineering Design and Development Outsourcing Y-o-Y Growth Rate by Region
- 3.8.2 Europe Engineering Design and Development Outsourcing Market Y-o-Y Growth Rate by Service
- 3.8.3 Europe Engineering Design and Development Outsourcing Y-o-Y Growth Rate by Application
- 3.9 Europe Engineering Design and Development Outsourcing Share Comparison 2014–2030
- 3.9.1 Europe Engineering Design and Development Outsourcing Share by Region
- 3.9.2 Europe Engineering Design and Development Outsourcing Market Share by Service
- 3.9.3 Europe Engineering Design and Development Outsourcing Share by Application
- 3.1 Europe Engineering Design and Development Outsourcing Market by Service
- Chapter 4 North America Engineering Design and Development Outsourcing Market Overview
- 4.1 North America Engineering Design and Development Outsourcing Market by Service
- 4.1.1 North America Engineering Design and Development Outsourcing Revenue (US$ Bn) Comparison by Service (2014-2030)
- 4.1.2 North America Engineering Design and Development Outsourcing Revenue (US$ Bn) Market Share by Service in 2020
- 4.1.3 North America Engineering Design and Development Outsourcing Market Attractiveness Analysis by Service, 2014–2030
- 4.2 North America Engineering Design and Development Outsourcing Market by Application
- 4.2.1 North America Engineering Design and Development Outsourcing Revenue (US$ Bn) Comparison by Application (2014-2030)
- 4.2.2 North America Engineering Design and Development Outsourcing Revenue (US$ Bn) Market Share by Application in 2020
- 4.2.3 North America Engineering Design and Development Outsourcing Market Attractiveness Analysis by Application, 2014–2030
- 4.3 North America Engineering Design and Development Outsourcing Market Outlook by Region
- 4.3.1 North America Engineering Design and Development Outsourcing Revenue (US$ Bn) Comparison by Region (2014-2030)
- 4.3.2 North America Engineering Design and Development Outsourcing Revenue (US$ Bn) Market Share by Region in 2020
- 4.3.3 North America Engineering Design and Development Outsourcing Market Attractiveness Analysis by Region, 2014–2030
- 4.4 North America Engineering Design and Development Outsourcing Market Outlook (2014–2030)
- 4.4.1 North America Engineering Design and Development Outsourcing Revenue (US$ Bn) (2014–2021)
- 4.4.2 North America Engineering Design and Development Outsourcing Revenue (US$ Bn) (2022–2030)
- 4.5 North America Engineering Design and Development Outsourcing Revenue (US$ Bn) by Regions
- 4.5.1 North America Engineering Design and Development Outsourcing Revenue (US$ Bn) Comparison by Region (2014–2021)
- 4.5.2 North America Engineering Design and Development Outsourcing Revenue (US$ Bn) Comparison by Region (2022–2030)
- 4.6 North America Engineering Design and Development Outsourcing Revenue (US$ Bn) by Service
- 4.6.1 North America Engineering Design and Development Outsourcing Revenue (US$ Bn) Comparison by Service (2014–2021)
- 4.6.2 North America Engineering Design and Development Outsourcing Revenue (US$ Bn) Comparison by Service (2022–2030)
- 4.7 North America Engineering Design and Development Outsourcing Revenue (US$ Bn) by Application
- 4.7.1 North America Engineering Design and Development Outsourcing Revenue (US$ Bn) Comparison by Application (2014–2021)
- 4.7.2 North America Engineering Design and Development Outsourcing Revenue (US$ Bn) Comparison by Application (2022–2030)
- 4.8 North America Engineering Design and Development Outsourcing Y-o-Y Growth Rate Comparison 2015–2030
- 4.8.1 North America Engineering Design and Development Outsourcing Y-o-Y Growth Rate by Region
- 4.8.2 North America Engineering Design and Development Outsourcing Market Y-o-Y Growth Rate by Service
- 4.8.3 North America Engineering Design and Development Outsourcing Y-o-Y Growth Rate by Application
- 4.9 North America Engineering Design and Development Outsourcing Share Comparison 2014–2030
- 4.9.1 North America Engineering Design and Development Outsourcing Share by Region
- 4.9.2 North America Engineering Design and Development Outsourcing Market Share by Service
- 4.9.3 North America Engineering Design and Development Outsourcing Share by Application
- 4.1 North America Engineering Design and Development Outsourcing Market by Service
- Chapter 5 APAC Engineering Design and Development Outsourcing Market Overview
- 5.1 APAC Engineering Design and Development Outsourcing Market by Service
- 5.1.1 APAC Engineering Design and Development Outsourcing Revenue (US$ Bn) Comparison by Service (2014-2030)
- 5.1.2 APAC Engineering Design and Development Outsourcing Revenue (US$ Bn) Market Share by Service in 2020
- 5.1.3 APAC Engineering Design and Development Outsourcing Market Attractiveness Analysis by Service, 2014–2030
- 5.2 APAC Engineering Design and Development Outsourcing Market by Application
- 5.2.1 APAC Engineering Design and Development Outsourcing Revenue (US$ Bn) Comparison by Application (2014-2030)
- 5.2.2 APAC Engineering Design and Development Outsourcing Revenue (US$ Bn) Market Share by Application in 2020
- 5.2.3 APAC Engineering Design and Development Outsourcing Market Attractiveness Analysis by Application, 2014–2030
- 5.3 APAC Engineering Design and Development Outsourcing Market Outlook by Region
- 5.3.1 APAC Engineering Design and Development Outsourcing Revenue (US$ Bn) Comparison by Region (2014-2030)
- 5.3.2 APAC Engineering Design and Development Outsourcing Revenue (US$ Bn) Market Share by Region in 2020
- 5.3.3 APAC Engineering Design and Development Outsourcing Market Attractiveness Analysis by Region, 2014–2030
- 5.4 APAC Engineering Design and Development Outsourcing Market Outlook (2014–2030)
- 5.4.1 APAC Engineering Design and Development Outsourcing Revenue (US$ Bn) (2014–2021)
- 5.4.2 APAC Engineering Design and Development Outsourcing Revenue (US$ Bn) (2022–2030)
- 5.5 APAC Engineering Design and Development Outsourcing Revenue (US$ Bn) by Regions
- 5.5.1 APAC Engineering Design and Development Outsourcing Revenue (US$ Bn) Comparison by Region (2014–2021)
- 5.5.2 APAC Engineering Design and Development Outsourcing Revenue (US$ Bn) Comparison by Region (2022–2030)
- 5.6 APAC Engineering Design and Development Outsourcing Revenue (US$ Bn) by Service
- 5.6.1 APAC Engineering Design and Development Outsourcing Revenue (US$ Bn) Comparison by Service (2014–2021)
- 5.6.2 APAC Engineering Design and Development Outsourcing Revenue (US$ Bn) Comparison by Service (2022–2030)
- 5.7 APAC Engineering Design and Development Outsourcing Revenue (US$ Bn) by Application
- 5.7.1 APAC Engineering Design and Development Outsourcing Revenue (US$ Bn) Comparison by Application (2014–2021)
- 5.7.2 APAC Engineering Design and Development Outsourcing Revenue (US$ Bn) Comparison by Application (2022–2030)
- 5.8 APAC Engineering Design and Development Outsourcing Y-o-Y Growth Rate Comparison 2015–2030
- 5.8.1 APAC Engineering Design and Development Outsourcing Y-o-Y Growth Rate by Region
- 5.8.2 APAC Engineering Design and Development Outsourcing Market Y-o-Y Growth Rate by Service
- 5.8.3 APAC Engineering Design and Development Outsourcing Y-o-Y Growth Rate by Application
- 5.9 APAC Engineering Design and Development Outsourcing Share Comparison 2014–2030
- 5.9.1 APAC Engineering Design and Development Outsourcing Share by Region
- 5.9.2 APAC Engineering Design and Development Outsourcing Market Share by Service
- 5.9.3 APAC Engineering Design and Development Outsourcing Share by Application
- 5.1 APAC Engineering Design and Development Outsourcing Market by Service
- Chapter 6 South America Engineering Design and Development Outsourcing Market Overview
- 6.1 South America Engineering Design and Development Outsourcing Market by Service
- 6.1.1 South America Engineering Design and Development Outsourcing Revenue (US$ Bn) Comparison by Service (2014-2030)
- 6.1.2 South America Engineering Design and Development Outsourcing Revenue (US$ Bn) Market Share by Service in 2020
- 6.1.3 South America Engineering Design and Development Outsourcing Market Attractiveness Analysis by Service, 2014–2030
- 6.2 South America Engineering Design and Development Outsourcing Market by Application
- 6.2.1 South America Engineering Design and Development Outsourcing Revenue (US$ Bn) Comparison by Application (2014-2030)
- 6.2.2 South America Engineering Design and Development Outsourcing Revenue (US$ Bn) Market Share by Application in 2020
- 6.2.3 South America Engineering Design and Development Outsourcing Market Attractiveness Analysis by Application, 2014–2030
- 6.3 South America Engineering Design and Development Outsourcing Market Outlook by Region
- 6.3.1 South America Engineering Design and Development Outsourcing Revenue (US$ Bn) Comparison by Region (2014-2030)
- 6.3.2 South America Engineering Design and Development Outsourcing Revenue (US$ Bn) Market Share by Region in 2020
- 6.3.3 South America Engineering Design and Development Outsourcing Market Attractiveness Analysis by Region, 2014–2030
- 6.4 South America Engineering Design and Development Outsourcing Market Outlook (2014–2030)
- 6.4.1 South America Engineering Design and Development Outsourcing Revenue (US$ Bn) (2014–2021)
- 6.4.2 South America Engineering Design and Development Outsourcing Revenue (US$ Bn) (2022–2030)
- 6.5 South America Engineering Design and Development Outsourcing Revenue (US$ Bn) by Regions
- 6.5.1 South America Engineering Design and Development Outsourcing Revenue (US$ Bn) Comparison by Region (2014–2021)
- 6.5.2 South America Engineering Design and Development Outsourcing Revenue (US$ Bn) Comparison by Region (2022–2030)
- 6.6 South America Engineering Design and Development Outsourcing Revenue (US$ Bn) by Service
- 6.6.1 South America Engineering Design and Development Outsourcing Revenue (US$ Bn) Comparison by Service (2014–2021)
- 6.6.2 South America Engineering Design and Development Outsourcing Revenue (US$ Bn) Comparison by Service (2022–2030)
- 6.7 South America Engineering Design and Development Outsourcing Revenue (US$ Bn) by Application
- 6.7.1 South America Engineering Design and Development Outsourcing Revenue (US$ Bn) Comparison by Application (2014–2021)
- 6.7.2 South America Engineering Design and Development Outsourcing Revenue (US$ Bn) Comparison by Application (2022–2030)
- 6.8 South America Engineering Design and Development Outsourcing Y-o-Y Growth Rate Comparison 2015–2030
- 6.8.1 South America Engineering Design and Development Outsourcing Y-o-Y Growth Rate by Region
- 6.8.2 South America Engineering Design and Development Outsourcing Market Y-o-Y Growth Rate by Service
- 6.8.3 South America Engineering Design and Development Outsourcing Y-o-Y Growth Rate by Application
- 6.9 South America Engineering Design and Development Outsourcing Share Comparison 2014–2030
- 6.9.1 South America Engineering Design and Development Outsourcing Share by Region
- 6.9.2 South America Engineering Design and Development Outsourcing Market Share by Service
- 6.9.3 South America Engineering Design and Development Outsourcing Share by Application
- 6.1 South America Engineering Design and Development Outsourcing Market by Service
- Chapter 7 MEA Engineering Design and Development Outsourcing Market Overview
- 7.1 MEA Engineering Design and Development Outsourcing Market by Service
- 7.1.1 MEA Engineering Design and Development Outsourcing Revenue (US$ Bn) Comparison by Service (2014-2030)
- 7.1.2 MEA Engineering Design and Development Outsourcing Revenue (US$ Bn) Market Share by Service in 2020
- 7.1.3 MEA Engineering Design and Development Outsourcing Market Attractiveness Analysis by Service, 2014–2030
- 7.2 MEA Engineering Design and Development Outsourcing Market by Application
- 7.2.1 MEA Engineering Design and Development Outsourcing Revenue (US$ Bn) Comparison by Application (2014-2030)
- 7.2.2 MEA Engineering Design and Development Outsourcing Revenue (US$ Bn) Market Share by Application in 2020
- 7.2.3 MEA Engineering Design and Development Outsourcing Market Attractiveness Analysis by Application, 2014–2030
- 7.3 MEA Engineering Design and Development Outsourcing Market Outlook by Region
- 7.3.1 MEA Engineering Design and Development Outsourcing Revenue (US$ Bn) Comparison by Region (2014-2030)
- 7.3.2 MEA Engineering Design and Development Outsourcing Revenue (US$ Bn) Market Share by Region in 2020
- 7.3.3 MEA Engineering Design and Development Outsourcing Market Attractiveness Analysis by Region, 2014–2030
- 7.4 MEA Engineering Design and Development Outsourcing Market Outlook (2014–2030)
- 7.4.1 MEA Engineering Design and Development Outsourcing Revenue (US$ Bn) (2014–2021)
- 7.4.2 MEA Engineering Design and Development Outsourcing Revenue (US$ Bn) (2022–2030)
- 7.5 MEA Engineering Design and Development Outsourcing Revenue (US$ Bn) by Regions
- 7.5.1 MEA Engineering Design and Development Outsourcing Revenue (US$ Bn) Comparison by Region (2014–2021)
- 7.5.2 MEA Engineering Design and Development Outsourcing Revenue (US$ Bn) Comparison by Region (2022–2030)
- 7.6 MEA Engineering Design and Development Outsourcing Revenue (US$ Bn) by Service
- 7.6.1 MEA Engineering Design and Development Outsourcing Revenue (US$ Bn) Comparison by Service (2014–2021)
- 7.6.2 MEA Engineering Design and Development Outsourcing Revenue (US$ Bn) Comparison by Service (2022–2030)
- 7.7 MEA Engineering Design and Development Outsourcing Revenue (US$ Bn) by Application
- 7.7.1 MEA Engineering Design and Development Outsourcing Revenue (US$ Bn) Comparison by Application (2014–2021)
- 7.7.2 MEA Engineering Design and Development Outsourcing Revenue (US$ Bn) Comparison by Application (2022–2030)
- 7.8 MEA Engineering Design and Development Outsourcing Y-o-Y Growth Rate Comparison 2015–2030
- 7.8.1 MEA Engineering Design and Development Outsourcing Y-o-Y Growth Rate by Region
- 7.8.2 MEA Engineering Design and Development Outsourcing Market Y-o-Y Growth Rate by Service
- 7.8.3 MEA Engineering Design and Development Outsourcing Y-o-Y Growth Rate by Application
- 7.9 MEA Engineering Design and Development Outsourcing Share Comparison 2014–2030
- 7.9.1 MEA Engineering Design and Development Outsourcing Share by Region
- 7.9.2 MEA Engineering Design and Development Outsourcing Market Share by Service
- 7.9.3 MEA Engineering Design and Development Outsourcing Share by Application
- 7.1 MEA Engineering Design and Development Outsourcing Market by Service
- Chapter 8 Global Engineering Design and Development Outsourcing Market Competitive Landscape
- 8.1 Market Competition Scenario Analysis
- 8.2 Overview of Major Market Players
- 8.3 Company Profiles
- 8.3.1 Accenture plc
- 8.3.1.1 Company Overview
- 8.3.1.2 Business Description
- 8.3.1.3 Product/Service Portfolio
- 8.3.1.4 Key Financials
- 8.3.1.5 Key Developments
- 8.3.1.6 SWOT Analysis
- 8.3.2 Tata Consultancy Services Ltd.
- 8.3.2.1 Company Overview
- 8.3.2.2 Business Description
- 8.3.2.3 Product/Service Portfolio
- 8.3.2.4 Key Financials
- 8.3.2.5 Key Developments
- 8.3.2.6 SWOT Analysis
- 8.3.3 Capgemini SE
- 8.3.3.1 Company Overview
- 8.3.3.2 Business Description
- 8.3.3.3 Product/Service Portfolio (Altran Technologies S.A.)
- 8.3.3.4 Key Financials
- 8.3.3.5 Key Developments
- 8.3.3.6 SWOT Analysis
- 8.3.4 Infosys Ltd.
- 8.3.4.1 Company Overview
- 8.3.4.2 Business Description
- 8.3.4.3 Product/Service Portfolio
- 8.3.4.4 Key Financials
- 8.3.4.5 Key Developments
- 8.3.4.6 SWOT Analysis
- 8.3.5 HCL Technologies Ltd.
- 8.3.5.1 Company Overview
- 8.3.5.2 Business Description
- 8.3.5.3 Product/Service Portfolio
- 8.3.5.4 Key Financials
- 8.3.5.5 Key Developments
- 8.3.5.6 SWOT Analysis
- 8.3.6 Wipro Ltd.
- 8.3.6.1 Company Overview
- 8.3.6.2 Business Description
- 8.3.6.3 Product/Service Portfolio
- 8.3.6.4 Key Financials
- 8.3.6.5 Key Developments
- 8.3.6.6 SWOT Analysis
- 8.3.7 Tech Mahindra Ltd.
- 8.3.7.1 Company Overview
- 8.3.7.2 Business Description
- 8.3.7.3 Product/Service Portfolio
- 8.3.7.4 Key Financials
- 8.3.7.5 Key Developments
- 8.3.7.6 SWOT Analysis
- 8.3.8 Alten SA
- 8.3.8.1 Company Overview
- 8.3.8.2 Business Description
- 8.3.8.3 Product/Service Portfolio
- 8.3.8.4 Key Financials
- 8.3.8.5 Key Developments
- 8.3.8.6 SWOT Analysis
- 8.3.9 EPAM Systems, Inc.
- 8.3.9.1 Company Overview
- 8.3.9.2 Business Description
- 8.3.9.3 Product/Service Portfolio
- 8.3.9.4 Key Financials
- 8.3.9.5 Key Developments
- 8.3.10 AKKA Technologies SE
- 8.3.10.1 Company Overview
- 8.3.10.2 Business Description
- 8.3.10.3 Product/Service Portfolio
- 8.3.10.4 Key Financials
- 8.3.10.5 Key Developments
- 8.3.11 Bertrandt AG
- 8.3.11.1 Company Overview
- 8.3.11.2 Business Description
- 8.3.11.3 Product/Service Portfolio
- 8.3.11.4 Key Financials
- 8.3.12 KPIT Technologies Ltd.
- 8.3.12.1 Company Overview
- 8.3.12.2 Business Description
- 8.3.12.3 Product/Service Portfolio
- 8.3.12.4 Key Financials
- 8.3.12.5 Key Developments
- 8.3.1 Accenture plc
- Chapter 9 Methodology and Data Source
- 9.1 Methodology/Research Approach
- 9.1.1 Market Size Estimation
- 9.2 Market Breakdown and Data Triangulation
- 9.3 Data Source
- 9.3.1 Secondary Sources
- 9.3.2 Primary Sources
- 9.1 Methodology/Research Approach
- Chapter 10 About Us
- 10.1 Who we are:
- Chapter 11 Disclaimer
- List of Figure
- FIG. 1 Global Engineering Design and Development Outsourcing Revenue (US$ Bn) Market Share by Service in 2020
- FIG. 2 Global Engineering Design and Development Outsourcing Market Attractiveness Analysis by Service, 2014–2030
- FIG. 3 Global Engineering Design and Development Outsourcing Revenue (US$ Bn) Market Share by Application in 2020
- FIG. 4 Global Engineering Design and Development Outsourcing Market Attractiveness Analysis by Application, 2014–2030
- FIG. 5 Global Engineering Design and Development Outsourcing Revenue (US$ Bn) Market Share by Region in 2020
- FIG. 6 Global Engineering Design and Development Outsourcing Market Attractiveness Analysis by Region, 2014–2030
- FIG. 7 Global Engineering Design and Development Outsourcing Market Revenue (US$ Bn) (2014–2021)
- FIG. 8 Global Engineering Design and Development Outsourcing Market Revenue (US$ Bn) (2022–2030)
- FIG. 9 Global Engineering Design and Development Outsourcing Market Revenue (US$ Bn) Comparison by Region (2014–2021)
- FIG. 10 Global Engineering Design and Development Outsourcing Market Revenue (US$ Bn) Comparison by Region (2022–2030)
- FIG. 11 Global Engineering Design and Development Outsourcing Market Revenue (US$ Bn) Comparison by Service (2014–2021)
- FIG. 12 Global Engineering Design and Development Outsourcing Market Revenue (US$ Bn) Comparison by Service (2022–2030)
- FIG. 13 Global Engineering Design and Development Outsourcing Market Revenue (US$ Bn) Comparison by Application (2014–2021)
- FIG. 14 Global Engineering Design and Development Outsourcing Market Revenue (US$ Bn) Comparison by Application (2022–2030)
- FIG. 15 Global Engineering Design and Development Outsourcing Market Y-o-Y Growth Rate Comparison by Region (2015–2021)
- FIG. 16 Global Engineering Design and Development Outsourcing Market Y-o-Y Growth Rate Comparison by Region (2022–2030)
- FIG. 17 Global Engineering Design and Development Outsourcing Market Y-o-Y Growth Rate Comparison by Service (2015–2021)
- FIG. 18 Global Engineering Design and Development Outsourcing Market Y-o-Y Growth Rate Comparison by Service (2022–2030)
- FIG. 19 Global Engineering Design and Development Outsourcing Market Y-o-Y Growth Rate Comparison by Application (2015–2021)
- FIG. 20 Global Engineering Design and Development Outsourcing Market Y-o-Y Growth Rate Comparison by Application (2022–2030)
- FIG. 21 Global Engineering Design and Development Outsourcing Market Share Comparison by Region (2014–2021)
- FIG. 22 Global Engineering Design and Development Outsourcing Market Share Comparison by Region (2022–2030)
- FIG. 23 Global Engineering Design and Development Outsourcing Market Share Comparison by Service (2014–2021)
- FIG. 24 Global Engineering Design and Development Outsourcing Market Share Comparison by Service (2022–2030)
- FIG. 25 Global Engineering Design and Development Outsourcing Market Share Comparison by Application (2014–2021)
- FIG. 26 Global Engineering Design and Development Outsourcing Market Share Comparison by Application (2022–2030)
- FIG. 27 Europe Engineering Design and Development Outsourcing Revenue (US$ Bn) Market Share by Service in 2020
- FIG. 28 Europe Engineering Design and Development Outsourcing Market Attractiveness Analysis by Service, 2014–2030
- FIG. 29 Europe Engineering Design and Development Outsourcing Revenue (US$ Bn) Market Share by Application in 2020
- FIG. 30 Europe Engineering Design and Development Outsourcing Market Attractiveness Analysis by Application, 2014–2030
- FIG. 31 Europe Engineering Design and Development Outsourcing Revenue (US$ Bn) Market Share by Region in 2020
- FIG. 32 Europe Engineering Design and Development Outsourcing Market Attractiveness Analysis by Region, 2014–2030
- FIG. 33 Europe Engineering Design and Development Outsourcing Market Revenue (US$ Bn) (2014–2021)
- FIG. 34 Europe Engineering Design and Development Outsourcing Market Revenue (US$ Bn) (2022–2030)
- FIG. 35 Europe Engineering Design and Development Outsourcing Market Revenue (US$ Bn) Comparison by Region (2014–2021)
- FIG. 36 Europe Engineering Design and Development Outsourcing Market Revenue (US$ Bn) Comparison by Region (2022–2030)
- FIG. 37 Europe Engineering Design and Development Outsourcing Market Revenue (US$ Bn) Comparison by Service (2014–2021)
- FIG. 38 Europe Engineering Design and Development Outsourcing Market Revenue (US$ Bn) Comparison by Service (2022–2030)
- FIG. 39 Europe Engineering Design and Development Outsourcing Market Revenue (US$ Bn) Comparison by Application (2014–2021)
- FIG. 40 Europe Engineering Design and Development Outsourcing Market Revenue (US$ Bn) Comparison by Application (2022–2030)
- FIG. 41 Europe Engineering Design and Development Outsourcing Market Y-o-Y Growth Rate Comparison by Region (2015–2021)
- FIG. 42 Europe Engineering Design and Development Outsourcing Market Y-o-Y Growth Rate Comparison by Region (2022–2030)
- FIG. 43 Europe Engineering Design and Development Outsourcing Market Y-o-Y Growth Rate Comparison by Service (2015–2021)
- FIG. 44 Europe Engineering Design and Development Outsourcing Market Y-o-Y Growth Rate Comparison by Service (2022–2030)
- FIG. 45 Europe Engineering Design and Development Outsourcing Market Y-o-Y Growth Rate Comparison by Application (2015–2021)
- FIG. 46 Europe Engineering Design and Development Outsourcing Market Y-o-Y Growth Rate Comparison by Application (2022–2030)
- FIG. 47 Europe Engineering Design and Development Outsourcing Market Share Comparison by Region (2014–2021)
- FIG. 48 Europe Engineering Design and Development Outsourcing Market Share Comparison by Region (2022–2030)
- FIG. 49 Europe Engineering Design and Development Outsourcing Market Share Comparison by Service (2014–2021)
- FIG. 50 Europe Engineering Design and Development Outsourcing Market Share Comparison by Service (2022–2030)
- FIG. 51 Europe Engineering Design and Development Outsourcing Market Share Comparison by Application (2014–2021)
- FIG. 52 Europe Engineering Design and Development Outsourcing Market Share Comparison by Application (2022–2030)
- FIG. 53 North America Engineering Design and Development Outsourcing Revenue (US$ Bn) Market Share by Service in 2020
- FIG. 54 North America Engineering Design and Development Outsourcing Market Attractiveness Analysis by Service, 2014–2030
- FIG. 55 North America Engineering Design and Development Outsourcing Revenue (US$ Bn) Market Share by Application in 2020
- FIG. 56 North America Engineering Design and Development Outsourcing Market Attractiveness Analysis by Application, 2014–2030
- FIG. 57 North America Engineering Design and Development Outsourcing Revenue (US$ Bn) Market Share by Region in 2020
- FIG. 58 North America Engineering Design and Development Outsourcing Market Attractiveness Analysis by Region, 2014–2030
- FIG. 59 North America Engineering Design and Development Outsourcing Market Revenue (US$ Bn) (2014–2021)
- FIG. 60 North America Engineering Design and Development Outsourcing Market Revenue (US$ Bn) (2022–2030)
- FIG. 61 North America Engineering Design and Development Outsourcing Market Revenue (US$ Bn) Comparison by Region (2014–2021)
- FIG. 62 North America Engineering Design and Development Outsourcing Market Revenue (US$ Bn) Comparison by Region (2022–2030)
- FIG. 63 North America Engineering Design and Development Outsourcing Market Revenue (US$ Bn) Comparison by Service (2014–2021)
- FIG. 64 North America Engineering Design and Development Outsourcing Market Revenue (US$ Bn) Comparison by Service (2022–2030)
- FIG. 65 North America Engineering Design and Development Outsourcing Market Revenue (US$ Bn) Comparison by Application (2014–2021)
- FIG. 66 North America Engineering Design and Development Outsourcing Market Revenue (US$ Bn) Comparison by Application (2022–2030)
- FIG. 67 North America Engineering Design and Development Outsourcing Market Y-o-Y Growth Rate Comparison by Region (2015–2021)
- FIG. 68 North America Engineering Design and Development Outsourcing Market Y-o-Y Growth Rate Comparison by Region (2022–2030)
- FIG. 69 North America Engineering Design and Development Outsourcing Market Y-o-Y Growth Rate Comparison by Service (2015–2021)
- FIG. 70 North America Engineering Design and Development Outsourcing Market Y-o-Y Growth Rate Comparison by Service (2022–2030)
- FIG. 71 North America Engineering Design and Development Outsourcing Market Y-o-Y Growth Rate Comparison by Application (2015–2021)
- FIG. 72 North America Engineering Design and Development Outsourcing Market Y-o-Y Growth Rate Comparison by Application (2022–2030)
- FIG. 73 North America Engineering Design and Development Outsourcing Market Share Comparison by Region (2014–2021)
- FIG. 74 North America Engineering Design and Development Outsourcing Market Share Comparison by Region (2022–2030)
- FIG. 75 North America Engineering Design and Development Outsourcing Market Share Comparison by Service (2014–2021)
- FIG. 76 North America Engineering Design and Development Outsourcing Market Share Comparison by Service (2022–2030)
- FIG. 77 North America Engineering Design and Development Outsourcing Market Share Comparison by Application (2014–2021)
- FIG. 78 North America Engineering Design and Development Outsourcing Market Share Comparison by Application (2022–2030)
- FIG. 79 APAC Engineering Design and Development Outsourcing Revenue (US$ Bn) Market Share by Service in 2020
- FIG. 80 APAC Engineering Design and Development Outsourcing Market Attractiveness Analysis by Service, 2014–2030
- FIG. 81 APAC Engineering Design and Development Outsourcing Revenue (US$ Bn) Market Share by Application in 2020
- FIG. 82 APAC Engineering Design and Development Outsourcing Market Attractiveness Analysis by Application, 2014–2030
- FIG. 83 APAC Engineering Design and Development Outsourcing Revenue (US$ Bn) Market Share by Region in 2020
- FIG. 84 APAC Engineering Design and Development Outsourcing Market Attractiveness Analysis by Region, 2014–2030
- FIG. 85 APAC Engineering Design and Development Outsourcing Market Revenue (US$ Bn) (2014–2021)
- FIG. 86 APAC Engineering Design and Development Outsourcing Market Revenue (US$ Bn) (2022–2030)
- FIG. 87 APAC Engineering Design and Development Outsourcing Market Revenue (US$ Bn) Comparison by Region (2014–2021)
- FIG. 88 APAC Engineering Design and Development Outsourcing Market Revenue (US$ Bn) Comparison by Region (2022–2030)
- FIG. 89 APAC Engineering Design and Development Outsourcing Market Revenue (US$ Bn) Comparison by Service (2014–2021)
- FIG. 90 APAC Engineering Design and Development Outsourcing Market Revenue (US$ Bn) Comparison by Service (2022–2030)
- FIG. 91 APAC Engineering Design and Development Outsourcing Market Revenue (US$ Bn) Comparison by Application (2014–2021)
- FIG. 92 APAC Engineering Design and Development Outsourcing Market Revenue (US$ Bn) Comparison by Application (2022–2030)
- FIG. 93 APAC Engineering Design and Development Outsourcing Market Y-o-Y Growth Rate Comparison by Region (2015–2021)
- FIG. 94 APAC Engineering Design and Development Outsourcing Market Y-o-Y Growth Rate Comparison by Region (2022–2030)
- FIG. 95 APAC Engineering Design and Development Outsourcing Market Y-o-Y Growth Rate Comparison by Service (2015–2021)
- FIG. 96 APAC Engineering Design and Development Outsourcing Market Y-o-Y Growth Rate Comparison by Service (2022–2030)
- FIG. 97 APAC Engineering Design and Development Outsourcing Market Y-o-Y Growth Rate Comparison by Application (2015–2021)
- FIG. 98 APAC Engineering Design and Development Outsourcing Market Y-o-Y Growth Rate Comparison by Application (2022–2030)
- FIG. 99 APAC Engineering Design and Development Outsourcing Market Share Comparison by Region (2014–2021)
- FIG. 100 APAC Engineering Design and Development Outsourcing Market Share Comparison by Region (2022–2030)
- FIG. 101 APAC Engineering Design and Development Outsourcing Market Share Comparison by Service (2014–2021)
- FIG. 102 APAC Engineering Design and Development Outsourcing Market Share Comparison by Service (2022–2030)
- FIG. 103 APAC Engineering Design and Development Outsourcing Market Share Comparison by Application (2014–2021)
- FIG. 104 APAC Engineering Design and Development Outsourcing Market Share Comparison by Application (2022–2030)
- FIG. 105 South America Engineering Design and Development Outsourcing Revenue (US$ Bn) Market Share by Service in 2020
- FIG. 106 South America Engineering Design and Development Outsourcing Market Attractiveness Analysis by Service, 2014–2030
- FIG. 107 South America Engineering Design and Development Outsourcing Revenue (US$ Bn) Market Share by Application in 2020
- FIG. 108 South America Engineering Design and Development Outsourcing Market Attractiveness Analysis by Application, 2014–2030
- FIG. 109 South America Engineering Design and Development Outsourcing Revenue (US$ Bn) Market Share by Region in 2020
- FIG. 110 South America Engineering Design and Development Outsourcing Market Attractiveness Analysis by Region, 2014–2030
- FIG. 111 South America Engineering Design and Development Outsourcing Market Revenue (US$ Bn) (2014–2021)
- FIG. 112 South America Engineering Design and Development Outsourcing Market Revenue (US$ Bn) (2022–2030)
- FIG. 113 South America Engineering Design and Development Outsourcing Market Revenue (US$ Bn) Comparison by Region (2014–2021)
- FIG. 114 South America Engineering Design and Development Outsourcing Market Revenue (US$ Bn) Comparison by Region (2022–2030)
- FIG. 115 South America Engineering Design and Development Outsourcing Market Revenue (US$ Bn) Comparison by Service (2014–2021)
- FIG. 116 South America Engineering Design and Development Outsourcing Market Revenue (US$ Bn) Comparison by Service (2022–2030)
- FIG. 117 South America Engineering Design and Development Outsourcing Market Revenue (US$ Bn) Comparison by Application (2014–2021)
- FIG. 118 South America Engineering Design and Development Outsourcing Market Revenue (US$ Bn) Comparison by Application (2022–2030)
- FIG. 119 South America Engineering Design and Development Outsourcing Market Y-o-Y Growth Rate Comparison by Region (2015–2021)
- FIG. 120 South America Engineering Design and Development Outsourcing Market Y-o-Y Growth Rate Comparison by Region (2022–2030)
- FIG. 121 South America Engineering Design and Development Outsourcing Market Y-o-Y Growth Rate Comparison by Service (2015–2021)
- FIG. 122 South America Engineering Design and Development Outsourcing Market Y-o-Y Growth Rate Comparison by Service (2022–2030)
- FIG. 123 South America Engineering Design and Development Outsourcing Market Y-o-Y Growth Rate Comparison by Application (2015–2021)
- FIG. 124 South America Engineering Design and Development Outsourcing Market Y-o-Y Growth Rate Comparison by Application (2022–2030)
- FIG. 125 South America Engineering Design and Development Outsourcing Market Share Comparison by Region (2014–2021)
- FIG. 126 South America Engineering Design and Development Outsourcing Market Share Comparison by Region (2022–2030)
- FIG. 127 South America Engineering Design and Development Outsourcing Market Share Comparison by Service (2014–2021)
- FIG. 128 South America Engineering Design and Development Outsourcing Market Share Comparison by Service (2022–2030)
- FIG. 129 South America Engineering Design and Development Outsourcing Market Share Comparison by Application (2014–2021)
- FIG. 130 South America Engineering Design and Development Outsourcing Market Share Comparison by Application (2022–2030)
- FIG. 131 MEA Engineering Design and Development Outsourcing Revenue (US$ Bn) Market Share by Service in 2020
- FIG. 132 MEA Engineering Design and Development Outsourcing Market Attractiveness Analysis by Service, 2014–2030
- FIG. 133 MEA Engineering Design and Development Outsourcing Revenue (US$ Bn) Market Share by Application in 2020
- FIG. 134 MEA Engineering Design and Development Outsourcing Market Attractiveness Analysis by Application, 2014–2030
- FIG. 135 MEA Engineering Design and Development Outsourcing Revenue (US$ Bn) Market Share by Region in 2020
- FIG. 136 MEA Engineering Design and Development Outsourcing Market Attractiveness Analysis by Region, 2014–2030
- FIG. 137 MEA Engineering Design and Development Outsourcing Market Revenue (US$ Bn) (2014–2021)
- FIG. 138 MEA Engineering Design and Development Outsourcing Market Revenue (US$ Bn) (2022–2030)
- FIG. 139 MEA Engineering Design and Development Outsourcing Market Revenue (US$ Bn) Comparison by Region (2014–2021)
- FIG. 140 MEA Engineering Design and Development Outsourcing Market Revenue (US$ Bn) Comparison by Region (2022–2030)
- FIG. 141 MEA Engineering Design and Development Outsourcing Market Revenue (US$ Bn) Comparison by Service (2014–2021)
- FIG. 142 MEA Engineering Design and Development Outsourcing Market Revenue (US$ Bn) Comparison by Service (2022–2030)
- FIG. 143 MEA Engineering Design and Development Outsourcing Market Revenue (US$ Bn) Comparison by Application (2014–2021)
- FIG. 144 MEA Engineering Design and Development Outsourcing Market Revenue (US$ Bn) Comparison by Application (2022–2030)
- FIG. 145 MEA Engineering Design and Development Outsourcing Market Y-o-Y Growth Rate Comparison by Region (2015–2021)
- FIG. 146 MEA Engineering Design and Development Outsourcing Market Y-o-Y Growth Rate Comparison by Region (2022–2030)
- FIG. 147 MEA Engineering Design and Development Outsourcing Market Y-o-Y Growth Rate Comparison by Service (2015–2021)
- FIG. 148 MEA Engineering Design and Development Outsourcing Market Y-o-Y Growth Rate Comparison by Service (2022–2030)
- FIG. 149 MEA Engineering Design and Development Outsourcing Market Y-o-Y Growth Rate Comparison by Application (2015–2021)
- FIG. 150 MEA Engineering Design and Development Outsourcing Market Y-o-Y Growth Rate Comparison by Application (2022–2030)
- FIG. 151 MEA Engineering Design and Development Outsourcing Market Share Comparison by Region (2014–2021)
- FIG. 152 MEA Engineering Design and Development Outsourcing Market Share Comparison by Region (2022–2030)
- FIG. 153 MEA Engineering Design and Development Outsourcing Market Share Comparison by Service (2014–2021)
- FIG. 154 MEA Engineering Design and Development Outsourcing Market Share Comparison by Service (2022–2030)
- FIG. 155 MEA Engineering Design and Development Outsourcing Market Share Comparison by Application (2014–2021)
- FIG. 156 MEA Engineering Design and Development Outsourcing Market Share Comparison by Application (2022–2030)
- List of Tables
- TABLE 1 Global Engineering Design and Development Outsourcing Market Comparison by Service (2014-2030)
- TABLE 2 Global Engineering Design and Development Outsourcing Market Comparison by Application (2014-2030)
- TABLE 3 Global Engineering Design and Development Outsourcing Revenue (US$ Bn) Comparison by Region (2014-2030)
- TABLE 4 Global Engineering Design and Development Outsourcing Market Revenue (US$ Bn) (2014–2021)
- TABLE 5 Global Engineering Design and Development Outsourcing Market Revenue (US$ Bn) (2022–2030)
- TABLE 6 Global Engineering Design and Development Outsourcing Market Revenue (US$ Bn) Comparison by Region (2014–2021)
- TABLE 7 Global Engineering Design and Development Outsourcing Market Revenue (US$ Bn) Comparison by Region (2022–2030)
- TABLE 8 Global Engineering Design and Development Outsourcing Market Revenue (US$ Bn) Comparison by Service (2014–2021)
- TABLE 9 Global Engineering Design and Development Outsourcing Market Revenue (US$ Bn) Comparison by Service (2022–2030)
- TABLE 10 Global Engineering Design and Development Outsourcing Market Revenue (US$ Bn) Comparison by Application (2014–2021)
- TABLE 11 Global Engineering Design and Development Outsourcing Market Revenue (US$ Bn) Comparison by Application (2022–2030)
- TABLE 12 Global Engineering Design and Development Outsourcing Market Y-o-Y Growth Rate Comparison by Region (2015–2021)
- TABLE 13 Global Engineering Design and Development Outsourcing Market Y-o-Y Growth Rate Comparison by Region (2022–2030)
- TABLE 14 Global Engineering Design and Development Outsourcing Market Y-o-Y Growth Rate Comparison by Service (2015–2021)
- TABLE 15 Global Engineering Design and Development Outsourcing Market Y-o-Y Growth Rate Comparison by Service (2022–2030)
- TABLE 16 Global Engineering Design and Development Outsourcing Market Y-o-Y Growth Rate Comparison by Application (2015–2021)
- TABLE 17 Global Engineering Design and Development Outsourcing Market Y-o-Y Growth Rate Comparison by Application (2022–2030)
- TABLE 18 Global Engineering Design and Development Outsourcing Market Share Comparison by Region (2014–2021)
- TABLE 19 Global Engineering Design and Development Outsourcing Market Share Comparison by Region (2022–2030)
- TABLE 20 Global Engineering Design and Development Outsourcing Market Share Comparison by Service (2014–2021)
- TABLE 21 Global Engineering Design and Development Outsourcing Market Share Comparison by Service (2022–2030)
- TABLE 22 Global Engineering Design and Development Outsourcing Market Share Comparison by Application (2014–2021)
- TABLE 23 Global Engineering Design and Development Outsourcing Market Share Comparison by Application (2022–2030)
- TABLE 24 Europe Engineering Design and Development Outsourcing Market Comparison by Service (2014-2030)
- TABLE 25 Europe Engineering Design and Development Outsourcing Market Comparison by Application (2014-2030)
- TABLE 26 Europe Engineering Design and Development Outsourcing Revenue (US$ Bn) Comparison by Region (2014-2030)
- TABLE 27 Europe Engineering Design and Development Outsourcing Market Revenue (US$ Bn) (2014–2021)
- TABLE 28 Europe Engineering Design and Development Outsourcing Market Revenue (US$ Bn) (2022–2030)
- TABLE 29 Europe Engineering Design and Development Outsourcing Market Revenue (US$ Bn) Comparison by Region (2014–2021)
- TABLE 30 Europe Engineering Design and Development Outsourcing Market Revenue (US$ Bn) Comparison by Region (2022–2030)
- TABLE 31 Europe Engineering Design and Development Outsourcing Market Revenue (US$ Bn) Comparison by Service (2014–2021)
- TABLE 32 Europe Engineering Design and Development Outsourcing Market Revenue (US$ Bn) Comparison by Service (2022–2030)
- TABLE 33 Europe Engineering Design and Development Outsourcing Market Revenue (US$ Bn) Comparison by Application (2014–2021)
- TABLE 34 Europe Engineering Design and Development Outsourcing Market Revenue (US$ Bn) Comparison by Application (2022–2030)
- TABLE 35 Europe Engineering Design and Development Outsourcing Market Y-o-Y Growth Rate Comparison by Region (2015–2021)
- TABLE 36 Europe Engineering Design and Development Outsourcing Market Y-o-Y Growth Rate Comparison by Region (2022–2030)
- TABLE 37 Europe Engineering Design and Development Outsourcing Market Y-o-Y Growth Rate Comparison by Service (2015–2021)
- TABLE 38 Europe Engineering Design and Development Outsourcing Market Y-o-Y Growth Rate Comparison by Service (2022–2030)
- TABLE 39 Europe Engineering Design and Development Outsourcing Market Y-o-Y Growth Rate Comparison by Application (2015–2021)
- TABLE 40 Europe Engineering Design and Development Outsourcing Market Y-o-Y Growth Rate Comparison by Application (2022–2030)
- TABLE 41 Europe Engineering Design and Development Outsourcing Market Share Comparison by Region (2014–2021)
- TABLE 42 Europe Engineering Design and Development Outsourcing Market Share Comparison by Region (2022–2030)
- TABLE 43 Europe Engineering Design and Development Outsourcing Market Share Comparison by Service (2014–2021)
- TABLE 44 Europe Engineering Design and Development Outsourcing Market Share Comparison by Service (2022–2030)
- TABLE 45 Europe Engineering Design and Development Outsourcing Market Share Comparison by Application (2014–2021)
- TABLE 46 Europe Engineering Design and Development Outsourcing Market Share Comparison by Application (2022–2030)
- TABLE 47 North America Engineering Design and Development Outsourcing Market Comparison by Service (2014-2030)
- TABLE 48 North America Engineering Design and Development Outsourcing Market Comparison by Application (2014-2030)
- TABLE 49 North America Engineering Design and Development Outsourcing Revenue (US$ Bn) Comparison by Region (2014-2030)
- TABLE 50 North America Engineering Design and Development Outsourcing Market Revenue (US$ Bn) (2014–2021)
- TABLE 51 North America Engineering Design and Development Outsourcing Market Revenue (US$ Bn) (2022–2030)
- TABLE 52 North America Engineering Design and Development Outsourcing Market Revenue (US$ Bn) Comparison by Region (2014–2021)
- TABLE 53 North America Engineering Design and Development Outsourcing Market Revenue (US$ Bn) Comparison by Region (2022–2030)
- TABLE 54 North America Engineering Design and Development Outsourcing Market Revenue (US$ Bn) Comparison by Service (2014–2021)
- TABLE 55 North America Engineering Design and Development Outsourcing Market Revenue (US$ Bn) Comparison by Service (2022–2030)
- TABLE 56 North America Engineering Design and Development Outsourcing Market Revenue (US$ Bn) Comparison by Application (2014–2021)
- TABLE 57 North America Engineering Design and Development Outsourcing Market Revenue (US$ Bn) Comparison by Application (2022–2030)
- TABLE 58 North America Engineering Design and Development Outsourcing Market Y-o-Y Growth Rate Comparison by Region (2015–2021)
- TABLE 59 North America Engineering Design and Development Outsourcing Market Y-o-Y Growth Rate Comparison by Region (2022–2030)
- TABLE 60 North America Engineering Design and Development Outsourcing Market Y-o-Y Growth Rate Comparison by Service (2015–2021)
- TABLE 61 North America Engineering Design and Development Outsourcing Market Y-o-Y Growth Rate Comparison by Service (2022–2030)
- TABLE 62 North America Engineering Design and Development Outsourcing Market Y-o-Y Growth Rate Comparison by Application (2015–2021)
- TABLE 63 North America Engineering Design and Development Outsourcing Market Y-o-Y Growth Rate Comparison by Application (2022–2030)
- TABLE 64 North America Engineering Design and Development Outsourcing Market Share Comparison by Region (2014–2021)
- TABLE 65 North America Engineering Design and Development Outsourcing Market Share Comparison by Region (2022–2030)
- TABLE 66 North America Engineering Design and Development Outsourcing Market Share Comparison by Service (2014–2021)
- TABLE 67 North America Engineering Design and Development Outsourcing Market Share Comparison by Service (2022–2030)
- TABLE 68 North America Engineering Design and Development Outsourcing Market Share Comparison by Application (2014–2021)
- TABLE 69 North America Engineering Design and Development Outsourcing Market Share Comparison by Application (2022–2030)
- TABLE 70 APAC Engineering Design and Development Outsourcing Market Comparison by Service (2014-2030)
- TABLE 71 APAC Engineering Design and Development Outsourcing Market Comparison by Application (2014-2030)
- TABLE 72 APAC Engineering Design and Development Outsourcing Revenue (US$ Bn) Comparison by Region (2014-2030)
- TABLE 73 APAC Engineering Design and Development Outsourcing Market Revenue (US$ Bn) (2014–2021)
- TABLE 74 APAC Engineering Design and Development Outsourcing Market Revenue (US$ Bn) (2022–2030)
- TABLE 75 APAC Engineering Design and Development Outsourcing Market Revenue (US$ Bn) Comparison by Region (2014–2021)
- TABLE 76 APAC Engineering Design and Development Outsourcing Market Revenue (US$ Bn) Comparison by Region (2022–2030)
- TABLE 77 APAC Engineering Design and Development Outsourcing Market Revenue (US$ Bn) Comparison by Service (2014–2021)
- TABLE 78 APAC Engineering Design and Development Outsourcing Market Revenue (US$ Bn) Comparison by Service (2022–2030)
- TABLE 79 APAC Engineering Design and Development Outsourcing Market Revenue (US$ Bn) Comparison by Application (2014–2021)
- TABLE 80 APAC Engineering Design and Development Outsourcing Market Revenue (US$ Bn) Comparison by Application (2022–2030)
- TABLE 81 APAC Engineering Design and Development Outsourcing Market Y-o-Y Growth Rate Comparison by Region (2015–2021)
- TABLE 82 APAC Engineering Design and Development Outsourcing Market Y-o-Y Growth Rate Comparison by Region (2022–2030)
- TABLE 83 APAC Engineering Design and Development Outsourcing Market Y-o-Y Growth Rate Comparison by Service (2015–2021)
- TABLE 84 APAC Engineering Design and Development Outsourcing Market Y-o-Y Growth Rate Comparison by Service (2022–2030)
- TABLE 85 APAC Engineering Design and Development Outsourcing Market Y-o-Y Growth Rate Comparison by Application (2015–2021)
- TABLE 86 APAC Engineering Design and Development Outsourcing Market Y-o-Y Growth Rate Comparison by Application (2022–2030)
- TABLE 87 APAC Engineering Design and Development Outsourcing Market Share Comparison by Region (2014–2021)
- TABLE 88 APAC Engineering Design and Development Outsourcing Market Share Comparison by Region (2022–2030)
- TABLE 89 APAC Engineering Design and Development Outsourcing Market Share Comparison by Service (2014–2021)
- TABLE 90 APAC Engineering Design and Development Outsourcing Market Share Comparison by Service (2022–2030)
- TABLE 91 APAC Engineering Design and Development Outsourcing Market Share Comparison by Application (2014–2021)
- TABLE 92 APAC Engineering Design and Development Outsourcing Market Share Comparison by Application (2022–2030)
- TABLE 93 South America Engineering Design and Development Outsourcing Market Comparison by Service (2014-2030)
- TABLE 94 South America Engineering Design and Development Outsourcing Market Comparison by Application (2014-2030)
- TABLE 95 South America Engineering Design and Development Outsourcing Revenue (US$ Bn) Comparison by Region (2014-2030)
- TABLE 96 South America Engineering Design and Development Outsourcing Market Revenue (US$ Bn) (2014–2021)
- TABLE 97 South America Engineering Design and Development Outsourcing Market Revenue (US$ Bn) (2022–2030)
- TABLE 98 South America Engineering Design and Development Outsourcing Market Revenue (US$ Bn) Comparison by Region (2014–2021)
- TABLE 99 South America Engineering Design and Development Outsourcing Market Revenue (US$ Bn) Comparison by Region (2022–2030)
- TABLE 100 South America Engineering Design and Development Outsourcing Market Revenue (US$ Bn) Comparison by Service (2014–2021)
- TABLE 101 South America Engineering Design and Development Outsourcing Market Revenue (US$ Bn) Comparison by Service (2022–2030)
- TABLE 102 South America Engineering Design and Development Outsourcing Market Revenue (US$ Bn) Comparison by Application (2014–2021)
- TABLE 103 South America Engineering Design and Development Outsourcing Market Revenue (US$ Bn) Comparison by Application (2022–2030)
- TABLE 104 South America Engineering Design and Development Outsourcing Market Y-o-Y Growth Rate Comparison by Region (2015–2021)
- TABLE 105 South America Engineering Design and Development Outsourcing Market Y-o-Y Growth Rate Comparison by Region (2022–2030)
- TABLE 106 South America Engineering Design and Development Outsourcing Market Y-o-Y Growth Rate Comparison by Service (2015–2021)
- TABLE 107 South America Engineering Design and Development Outsourcing Market Y-o-Y Growth Rate Comparison by Service (2022–2030)
- TABLE 108 South America Engineering Design and Development Outsourcing Market Y-o-Y Growth Rate Comparison by Application (2015–2021)
- TABLE 109 South America Engineering Design and Development Outsourcing Market Y-o-Y Growth Rate Comparison by Application (2022–2030)
- TABLE 110 South America Engineering Design and Development Outsourcing Market Share Comparison by Region (2014–2021)
- TABLE 111 South America Engineering Design and Development Outsourcing Market Share Comparison by Region (2022–2030)
- TABLE 112 South America Engineering Design and Development Outsourcing Market Share Comparison by Service (2014–2021)
- TABLE 113 South America Engineering Design and Development Outsourcing Market Share Comparison by Service (2022–2030)
- TABLE 114 South America Engineering Design and Development Outsourcing Market Share Comparison by Application (2014–2021)
- TABLE 115 South America Engineering Design and Development Outsourcing Market Share Comparison by Application (2022–2030)
- TABLE 116 MEA Engineering Design and Development Outsourcing Market Comparison by Service (2014-2030)
- TABLE 117 MEA Engineering Design and Development Outsourcing Market Comparison by Application (2014-2030)
- TABLE 118 MEA Engineering Design and Development Outsourcing Revenue (US$ Bn) Comparison by Region (2014-2030)
- TABLE 119 MEA Engineering Design and Development Outsourcing Market Revenue (US$ Bn) (2014–2021)
- TABLE 120 MEA Engineering Design and Development Outsourcing Market Revenue (US$ Bn) (2022–2030)
- TABLE 121 MEA Engineering Design and Development Outsourcing Market Revenue (US$ Bn) Comparison by Region (2014–2021)
- TABLE 122 MEA Engineering Design and Development Outsourcing Market Revenue (US$ Bn) Comparison by Region (2022–2030)
- TABLE 123 MEA Engineering Design and Development Outsourcing Market Revenue (US$ Bn) Comparison by Service (2014–2021)
- TABLE 124 MEA Engineering Design and Development Outsourcing Market Revenue (US$ Bn) Comparison by Service (2022–2030)
- TABLE 125 MEA Engineering Design and Development Outsourcing Market Revenue (US$ Bn) Comparison by Application (2014–2021)
- TABLE 126 MEA Engineering Design and Development Outsourcing Market Revenue (US$ Bn) Comparison by Application (2022–2030)
- TABLE 127 MEA Engineering Design and Development Outsourcing Market Y-o-Y Growth Rate Comparison by Region (2015–2021)
- TABLE 128 MEA Engineering Design and Development Outsourcing Market Y-o-Y Growth Rate Comparison by Region (2022–2030)
- TABLE 129 MEA Engineering Design and Development Outsourcing Market Y-o-Y Growth Rate Comparison by Service (2015–2021)
- TABLE 130 MEA Engineering Design and Development Outsourcing Market Y-o-Y Growth Rate Comparison by Service (2022–2030)
- TABLE 131 MEA Engineering Design and Development Outsourcing Market Y-o-Y Growth Rate Comparison by Application (2015–2021)
- TABLE 132 MEA Engineering Design and Development Outsourcing Market Y-o-Y Growth Rate Comparison by Application (2022–2030)
- TABLE 133 MEA Engineering Design and Development Outsourcing Market Share Comparison by Region (2014–2021)
- TABLE 134 MEA Engineering Design and Development Outsourcing Market Share Comparison by Region (2022–2030)
- TABLE 135 MEA Engineering Design and Development Outsourcing Market Share Comparison by Service (2014–2021)
- TABLE 136 MEA Engineering Design and Development Outsourcing Market Share Comparison by Service (2022–2030)
- TABLE 137 MEA Engineering Design and Development Outsourcing Market Share Comparison by Application (2014–2021)
- TABLE 138 MEA Engineering Design and Development Outsourcing Market Share Comparison by Application (2022–2030)
- TABLE 139 Table Key Data Information from Secondary Sources
- Chapter 1 Global Engineering Design and Development Outsourcing Market Overview
-
- Accenture plc
- Tata Consultancy Services Ltd.
- Capgemini SE
- Infosys Ltd.
- HCL Technologies Ltd.
- Wipro Ltd.
- Tech Mahindra Ltd.
- Alten SA
- EPAM Systems Inc.
- AKKA Technologies SE
- Bertrandt AG
- KPIT Technologies Ltd.


Our Clients


View Our Licence Options
