
Dysautonomia Market By Type (Neurogenic Orthostatic Hypotension, Postural Orthostatic Tachycardia Syndrome, and Other), By End-User (Hospitals, Homecare and other), By Region And Companies - Industry Segment Outlook, Market Assessment, Competition Scenario, Trends, And Forecast 2023-2032
-
38138
-
Jul 2023
-
164
-


-
This report was compiled by Correspondence Linkedin | Detailed Market research Methodology Our methodology involves a mix of primary research, including interviews with leading mental health experts, and secondary research from reputable medical journals and databases. View Detailed Methodology Page
-
Quick Navigation
Report Overview
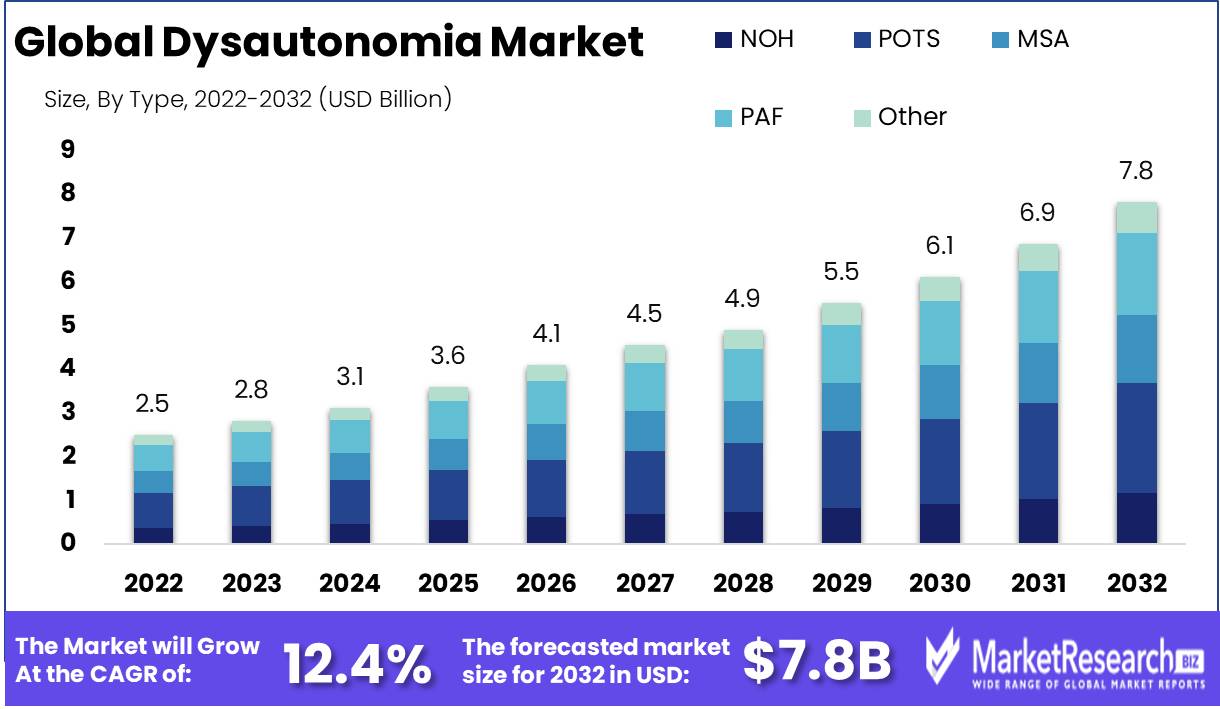
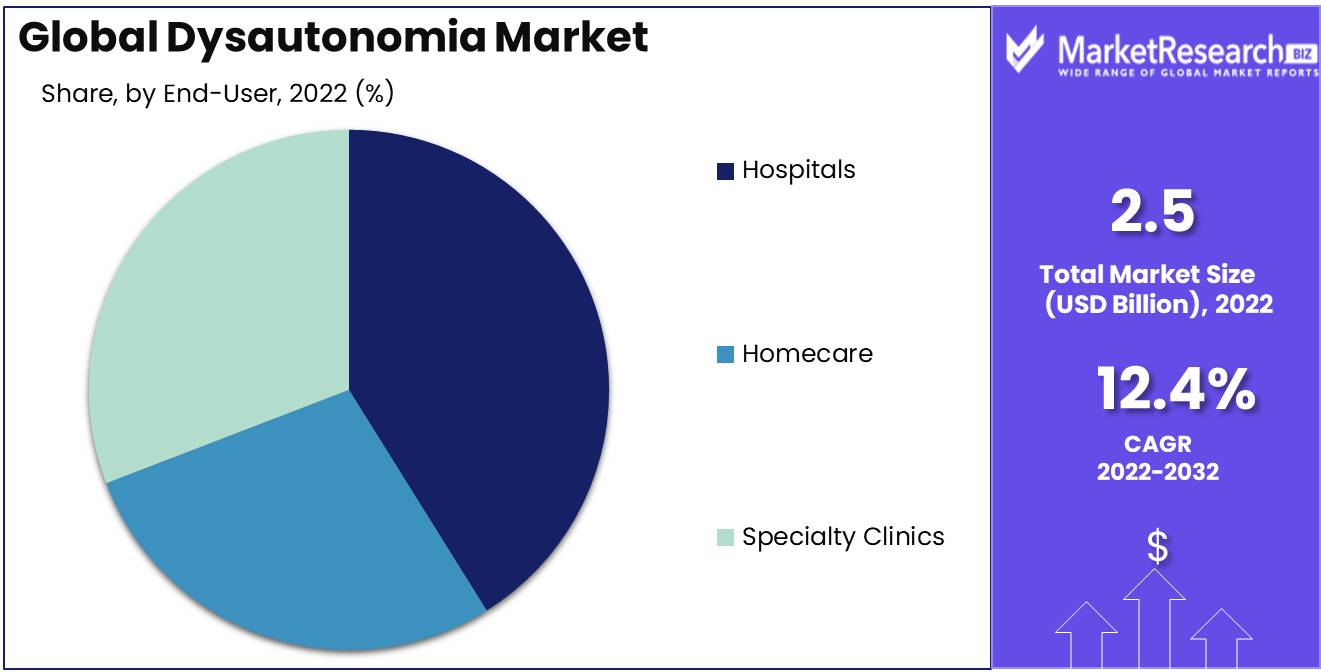
Dysautonomia Market size is expected to be worth around USD 7.8 Bn by 2032 from USD 2.5 Bn in 2022, growing at a CAGR of 12.4% during the forecast period from 2023 to 2032.
Dysautonomia, a condition that affects the autonomic nervous system, which is responsible for regulating automatic physiological functions, presents a difficult and intricate obstacle. It influences vital processes like heart rate, blood pressure, digestion, and temperature regulation. The various causes of dysautonomia include genetic factors, injuries, infections, and adverse drug reactions. Diverse symptoms, such as vertigo, fainting, fatigue, nausea, and palpitations, are attributable to the diversity of potential causes.
In recent years, significant advances have been made in the treatment of dysautonomia. Stem cell therapy, a particularly promising approach, provides hope by regenerating damaged or dysfunctional autonomic nervous system nerve cells. In addition to medications that target specific symptoms, innovations include the use of wearable devices and mobile applications for monitoring and management.
The dysautonomia market has attracted considerable private and public investment. The pharmaceutical industry is actively engaged in the development of new treatments and medications, whereas entrepreneurs introduce innovative products and services to help patients manage their symptoms. Integration of dysautonomia into industries such as healthcare, medical devices, and wearable technology is also growing.
The dysautonomia market is expected to experience significant growth over the next few years. Increasing awareness of the condition, advances in medical research, and the introduction of new products and services all contribute to this growth. Treatments for dysautonomia-related symptoms like fatigue, vertigo, and fainting will be in high demand. In addition to the development of diagnostic and monitoring tools and the implementation of technologies like stem cell therapy and wearables, there are additional growth opportunities.
Driving factors
Raising Awareness of the Disorder
The growing awareness of the condition among both the medical community and the general population is one of the main factors driving the dysautonomia market. As more information about dysautonomia and its diverse symptoms becomes available, there is an increased awareness of its prevalence and impact on individuals' lives. This increased awareness results in improved diagnosis rates and earlier intervention, thereby driving the demand for effective treatments and management strategies.
Progressions in Medical Research
Another significant factor driving the dysautonomia market is advancements in medical research. Scientists and researchers are actively researching dysautonomia's underlying causes, mechanisms, and potential treatments. Significant progress is being made through clinical trials, observational studies, and interdisciplinary collaborations in unraveling the complexities of this condition.
Not only does medical research improve our understanding of dysautonomia, but it also leads to the development of novel treatment methods. For instance, stem cell therapy shows promise for regenerating damaged nerve cells in the autonomic nervous system. This type of innovative research contributes to the expansion of therapeutic options for dysautonomia patients, leading to improved outcomes and quality of life.
Newly Introduced Products and Services
In response to the demand for better symptom management and enhanced patient care, the dysautonomia market is experiencing a surge in new product and service offerings. Both start-ups and established businesses are investing in the development of innovative solutions that address the unique challenges encountered by individuals with dysautonomia.
Monitoring and managing dysautonomia symptoms are greatly facilitated by wearable devices and mobile applications. These technologies allow patients to monitor their vital signs, such as pulse rate and blood pressure, and provide real-time alerts and feedback. In addition, they facilitate the collection of data for healthcare providers, thereby facilitating accurate diagnoses and individualized treatment plans.
Restraining Factors
Accurate Diagnosis and Classification of Dysautonomia
Due to the variability of its symptoms, dysautonomia can be difficult to accurately diagnose. Patients may present with vertigo, fainting, dysphagia, lightheadedness, fatigue, gastrointestinal dysfunction, issues with temperature regulation, and breathing difficulties. These symptoms can be transient. These symptoms are not exclusive to dysautonomia and may also be present in other medical conditions, resulting in misdiagnosis.
Variations within the condition further complicate the classification of dysautonomia. Dysautonomia is a spectrum of conditions with various etiologies and prognoses, rather than a single disorder. Therefore, a classification system that accounts for the heterogeneity of dysautonomia must be developed.
Few Treatment Options Available for Dysautonomia
Dysautonomia has no known cure and limited treatment options. Medication, lifestyle modification, and invasive procedures have been utilized to manage the symptoms of dysautonomia with variable degrees of success. Inadequate standardization of treatment protocols further reduces the effectiveness of these options. Clinicians must frequently rely on a trial-and-error approach to manage dysautonomia symptoms.
Variability in Symptoms and Treatment Response
Variability in symptoms and treatment response are characteristics of dysautonomia. Some patients may experience recurrent syncope, whereas others may present with milder symptoms. In addition, responses to the therapies used to manage dysautonomia symptoms can be unpredictable. This complicates the management of dysautonomia because clinicians must evaluate the efficacy of treatment and adjust it accordingly to prevent further complications.
Type Analysis
The Postural Orthostatic Tachycardia Syndrome (POTS) Segment is emerging as the dominant force in the Dysautonomia market, which is expanding quickly. This segment is anticipated to have the highest growth rate over the next few years due to several factors, such as economic growth in emerging economies and shifting consumer preferences and behaviors.
Postural Orthostatic Tachycardia Syndrome (POTS) is a form of dysautonomia that affects the autonomic nervous system and causes symptoms such as vertigo and tachycardia. This form of dysautonomia has become the dominant segment of the global dysautonomia market due to its increasing prevalence and growing awareness among patients and healthcare professionals.
The economic growth of emerging economies is one of the primary factors driving the global dysautonomia market's adoption of the POTS segment. As the economies of countries such as China, India, and Brazil continue to expand, so do their healthcare expenditures, resulting in a greater demand for healthcare services and remedies.
End User Analysis
The hospital market segment dominates the global dysautonomia market, generating the majority of revenue. Due to the high cost and complication of diagnosing and treating dysautonomia, this is the case. Patients with severe dysautonomia generally require hospitalization for the provision of specialized care and long-term management.
In addition, hospitals have greater access to sophisticated diagnostic tools and treatments, allowing them to provide patients with cutting-edge care. This has led to a growing demand for dysautonomia treatment services in hospitals.
The escalating adoption of hospital-based dysautonomia treatments is largely influenced by the economic growth of emergent economies. As the economies of developing nations continue to expand, so do healthcare expenditures, resulting in a greater demand for healthcare services and treatments.
This has allowed for increased investment in healthcare infrastructure, such as the development of advanced diagnostic instruments and treatments in hospitals. Patients in emerging economies now have increased access to high-quality healthcare services and dysautonomia treatments.
Key Market Segments
By Type
- Neurogenic Orthostatic Hypotension (NOH)
- Postural Orthostatic Tachycardia Syndrome (POTS)
- Multiple System Atrophy (MSA)
- Pure Autonomic Failure (PAF)
- Other
By End-User
- Hospitals
- Homecare
- Specialty Clinics
Growth Opportunity
Targeted Therapy Research and Development for Dysautonomia
One of the most significant growth opportunities in the global market is the development of targeted therapies for Dysautonomia. Current remedies for dysautonomia focus on symptom management rather than the underlying cause. Therefore, new and effective targeted therapies that can enhance the lives of those with dysautonomia are required.
Understanding the causes of dysautonomia can aid in the development of novel treatments. Several underlying causes of dysautonomia have been identified, including autonomic neuropathies, autoimmune diseases, and genetic mutations. This research can contribute to the development of targeted therapies that target the disease's underlying cause.
Increase in Diagnostic Capabilities
The expansion of diagnostic capabilities is a vital opportunity for growth in the global dysautonomia market. A thorough diagnosis is the first step in effectively managing dysautonomia. Currently, dysautonomia can be difficult to diagnose due to the complexity and variability of its symptoms.
Dysautonomia diagnosis can be substantially improved by investing in diagnostic tool research and development. Wearable devices and non-invasive diagnostic tools are examples of technological advancements that enable healthcare providers to make more expeditious and accurate diagnoses.
Programs for Patient Education and Support
Education and support programs for Dysautonomia patients can significantly improve their quality of life. These programs help patients understand their condition, manage their symptoms, and interact with others living with the same illness.
Together with patient advocacy groups, healthcare providers can develop patient education materials and organize support groups. These materials and programs can assist patients in keeping abreast of the most recent treatment options and best practices for symptom management.
Healthcare Provider and Patient Advocacy Group Collaboration
Collaboration between healthcare providers and patient advocacy groups is crucial for driving innovation and market expansion in the global dysautonomia market. Patient advocacy groups play an essential role in educating policymakers, raising awareness of Dysautonomia, and advocating for research and development of novel treatments and diagnostics.
Working closely with patient advocacy groups permits healthcare providers to comprehend the specific requirements of Dysautonomia patients and develop individualized treatments. Additionally, it facilitates the dissemination of crucial information and best practices throughout the dysautonomia community.
Latest Trends
Utilization of Medications to Manage Symptoms
One of the key market trends in dysautonomia treatment is the utilization of medications for symptom management. Various medications, including beta-blockers, midodrine, and fludrocortisone, are available for the treatment of dysautonomia symptoms. Commonly prescribed to control heart rate and blood pressure, beta-blockers may also prevent episodes of syncope. Midodrine and fludrocortisone are frequently prescribed to increase blood flow and blood pressure.
Medications can help manage dysautonomia symptoms, but they are not a cure for the condition. In addition, medications may have side effects and can interact with other medications, necessitating a healthcare provider's cautious monitoring. Despite these limitations, the market for dysautonomia continues to see an important trend in the utilization of medications for symptom management.
Modifications to one's lifestyle for symptom relief
Another significant trend in the dysautonomia market is the use of lifestyle adjustments to alleviate symptoms. For instance, exercise may enhance blood flow and reduce dizziness and fatigue. Maintaining adequate hydration, consuming smaller, more frequent meals, and avoiding stimuli such as alcohol and caffeine may also aid in the management of dysautonomia symptoms.
Other lifestyle adjustments may include donning compression stockings to prevent blood pooling in the legs, elevating the head of the bed to prevent fainting during sleep, and avoiding extreme temperatures. While lifestyle modifications may not be a cure for dysautonomia, they can help manage symptoms and enhance the quality of life for individuals who have the condition.
Development of Wearable Monitoring Devices for Autonomic Function
The development of ubiquitous devices for monitoring autonomic function is an additional significant market trend for dysautonomia. These devices may consist of, among others, heart rate monitors, blood pressure monitors, and activity sensors. By monitoring these vital signs, individuals with dysautonomia can better comprehend their condition and manage their symptoms.
Some wearable devices may also be able to detect autonomic function changes that precede symptoms. For instance, a heart rate monitor may detect a sudden decrease in heart rate, which may indicate an imminent episode of fainting. This knowledge can then be utilized to take preventative or mitigating measures, such as reclining down or taking medication.
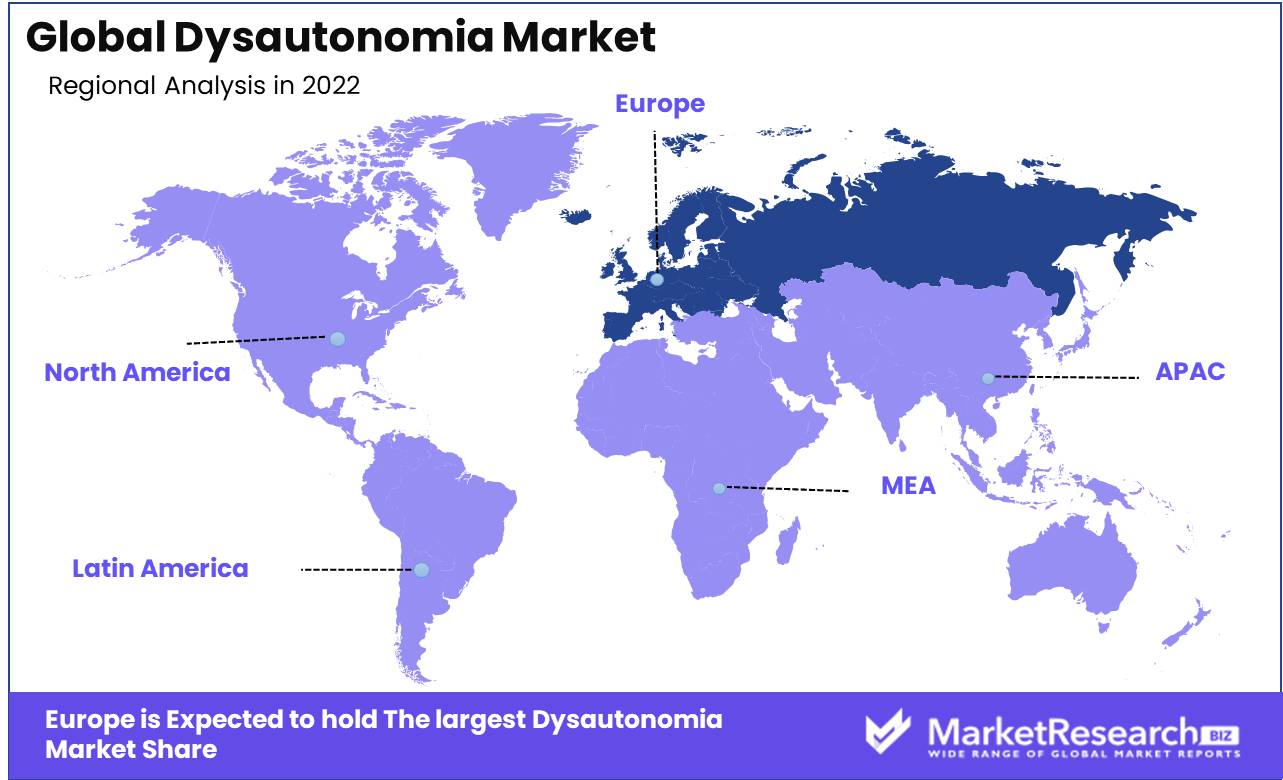
Regional Analysis
The Dysautonomia Market is dominated by Europe. In recent years, the dysautonomia market in Europe has experienced significant growth. The increasing awareness of the condition among patients and healthcare providers is a major factor in this growth. As more people become aware of the condition, there is a greater demand for diagnosis and treatment, which stimulates market growth.
The European healthcare system's strong emphasis on research and development also contributes to the growth of the dysautonomia market. Numerous European nations have well-funded medical research facilities, allowing them to conduct in-depth research on dysautonomia and develop innovative treatments.
In addition, Europe's healthcare system is highly regulated, ensuring that patients receive high-quality care and treatment. This has helped to build trust in the healthcare system, increasing in demand for dysautonomia treatment and driving market growth.
Key Regions and Countries
North America
- US
- Canada
- Mexico
Western Europe
- Germany
- France
- The UK
- Spain
- Italy
- Portugal
- Ireland
- Austria
- Switzerland
- Benelux
- Nordic
- Rest of Western Europe
Eastern Europe
- Russia
- Poland
- The Czech Republic
- Greece
- Rest of Eastern Europe
APAC
- China
- Japan
- South Korea
- India
- Australia & New Zealand
- Indonesia
- Malaysia
- Philippines
- Singapore
- Thailand
- Vietnam
- Rest of APAC
Latin America
- Brazil
- Colombia
- Chile
- Argentina
- Costa Rica
- Rest of Latin America
Middle East & Africa
- Algeria
- Egypt
- Israel
- Kuwait
- Nigeria
- Saudi Arabia
- South Africa
- Turkey
- United Arab Emirates
- Rest of MEA
Key Players Analysis
Dysautonomia is a medical condition that affects the autonomic nervous system, resulting in difficulties with functions such as pulse rate, blood pressure, digestion, and breathing. In the coming years, the global dysautonomia market is anticipated to expand substantially due to the condition's rising prevalence, rising public awareness, and technological advances in treatment.
The leading players in the global dysautonomia market are working to develop effective treatments and improve patient care facilities. Lundbeck, Amgen, Google Life Sciences, BioCryst Pharmaceuticals, and Eisai Inc. are some of the leading players in this market. These businesses engage in continuous research and development to enhance their product offerings and expand their market presence.
Lundbeck, a global pharmaceutical powerhouse, has a robust pipeline of treatments for numerous diseases of the nervous system, including dysautonomia. The company has made substantial investments in research and development to develop innovative treatments for dysautonomia.
Amgen, on the other hand, is a biopharmaceutical company that has been working to develop a treatment for familial amyloidotic neuropathy, a nerve disorder that may result in dysautonomia. The company has collaborated with several healthcare facilities to enhance patient care and develop novel treatments for a variety of diseases.
Top Key Players in Dysautonomia Market
- Novartis AG
- Axsome Therapeutics
- Share
- Pfizer Inc
- Lundbeck
- Celltex Therapeutics
- Theravance Biopharma
- Santhera Pharmaceuticals
- Merck & Co. Inc.
- Other
Recent Development
- In 2022, Lundbeck announced the launch of Vagus Nerve Stimulation (VNS) Therapy for the treatment of Postural Orthostatic Tachycardia Syndrome (POTS). VNS Therapy is a minimally invasive procedure involving the subcutaneous implantation of a small device in the thorax.
- In 2022, Inspire Medical Systems announced the approval of its InspiraTM Wearable Loop for the treatment of Obstructive Sleep Apnea (OSA) by the Food and Drug Administration. The InspiraTM Wearable Loop is a compact, wireless, chest-mounted device.
- In 2023, Autonomic Technologies announced the launch of its Autonomic Tone Control (ATC) System for the treatment of Dysautonomia. The ATC System is a noninvasive electrical stimulation device for the vagus nerve.
- In 2023, Dysautonomia International announced the launch of Dysautonomia Awareness Month. The purpose of this campaign is to increase awareness of Dysautonomia and its symptoms.
Report Scope
Report Features Description Market Value (2022) USD 2.5 Bn Forecast Revenue (2032) USD 7.8 Bn CAGR (2023-2032) 12.4% Base Year for Estimation 2022 Historic Period 2016-2022 Forecast Period 2023-2032 Report Coverage Revenue Forecast, Market Dynamics, COVID-19 Impact, Competitive Landscape, Recent Developments Segments Covered By Type (Neurogenic Orthostatic Hypotension (NOH), Postural Orthostatic Tachycardia Syndrome (POTS), Multiple System Atrophy (MSA), Pure Autonomic Failure (PAF), Other )
By End-User (Hospitals, Homecare, Specialty Clinics)Regional Analysis North America – The US, Canada, & Mexico; Western Europe – Germany, France, The UK, Spain, Italy, Portugal, Ireland, Austria, Switzerland, Benelux, Nordic, & Rest of Western Europe; Eastern Europe – Russia, Poland, The Czech Republic, Greece, & Rest of Eastern Europe; APAC – China, Japan, South Korea, India, Australia & New Zealand, Indonesia, Malaysia, Philippines, Singapore, Thailand, Vietnam, & Rest of APAC; Latin America – Brazil, Colombia, Chile, Argentina, Costa Rica, & Rest of Latin America; the Middle East & Africa – Algeria, Egypt, Israel, Kuwait, Nigeria, Saudi Arabia, South Africa, Turkey, United Arab Emirates, & Rest of MEA Competitive Landscape Novartis AG, Axsome Therapeutics, Shire, Pfizer Inc, Lundbeck, Celltex Therapeutics, Theravance Biopharma, Santhera Pharmaceuticals, Merck & Co. Inc., Other Key Players Customization Scope Customization for segments, region/country-level will be provided. Moreover, additional customization can be done based on the requirements. Purchase Options We have three licenses to opt for Single User License, Multi-User License (Up to 5 Users), Corporate Use License (Unlimited User and Printable PDF) -
- 1. Executive Summary
- 1.1. Definition
- 1.2. Taxonomy
- 1.3. Research Scope
- 1.4. Key Analysis
- 1.5. Key Findings by Major Segments
- 1.6. Top strategies by Major Players
- 2. Global Dysautonomia Market Overview
- 2.1. Dysautonomia Market Dynamics
- 2.1.1. Drivers
- 2.1.2. Opportunities
- 2.1.3. Restraints
- 2.1.4. Challenges
- 2.2. Macro-economic Factors
- 2.3. Regulatory Framework
- 2.4. Market Investment Feasibility Index
- 2.5. PEST Analysis
- 2.6. PORTER’S Five Force Analysis
- 2.7. Drivers & Restraints Impact Analysis
- 2.8. Industry Chain Analysis
- 2.9. Cost Structure Analysis
- 2.10. Marketing Strategy
- 2.11. Russia-Ukraine War Impact Analysis
- 2.12. Opportunity Map Analysis
- 2.13. Market Competition Scenario Analysis
- 2.14. Product Life Cycle Analysis
- 2.15. Opportunity Orbits
- 2.16. Manufacturer Intensity Map
- 2.17. Major Companies sales by Value & Volume
- 2.1. Dysautonomia Market Dynamics
- 3. Global Dysautonomia Market Analysis, Opportunity and Forecast, 2016-2032
- 3.1. Global Dysautonomia Market Analysis, 2016-2021
- 3.2. Global Dysautonomia Market Opportunity and Forecast, 2023-2032
- 3.3. Global Dysautonomia Market Analysis, Opportunity and Forecast, By By Type, 2016-2032
- 3.3.1. Global Dysautonomia Market Analysis by By Type: Introduction
- 3.3.2. Market Size Absolute $ Opportunity Analysis and Forecast, By By Type, 2016-2032
- 3.3.3. Neurogenic Orthostatic Hypotension (NOH)
- 3.3.4. Postural Orthostatic Tachycardia Syndrome (POTS)
- 3.3.5. Multiple System Atrophy (MSA)
- 3.3.6. Pure Autonomic Failure (PAF)
- 3.3.7. Other
- 3.4. Global Dysautonomia Market Analysis, Opportunity and Forecast, By By End-User, 2016-2032
- 3.4.1. Global Dysautonomia Market Analysis by By End-User: Introduction
- 3.4.2. Market Size Absolute $ Opportunity Analysis and Forecast, By By End-User, 2016-2032
- 3.4.3. Hospitals
- 3.4.4. Homecare
- 3.4.5. Specialty Clinics
- 4. North America Dysautonomia Market Analysis, Opportunity and Forecast, 2016-2032
- 4.1. North America Dysautonomia Market Analysis, 2016-2021
- 4.2. North America Dysautonomia Market Opportunity and Forecast, 2023-2032
- 4.3. North America Dysautonomia Market Analysis, Opportunity and Forecast, By By Type, 2016-2032
- 4.3.1. North America Dysautonomia Market Analysis by By Type: Introduction
- 4.3.2. Market Size Absolute $ Opportunity Analysis and Forecast, By By Type, 2016-2032
- 4.3.3. Neurogenic Orthostatic Hypotension (NOH)
- 4.3.4. Postural Orthostatic Tachycardia Syndrome (POTS)
- 4.3.5. Multiple System Atrophy (MSA)
- 4.3.6. Pure Autonomic Failure (PAF)
- 4.3.7. Other
- 4.4. North America Dysautonomia Market Analysis, Opportunity and Forecast, By By End-User, 2016-2032
- 4.4.1. North America Dysautonomia Market Analysis by By End-User: Introduction
- 4.4.2. Market Size Absolute $ Opportunity Analysis and Forecast, By By End-User, 2016-2032
- 4.4.3. Hospitals
- 4.4.4. Homecare
- 4.4.5. Specialty Clinics
- 4.5. North America Dysautonomia Market Analysis, Opportunity and Forecast, By Country , 2016-2032
- 4.5.1. North America Dysautonomia Market Analysis by Country : Introduction
- 4.5.2. Market Size Absolute $ Opportunity Analysis and Forecast, Country , 2016-2032
- 4.5.2.1. The US
- 4.5.2.2. Canada
- 4.5.2.3. Mexico
- 5. Western Europe Dysautonomia Market Analysis, Opportunity and Forecast, 2016-2032
- 5.1. Western Europe Dysautonomia Market Analysis, 2016-2021
- 5.2. Western Europe Dysautonomia Market Opportunity and Forecast, 2023-2032
- 5.3. Western Europe Dysautonomia Market Analysis, Opportunity and Forecast, By By Type, 2016-2032
- 5.3.1. Western Europe Dysautonomia Market Analysis by By Type: Introduction
- 5.3.2. Market Size Absolute $ Opportunity Analysis and Forecast, By By Type, 2016-2032
- 5.3.3. Neurogenic Orthostatic Hypotension (NOH)
- 5.3.4. Postural Orthostatic Tachycardia Syndrome (POTS)
- 5.3.5. Multiple System Atrophy (MSA)
- 5.3.6. Pure Autonomic Failure (PAF)
- 5.3.7. Other
- 5.4. Western Europe Dysautonomia Market Analysis, Opportunity and Forecast, By By End-User, 2016-2032
- 5.4.1. Western Europe Dysautonomia Market Analysis by By End-User: Introduction
- 5.4.2. Market Size Absolute $ Opportunity Analysis and Forecast, By By End-User, 2016-2032
- 5.4.3. Hospitals
- 5.4.4. Homecare
- 5.4.5. Specialty Clinics
- 5.5. Western Europe Dysautonomia Market Analysis, Opportunity and Forecast, By Country , 2016-2032
- 5.5.1. Western Europe Dysautonomia Market Analysis by Country : Introduction
- 5.5.2. Market Size Absolute $ Opportunity Analysis and Forecast, Country , 2016-2032
- 5.5.2.1. Germany
- 5.5.2.2. France
- 5.5.2.3. The UK
- 5.5.2.4. Spain
- 5.5.2.5. Italy
- 5.5.2.6. Portugal
- 5.5.2.7. Ireland
- 5.5.2.8. Austria
- 5.5.2.9. Switzerland
- 5.5.2.10. Benelux
- 5.5.2.11. Nordic
- 5.5.2.12. Rest of Western Europe
- 6. Eastern Europe Dysautonomia Market Analysis, Opportunity and Forecast, 2016-2032
- 6.1. Eastern Europe Dysautonomia Market Analysis, 2016-2021
- 6.2. Eastern Europe Dysautonomia Market Opportunity and Forecast, 2023-2032
- 6.3. Eastern Europe Dysautonomia Market Analysis, Opportunity and Forecast, By By Type, 2016-2032
- 6.3.1. Eastern Europe Dysautonomia Market Analysis by By Type: Introduction
- 6.3.2. Market Size Absolute $ Opportunity Analysis and Forecast, By By Type, 2016-2032
- 6.3.3. Neurogenic Orthostatic Hypotension (NOH)
- 6.3.4. Postural Orthostatic Tachycardia Syndrome (POTS)
- 6.3.5. Multiple System Atrophy (MSA)
- 6.3.6. Pure Autonomic Failure (PAF)
- 6.3.7. Other
- 6.4. Eastern Europe Dysautonomia Market Analysis, Opportunity and Forecast, By By End-User, 2016-2032
- 6.4.1. Eastern Europe Dysautonomia Market Analysis by By End-User: Introduction
- 6.4.2. Market Size Absolute $ Opportunity Analysis and Forecast, By By End-User, 2016-2032
- 6.4.3. Hospitals
- 6.4.4. Homecare
- 6.4.5. Specialty Clinics
- 6.5. Eastern Europe Dysautonomia Market Analysis, Opportunity and Forecast, By Country , 2016-2032
- 6.5.1. Eastern Europe Dysautonomia Market Analysis by Country : Introduction
- 6.5.2. Market Size Absolute $ Opportunity Analysis and Forecast, Country , 2016-2032
- 6.5.2.1. Russia
- 6.5.2.2. Poland
- 6.5.2.3. The Czech Republic
- 6.5.2.4. Greece
- 6.5.2.5. Rest of Eastern Europe
- 7. APAC Dysautonomia Market Analysis, Opportunity and Forecast, 2016-2032
- 7.1. APAC Dysautonomia Market Analysis, 2016-2021
- 7.2. APAC Dysautonomia Market Opportunity and Forecast, 2023-2032
- 7.3. APAC Dysautonomia Market Analysis, Opportunity and Forecast, By By Type, 2016-2032
- 7.3.1. APAC Dysautonomia Market Analysis by By Type: Introduction
- 7.3.2. Market Size Absolute $ Opportunity Analysis and Forecast, By By Type, 2016-2032
- 7.3.3. Neurogenic Orthostatic Hypotension (NOH)
- 7.3.4. Postural Orthostatic Tachycardia Syndrome (POTS)
- 7.3.5. Multiple System Atrophy (MSA)
- 7.3.6. Pure Autonomic Failure (PAF)
- 7.3.7. Other
- 7.4. APAC Dysautonomia Market Analysis, Opportunity and Forecast, By By End-User, 2016-2032
- 7.4.1. APAC Dysautonomia Market Analysis by By End-User: Introduction
- 7.4.2. Market Size Absolute $ Opportunity Analysis and Forecast, By By End-User, 2016-2032
- 7.4.3. Hospitals
- 7.4.4. Homecare
- 7.4.5. Specialty Clinics
- 7.5. APAC Dysautonomia Market Analysis, Opportunity and Forecast, By Country , 2016-2032
- 7.5.1. APAC Dysautonomia Market Analysis by Country : Introduction
- 7.5.2. Market Size Absolute $ Opportunity Analysis and Forecast, Country , 2016-2032
- 7.5.2.1. China
- 7.5.2.2. Japan
- 7.5.2.3. South Korea
- 7.5.2.4. India
- 7.5.2.5. Australia & New Zeland
- 7.5.2.6. Indonesia
- 7.5.2.7. Malaysia
- 7.5.2.8. Philippines
- 7.5.2.9. Singapore
- 7.5.2.10. Thailand
- 7.5.2.11. Vietnam
- 7.5.2.12. Rest of APAC
- 8. Latin America Dysautonomia Market Analysis, Opportunity and Forecast, 2016-2032
- 8.1. Latin America Dysautonomia Market Analysis, 2016-2021
- 8.2. Latin America Dysautonomia Market Opportunity and Forecast, 2023-2032
- 8.3. Latin America Dysautonomia Market Analysis, Opportunity and Forecast, By By Type, 2016-2032
- 8.3.1. Latin America Dysautonomia Market Analysis by By Type: Introduction
- 8.3.2. Market Size Absolute $ Opportunity Analysis and Forecast, By By Type, 2016-2032
- 8.3.3. Neurogenic Orthostatic Hypotension (NOH)
- 8.3.4. Postural Orthostatic Tachycardia Syndrome (POTS)
- 8.3.5. Multiple System Atrophy (MSA)
- 8.3.6. Pure Autonomic Failure (PAF)
- 8.3.7. Other
- 8.4. Latin America Dysautonomia Market Analysis, Opportunity and Forecast, By By End-User, 2016-2032
- 8.4.1. Latin America Dysautonomia Market Analysis by By End-User: Introduction
- 8.4.2. Market Size Absolute $ Opportunity Analysis and Forecast, By By End-User, 2016-2032
- 8.4.3. Hospitals
- 8.4.4. Homecare
- 8.4.5. Specialty Clinics
- 8.5. Latin America Dysautonomia Market Analysis, Opportunity and Forecast, By Country , 2016-2032
- 8.5.1. Latin America Dysautonomia Market Analysis by Country : Introduction
- 8.5.2. Market Size Absolute $ Opportunity Analysis and Forecast, Country , 2016-2032
- 8.5.2.1. Brazil
- 8.5.2.2. Colombia
- 8.5.2.3. Chile
- 8.5.2.4. Argentina
- 8.5.2.5. Costa Rica
- 8.5.2.6. Rest of Latin America
- 9. Middle East & Africa Dysautonomia Market Analysis, Opportunity and Forecast, 2016-2032
- 9.1. Middle East & Africa Dysautonomia Market Analysis, 2016-2021
- 9.2. Middle East & Africa Dysautonomia Market Opportunity and Forecast, 2023-2032
- 9.3. Middle East & Africa Dysautonomia Market Analysis, Opportunity and Forecast, By By Type, 2016-2032
- 9.3.1. Middle East & Africa Dysautonomia Market Analysis by By Type: Introduction
- 9.3.2. Market Size Absolute $ Opportunity Analysis and Forecast, By By Type, 2016-2032
- 9.3.3. Neurogenic Orthostatic Hypotension (NOH)
- 9.3.4. Postural Orthostatic Tachycardia Syndrome (POTS)
- 9.3.5. Multiple System Atrophy (MSA)
- 9.3.6. Pure Autonomic Failure (PAF)
- 9.3.7. Other
- 9.4. Middle East & Africa Dysautonomia Market Analysis, Opportunity and Forecast, By By End-User, 2016-2032
- 9.4.1. Middle East & Africa Dysautonomia Market Analysis by By End-User: Introduction
- 9.4.2. Market Size Absolute $ Opportunity Analysis and Forecast, By By End-User, 2016-2032
- 9.4.3. Hospitals
- 9.4.4. Homecare
- 9.4.5. Specialty Clinics
- 9.5. Middle East & Africa Dysautonomia Market Analysis, Opportunity and Forecast, By Country , 2016-2032
- 9.5.1. Middle East & Africa Dysautonomia Market Analysis by Country : Introduction
- 9.5.2. Market Size Absolute $ Opportunity Analysis and Forecast, Country , 2016-2032
- 9.5.2.1. Algeria
- 9.5.2.2. Egypt
- 9.5.2.3. Israel
- 9.5.2.4. Kuwait
- 9.5.2.5. Nigeria
- 9.5.2.6. Saudi Arabia
- 9.5.2.7. South Africa
- 9.5.2.8. Turkey
- 9.5.2.9. The UAE
- 9.5.2.10. Rest of MEA
- 10. Global Dysautonomia Market Analysis, Opportunity and Forecast, By Region , 2016-2032
- 10.1. Global Dysautonomia Market Analysis by Region : Introduction
- 10.2. Market Size Absolute $ Opportunity Analysis and Forecast, By Region , 2016-2032
- 10.2.1. North America
- 10.2.2. Western Europe
- 10.2.3. Eastern Europe
- 10.2.4. APAC
- 10.2.5. Latin America
- 10.2.6. Middle East & Africa
- 11. Global Dysautonomia Market Competitive Landscape, Market Share Analysis, and Company Profiles
- 11.1. Market Share Analysis
- 11.2. Company Profiles
- 11.3. Novartis AG
- 11.3.1. Company Overview
- 11.3.2. Financial Highlights
- 11.3.3. Product Portfolio
- 11.3.4. SWOT Analysis
- 11.3.5. Key Strategies and Developments
- 11.4. Axsome Therapeutics
- 11.4.1. Company Overview
- 11.4.2. Financial Highlights
- 11.4.3. Product Portfolio
- 11.4.4. SWOT Analysis
- 11.4.5. Key Strategies and Developments
- 11.5. Shire
- 11.5.1. Company Overview
- 11.5.2. Financial Highlights
- 11.5.3. Product Portfolio
- 11.5.4. SWOT Analysis
- 11.5.5. Key Strategies and Developments
- 11.6. Pfizer Inc
- 11.6.1. Company Overview
- 11.6.2. Financial Highlights
- 11.6.3. Product Portfolio
- 11.6.4. SWOT Analysis
- 11.6.5. Key Strategies and Developments
- 11.7. Lundbeck
- 11.7.1. Company Overview
- 11.7.2. Financial Highlights
- 11.7.3. Product Portfolio
- 11.7.4. SWOT Analysis
- 11.7.5. Key Strategies and Developments
- 11.8. Celltex Therapeutics
- 11.8.1. Company Overview
- 11.8.2. Financial Highlights
- 11.8.3. Product Portfolio
- 11.8.4. SWOT Analysis
- 11.8.5. Key Strategies and Developments
- 11.9. Theravance Biopharma
- 11.9.1. Company Overview
- 11.9.2. Financial Highlights
- 11.9.3. Product Portfolio
- 11.9.4. SWOT Analysis
- 11.9.5. Key Strategies and Developments
- 11.10. Santhera Pharmaceuticals
- 11.10.1. Company Overview
- 11.10.2. Financial Highlights
- 11.10.3. Product Portfolio
- 11.10.4. SWOT Analysis
- 11.10.5. Key Strategies and Developments
- 11.11. Merck & Co. Inc.
- 11.11.1. Company Overview
- 11.11.2. Financial Highlights
- 11.11.3. Product Portfolio
- 11.11.4. SWOT Analysis
- 11.11.5. Key Strategies and Developments
- 11.12. Other
- 11.12.1. Company Overview
- 11.12.2. Financial Highlights
- 11.12.3. Product Portfolio
- 11.12.4. SWOT Analysis
- 11.12.5. Key Strategies and Developments
- 12. Assumptions and Acronyms
- 13. Research Methodology
- 14. Contact
List of Figures
-
- Figure 1: Global Dysautonomia Market Revenue (US$ Mn) Market Share by By Type in 2022
- Figure 2: Global Dysautonomia Market Attractiveness Analysis by By Type, 2016-2032
- Figure 3: Global Dysautonomia Market Revenue (US$ Mn) Market Share by By End-Userin 2022
- Figure 4: Global Dysautonomia Market Attractiveness Analysis by By End-User, 2016-2032
- Figure 5: Global Dysautonomia Market Revenue (US$ Mn) Market Share by Region in 2022
- Figure 6: Global Dysautonomia Market Attractiveness Analysis by Region, 2016-2032
- Figure 7: Global Dysautonomia Market Revenue (US$ Mn) (2016-2032)
- Figure 8: Global Dysautonomia Market Revenue (US$ Mn) Comparison by Region (2016-2032)
- Figure 9: Global Dysautonomia Market Revenue (US$ Mn) Comparison by By Type (2016-2032)
- Figure 10: Global Dysautonomia Market Revenue (US$ Mn) Comparison by By End-User (2016-2032)
- Figure 11: Global Dysautonomia Market Y-o-Y Growth Rate Comparison by Region (2016-2032)
- Figure 12: Global Dysautonomia Market Y-o-Y Growth Rate Comparison by By Type (2016-2032)
- Figure 13: Global Dysautonomia Market Y-o-Y Growth Rate Comparison by By End-User (2016-2032)
- Figure 14: Global Dysautonomia Market Share Comparison by Region (2016-2032)
- Figure 15: Global Dysautonomia Market Share Comparison by By Type (2016-2032)
- Figure 16: Global Dysautonomia Market Share Comparison by By End-User (2016-2032)
- Figure 17: North America Dysautonomia Market Revenue (US$ Mn) Market Share by By Typein 2022
- Figure 18: North America Dysautonomia Market Attractiveness Analysis by By Type, 2016-2032
- Figure 19: North America Dysautonomia Market Revenue (US$ Mn) Market Share by By End-Userin 2022
- Figure 20: North America Dysautonomia Market Attractiveness Analysis by By End-User, 2016-2032
- Figure 21: North America Dysautonomia Market Revenue (US$ Mn) Market Share by Country in 2022
- Figure 22: North America Dysautonomia Market Attractiveness Analysis by Country, 2016-2032
- Figure 23: North America Dysautonomia Market Revenue (US$ Mn) (2016-2032)
- Figure 24: North America Dysautonomia Market Revenue (US$ Mn) Comparison by Country (2016-2032)
- Figure 25: North America Dysautonomia Market Revenue (US$ Mn) Comparison by By Type (2016-2032)
- Figure 26: North America Dysautonomia Market Revenue (US$ Mn) Comparison by By End-User (2016-2032)
- Figure 27: North America Dysautonomia Market Y-o-Y Growth Rate Comparison by Country (2016-2032)
- Figure 28: North America Dysautonomia Market Y-o-Y Growth Rate Comparison by By Type (2016-2032)
- Figure 29: North America Dysautonomia Market Y-o-Y Growth Rate Comparison by By End-User (2016-2032)
- Figure 30: North America Dysautonomia Market Share Comparison by Country (2016-2032)
- Figure 31: North America Dysautonomia Market Share Comparison by By Type (2016-2032)
- Figure 32: North America Dysautonomia Market Share Comparison by By End-User (2016-2032)
- Figure 33: Western Europe Dysautonomia Market Revenue (US$ Mn) Market Share by By Typein 2022
- Figure 34: Western Europe Dysautonomia Market Attractiveness Analysis by By Type, 2016-2032
- Figure 35: Western Europe Dysautonomia Market Revenue (US$ Mn) Market Share by By End-Userin 2022
- Figure 36: Western Europe Dysautonomia Market Attractiveness Analysis by By End-User, 2016-2032
- Figure 37: Western Europe Dysautonomia Market Revenue (US$ Mn) Market Share by Country in 2022
- Figure 38: Western Europe Dysautonomia Market Attractiveness Analysis by Country, 2016-2032
- Figure 39: Western Europe Dysautonomia Market Revenue (US$ Mn) (2016-2032)
- Figure 40: Western Europe Dysautonomia Market Revenue (US$ Mn) Comparison by Country (2016-2032)
- Figure 41: Western Europe Dysautonomia Market Revenue (US$ Mn) Comparison by By Type (2016-2032)
- Figure 42: Western Europe Dysautonomia Market Revenue (US$ Mn) Comparison by By End-User (2016-2032)
- Figure 43: Western Europe Dysautonomia Market Y-o-Y Growth Rate Comparison by Country (2016-2032)
- Figure 44: Western Europe Dysautonomia Market Y-o-Y Growth Rate Comparison by By Type (2016-2032)
- Figure 45: Western Europe Dysautonomia Market Y-o-Y Growth Rate Comparison by By End-User (2016-2032)
- Figure 46: Western Europe Dysautonomia Market Share Comparison by Country (2016-2032)
- Figure 47: Western Europe Dysautonomia Market Share Comparison by By Type (2016-2032)
- Figure 48: Western Europe Dysautonomia Market Share Comparison by By End-User (2016-2032)
- Figure 49: Eastern Europe Dysautonomia Market Revenue (US$ Mn) Market Share by By Typein 2022
- Figure 50: Eastern Europe Dysautonomia Market Attractiveness Analysis by By Type, 2016-2032
- Figure 51: Eastern Europe Dysautonomia Market Revenue (US$ Mn) Market Share by By End-Userin 2022
- Figure 52: Eastern Europe Dysautonomia Market Attractiveness Analysis by By End-User, 2016-2032
- Figure 53: Eastern Europe Dysautonomia Market Revenue (US$ Mn) Market Share by Country in 2022
- Figure 54: Eastern Europe Dysautonomia Market Attractiveness Analysis by Country, 2016-2032
- Figure 55: Eastern Europe Dysautonomia Market Revenue (US$ Mn) (2016-2032)
- Figure 56: Eastern Europe Dysautonomia Market Revenue (US$ Mn) Comparison by Country (2016-2032)
- Figure 57: Eastern Europe Dysautonomia Market Revenue (US$ Mn) Comparison by By Type (2016-2032)
- Figure 58: Eastern Europe Dysautonomia Market Revenue (US$ Mn) Comparison by By End-User (2016-2032)
- Figure 59: Eastern Europe Dysautonomia Market Y-o-Y Growth Rate Comparison by Country (2016-2032)
- Figure 60: Eastern Europe Dysautonomia Market Y-o-Y Growth Rate Comparison by By Type (2016-2032)
- Figure 61: Eastern Europe Dysautonomia Market Y-o-Y Growth Rate Comparison by By End-User (2016-2032)
- Figure 62: Eastern Europe Dysautonomia Market Share Comparison by Country (2016-2032)
- Figure 63: Eastern Europe Dysautonomia Market Share Comparison by By Type (2016-2032)
- Figure 64: Eastern Europe Dysautonomia Market Share Comparison by By End-User (2016-2032)
- Figure 65: APAC Dysautonomia Market Revenue (US$ Mn) Market Share by By Typein 2022
- Figure 66: APAC Dysautonomia Market Attractiveness Analysis by By Type, 2016-2032
- Figure 67: APAC Dysautonomia Market Revenue (US$ Mn) Market Share by By End-Userin 2022
- Figure 68: APAC Dysautonomia Market Attractiveness Analysis by By End-User, 2016-2032
- Figure 69: APAC Dysautonomia Market Revenue (US$ Mn) Market Share by Country in 2022
- Figure 70: APAC Dysautonomia Market Attractiveness Analysis by Country, 2016-2032
- Figure 71: APAC Dysautonomia Market Revenue (US$ Mn) (2016-2032)
- Figure 72: APAC Dysautonomia Market Revenue (US$ Mn) Comparison by Country (2016-2032)
- Figure 73: APAC Dysautonomia Market Revenue (US$ Mn) Comparison by By Type (2016-2032)
- Figure 74: APAC Dysautonomia Market Revenue (US$ Mn) Comparison by By End-User (2016-2032)
- Figure 75: APAC Dysautonomia Market Y-o-Y Growth Rate Comparison by Country (2016-2032)
- Figure 76: APAC Dysautonomia Market Y-o-Y Growth Rate Comparison by By Type (2016-2032)
- Figure 77: APAC Dysautonomia Market Y-o-Y Growth Rate Comparison by By End-User (2016-2032)
- Figure 78: APAC Dysautonomia Market Share Comparison by Country (2016-2032)
- Figure 79: APAC Dysautonomia Market Share Comparison by By Type (2016-2032)
- Figure 80: APAC Dysautonomia Market Share Comparison by By End-User (2016-2032)
- Figure 81: Latin America Dysautonomia Market Revenue (US$ Mn) Market Share by By Typein 2022
- Figure 82: Latin America Dysautonomia Market Attractiveness Analysis by By Type, 2016-2032
- Figure 83: Latin America Dysautonomia Market Revenue (US$ Mn) Market Share by By End-Userin 2022
- Figure 84: Latin America Dysautonomia Market Attractiveness Analysis by By End-User, 2016-2032
- Figure 85: Latin America Dysautonomia Market Revenue (US$ Mn) Market Share by Country in 2022
- Figure 86: Latin America Dysautonomia Market Attractiveness Analysis by Country, 2016-2032
- Figure 87: Latin America Dysautonomia Market Revenue (US$ Mn) (2016-2032)
- Figure 88: Latin America Dysautonomia Market Revenue (US$ Mn) Comparison by Country (2016-2032)
- Figure 89: Latin America Dysautonomia Market Revenue (US$ Mn) Comparison by By Type (2016-2032)
- Figure 90: Latin America Dysautonomia Market Revenue (US$ Mn) Comparison by By End-User (2016-2032)
- Figure 91: Latin America Dysautonomia Market Y-o-Y Growth Rate Comparison by Country (2016-2032)
- Figure 92: Latin America Dysautonomia Market Y-o-Y Growth Rate Comparison by By Type (2016-2032)
- Figure 93: Latin America Dysautonomia Market Y-o-Y Growth Rate Comparison by By End-User (2016-2032)
- Figure 94: Latin America Dysautonomia Market Share Comparison by Country (2016-2032)
- Figure 95: Latin America Dysautonomia Market Share Comparison by By Type (2016-2032)
- Figure 96: Latin America Dysautonomia Market Share Comparison by By End-User (2016-2032)
- Figure 97: Middle East & Africa Dysautonomia Market Revenue (US$ Mn) Market Share by By Typein 2022
- Figure 98: Middle East & Africa Dysautonomia Market Attractiveness Analysis by By Type, 2016-2032
- Figure 99: Middle East & Africa Dysautonomia Market Revenue (US$ Mn) Market Share by By End-Userin 2022
- Figure 100: Middle East & Africa Dysautonomia Market Attractiveness Analysis by By End-User, 2016-2032
- Figure 101: Middle East & Africa Dysautonomia Market Revenue (US$ Mn) Market Share by Country in 2022
- Figure 102: Middle East & Africa Dysautonomia Market Attractiveness Analysis by Country, 2016-2032
- Figure 103: Middle East & Africa Dysautonomia Market Revenue (US$ Mn) (2016-2032)
- Figure 104: Middle East & Africa Dysautonomia Market Revenue (US$ Mn) Comparison by Country (2016-2032)
- Figure 105: Middle East & Africa Dysautonomia Market Revenue (US$ Mn) Comparison by By Type (2016-2032)
- Figure 106: Middle East & Africa Dysautonomia Market Revenue (US$ Mn) Comparison by By End-User (2016-2032)
- Figure 107: Middle East & Africa Dysautonomia Market Y-o-Y Growth Rate Comparison by Country (2016-2032)
- Figure 108: Middle East & Africa Dysautonomia Market Y-o-Y Growth Rate Comparison by By Type (2016-2032)
- Figure 109: Middle East & Africa Dysautonomia Market Y-o-Y Growth Rate Comparison by By End-User (2016-2032)
- Figure 110: Middle East & Africa Dysautonomia Market Share Comparison by Country (2016-2032)
- Figure 111: Middle East & Africa Dysautonomia Market Share Comparison by By Type (2016-2032)
- Figure 112: Middle East & Africa Dysautonomia Market Share Comparison by By End-User (2016-2032)
- List of Tables
- Table 1: Global Dysautonomia Market Comparison by By Type (2016-2032)
- Table 2: Global Dysautonomia Market Comparison by By End-User (2016-2032)
- Table 3: Global Dysautonomia Market Revenue (US$ Mn) Comparison by Region (2016-2032)
- Table 4: Global Dysautonomia Market Revenue (US$ Mn) (2016-2032)
- Table 5: Global Dysautonomia Market Revenue (US$ Mn) Comparison by Region (2016-2032)
- Table 6: Global Dysautonomia Market Revenue (US$ Mn) Comparison by By Type (2016-2032)
- Table 7: Global Dysautonomia Market Revenue (US$ Mn) Comparison by By End-User (2016-2032)
- Table 8: Global Dysautonomia Market Y-o-Y Growth Rate Comparison by Region (2016-2032)
- Table 9: Global Dysautonomia Market Y-o-Y Growth Rate Comparison by By Type (2016-2032)
- Table 10: Global Dysautonomia Market Y-o-Y Growth Rate Comparison by By End-User (2016-2032)
- Table 11: Global Dysautonomia Market Share Comparison by Region (2016-2032)
- Table 12: Global Dysautonomia Market Share Comparison by By Type (2016-2032)
- Table 13: Global Dysautonomia Market Share Comparison by By End-User (2016-2032)
- Table 14: North America Dysautonomia Market Comparison by By End-User (2016-2032)
- Table 15: North America Dysautonomia Market Revenue (US$ Mn) Comparison by Country (2016-2032)
- Table 16: North America Dysautonomia Market Revenue (US$ Mn) (2016-2032)
- Table 17: North America Dysautonomia Market Revenue (US$ Mn) Comparison by Country (2016-2032)
- Table 18: North America Dysautonomia Market Revenue (US$ Mn) Comparison by By Type (2016-2032)
- Table 19: North America Dysautonomia Market Revenue (US$ Mn) Comparison by By End-User (2016-2032)
- Table 20: North America Dysautonomia Market Y-o-Y Growth Rate Comparison by Country (2016-2032)
- Table 21: North America Dysautonomia Market Y-o-Y Growth Rate Comparison by By Type (2016-2032)
- Table 22: North America Dysautonomia Market Y-o-Y Growth Rate Comparison by By End-User (2016-2032)
- Table 23: North America Dysautonomia Market Share Comparison by Country (2016-2032)
- Table 24: North America Dysautonomia Market Share Comparison by By Type (2016-2032)
- Table 25: North America Dysautonomia Market Share Comparison by By End-User (2016-2032)
- Table 26: Western Europe Dysautonomia Market Comparison by By Type (2016-2032)
- Table 27: Western Europe Dysautonomia Market Comparison by By End-User (2016-2032)
- Table 28: Western Europe Dysautonomia Market Revenue (US$ Mn) Comparison by Country (2016-2032)
- Table 29: Western Europe Dysautonomia Market Revenue (US$ Mn) (2016-2032)
- Table 30: Western Europe Dysautonomia Market Revenue (US$ Mn) Comparison by Country (2016-2032)
- Table 31: Western Europe Dysautonomia Market Revenue (US$ Mn) Comparison by By Type (2016-2032)
- Table 32: Western Europe Dysautonomia Market Revenue (US$ Mn) Comparison by By End-User (2016-2032)
- Table 33: Western Europe Dysautonomia Market Y-o-Y Growth Rate Comparison by Country (2016-2032)
- Table 34: Western Europe Dysautonomia Market Y-o-Y Growth Rate Comparison by By Type (2016-2032)
- Table 35: Western Europe Dysautonomia Market Y-o-Y Growth Rate Comparison by By End-User (2016-2032)
- Table 36: Western Europe Dysautonomia Market Share Comparison by Country (2016-2032)
- Table 37: Western Europe Dysautonomia Market Share Comparison by By Type (2016-2032)
- Table 38: Western Europe Dysautonomia Market Share Comparison by By End-User (2016-2032)
- Table 39: Eastern Europe Dysautonomia Market Comparison by By Type (2016-2032)
- Table 40: Eastern Europe Dysautonomia Market Comparison by By End-User (2016-2032)
- Table 41: Eastern Europe Dysautonomia Market Revenue (US$ Mn) Comparison by Country (2016-2032)
- Table 42: Eastern Europe Dysautonomia Market Revenue (US$ Mn) (2016-2032)
- Table 43: Eastern Europe Dysautonomia Market Revenue (US$ Mn) Comparison by Country (2016-2032)
- Table 44: Eastern Europe Dysautonomia Market Revenue (US$ Mn) Comparison by By Type (2016-2032)
- Table 45: Eastern Europe Dysautonomia Market Revenue (US$ Mn) Comparison by By End-User (2016-2032)
- Table 46: Eastern Europe Dysautonomia Market Y-o-Y Growth Rate Comparison by Country (2016-2032)
- Table 47: Eastern Europe Dysautonomia Market Y-o-Y Growth Rate Comparison by By Type (2016-2032)
- Table 48: Eastern Europe Dysautonomia Market Y-o-Y Growth Rate Comparison by By End-User (2016-2032)
- Table 49: Eastern Europe Dysautonomia Market Share Comparison by Country (2016-2032)
- Table 50: Eastern Europe Dysautonomia Market Share Comparison by By Type (2016-2032)
- Table 51: Eastern Europe Dysautonomia Market Share Comparison by By End-User (2016-2032)
- Table 52: APAC Dysautonomia Market Comparison by By Type (2016-2032)
- Table 53: APAC Dysautonomia Market Comparison by By End-User (2016-2032)
- Table 54: APAC Dysautonomia Market Revenue (US$ Mn) Comparison by Country (2016-2032)
- Table 55: APAC Dysautonomia Market Revenue (US$ Mn) (2016-2032)
- Table 56: APAC Dysautonomia Market Revenue (US$ Mn) Comparison by Country (2016-2032)
- Table 57: APAC Dysautonomia Market Revenue (US$ Mn) Comparison by By Type (2016-2032)
- Table 58: APAC Dysautonomia Market Revenue (US$ Mn) Comparison by By End-User (2016-2032)
- Table 59: APAC Dysautonomia Market Y-o-Y Growth Rate Comparison by Country (2016-2032)
- Table 60: APAC Dysautonomia Market Y-o-Y Growth Rate Comparison by By Type (2016-2032)
- Table 61: APAC Dysautonomia Market Y-o-Y Growth Rate Comparison by By End-User (2016-2032)
- Table 62: APAC Dysautonomia Market Share Comparison by Country (2016-2032)
- Table 63: APAC Dysautonomia Market Share Comparison by By Type (2016-2032)
- Table 64: APAC Dysautonomia Market Share Comparison by By End-User (2016-2032)
- Table 65: Latin America Dysautonomia Market Comparison by By Type (2016-2032)
- Table 66: Latin America Dysautonomia Market Comparison by By End-User (2016-2032)
- Table 67: Latin America Dysautonomia Market Revenue (US$ Mn) Comparison by Country (2016-2032)
- Table 68: Latin America Dysautonomia Market Revenue (US$ Mn) (2016-2032)
- Table 69: Latin America Dysautonomia Market Revenue (US$ Mn) Comparison by Country (2016-2032)
- Table 70: Latin America Dysautonomia Market Revenue (US$ Mn) Comparison by By Type (2016-2032)
- Table 71: Latin America Dysautonomia Market Revenue (US$ Mn) Comparison by By End-User (2016-2032)
- Table 72: Latin America Dysautonomia Market Y-o-Y Growth Rate Comparison by Country (2016-2032)
- Table 73: Latin America Dysautonomia Market Y-o-Y Growth Rate Comparison by By Type (2016-2032)
- Table 74: Latin America Dysautonomia Market Y-o-Y Growth Rate Comparison by By End-User (2016-2032)
- Table 75: Latin America Dysautonomia Market Share Comparison by Country (2016-2032)
- Table 76: Latin America Dysautonomia Market Share Comparison by By Type (2016-2032)
- Table 77: Latin America Dysautonomia Market Share Comparison by By End-User (2016-2032)
- Table 78: Middle East & Africa Dysautonomia Market Comparison by By Type (2016-2032)
- Table 79: Middle East & Africa Dysautonomia Market Comparison by By End-User (2016-2032)
- Table 80: Middle East & Africa Dysautonomia Market Revenue (US$ Mn) Comparison by Country (2016-2032)
- Table 81: Middle East & Africa Dysautonomia Market Revenue (US$ Mn) (2016-2032)
- Table 82: Middle East & Africa Dysautonomia Market Revenue (US$ Mn) Comparison by Country (2016-2032)
- Table 83: Middle East & Africa Dysautonomia Market Revenue (US$ Mn) Comparison by By Type (2016-2032)
- Table 84: Middle East & Africa Dysautonomia Market Revenue (US$ Mn) Comparison by By End-User (2016-2032)
- Table 85: Middle East & Africa Dysautonomia Market Y-o-Y Growth Rate Comparison by Country (2016-2032)
- Table 86: Middle East & Africa Dysautonomia Market Y-o-Y Growth Rate Comparison by By Type (2016-2032)
- Table 87: Middle East & Africa Dysautonomia Market Y-o-Y Growth Rate Comparison by By End-User (2016-2032)
- Table 88: Middle East & Africa Dysautonomia Market Share Comparison by Country (2016-2032)
- Table 89: Middle East & Africa Dysautonomia Market Share Comparison by By Type (2016-2032)
- Table 90: Middle East & Africa Dysautonomia Market Share Comparison by By End-User (2016-2032)
- 1. Executive Summary
-
- Novartis AG
- Axsome Therapeutics
- Shire
- Pfizer Inc
- Lundbeck
- Celltex Therapeutics
- Theravance Biopharma
- Santhera Pharmaceuticals
- Merck & Co. Inc.
- Other
Our Clients


View Our Licence Options
