
Dry Construction Market By Type(Supporting framework, Boarding), By Material(Plaster board, Wood, Others) By Application(Residential, Non-residential), By System(Wall, Ceiling, Others), By Region And Companies - Industry Segment Outlook, Market Assessment, Competition Scenario, Trends, And Forecast 2023-2032
-
7554
-
Jul 2023
-
153
-


-
This report was compiled by Kalyani Khudsange Kalyani Khudsange is a Research Analyst at Prudour Pvt. Ltd. with 2.5 years of experience in market research and a strong technical background in Chemical Engineering and manufacturing. Correspondence Sr. Research Analyst Linkedin | Detailed Market research Methodology Our methodology involves a mix of primary research, including interviews with leading mental health experts, and secondary research from reputable medical journals and databases. View Detailed Methodology Page
-
Quick Navigation
Report Overview
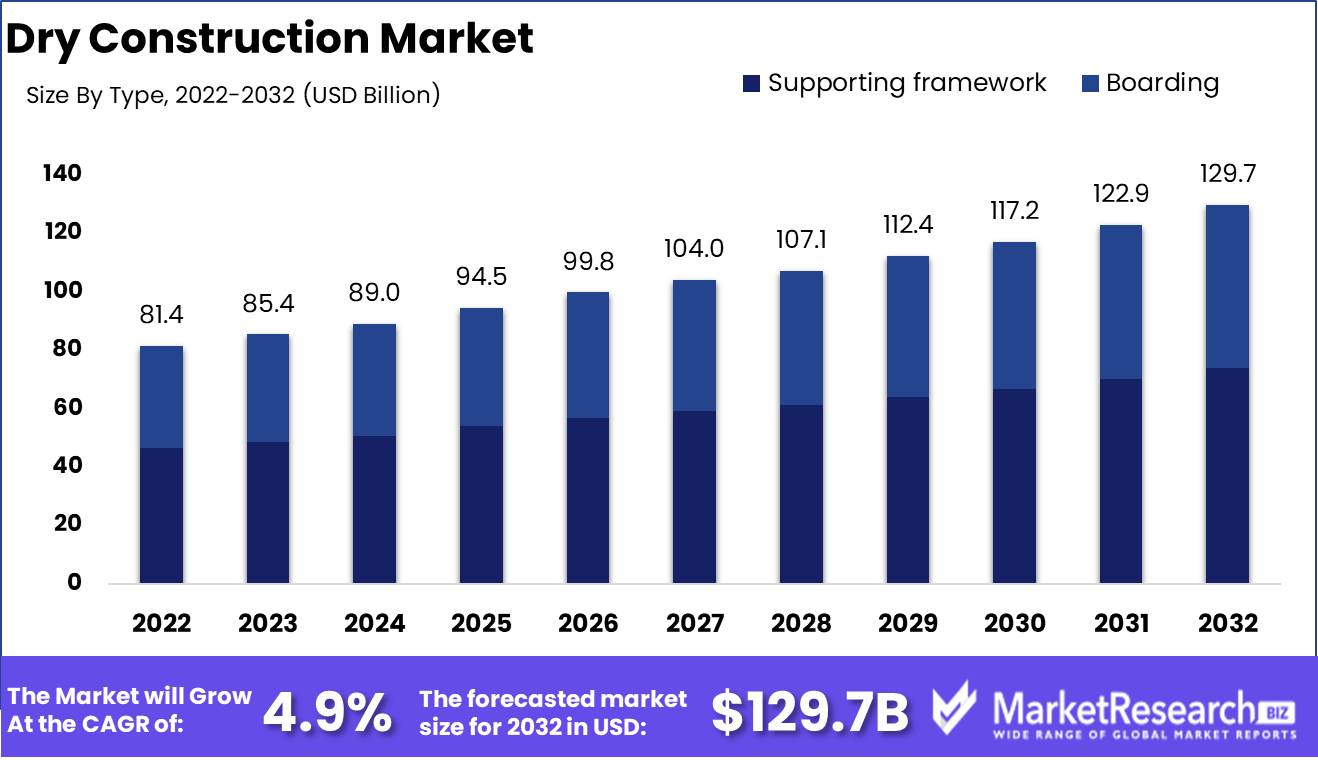
Dry Construction Market size is expected to be worth around USD 129.7 Bn by 2032 from USD 81.4 Bn in 2022, growing at a CAGR of 4.9% during the forecast period from 2023 to 2032.
The comprehensive report on the dry construction market provides an insightful analysis of the market's growth and its influence on the industry as a whole. The report concentrates on key aspects such as market size, major players, and their innovative efforts in developing new products and services, as well as a comprehensive analysis of current and future trends, drivers, opportunities, and challenges.
Dry construction is an ingenious and cost-effective building and installation method. With urbanization and population growth on the rise, traditional construction techniques have become less effective, costly, and time-consuming. Dry construction employs sustainable and simple-to-install materials, making it the preferred method for building projects. The primary objective of dry construction is to develop eco-friendly, lightweight building materials that accelerate construction processes, reduce costs, and promote sustainability.
The adaptability and effectiveness of dry construction make it ideal for contemporary and sustainable building practices. It provides numerous benefits, including speed, cost savings, increased safety, and simple maintenance. In addition, dry construction has a smaller carbon footprint and generates less waste than traditional construction methods.
In recent years, the dry construction market has seen significant innovation as manufacturers have sought to increase construction efficiency and reduce waste. Notable innovations include modular construction, precast concrete and drywall techniques, acoustic barriers, and ultralightweight divider walls.
Major companies in the construction materials industry, such as LafargeHolcim, Saint-Gobain, and Knauf, have incorporated dry construction into their product lines after recognizing its potential. This integration has accelerated the growth and prominence of the market. Sustainability, eco-friendliness, and cost-effectiveness are gaining traction in the construction industry, driving consistent growth in the dry construction market. Dry construction has applications in residential and commercial construction projects, including buildings, apartments, offices, schools, and healthcare facilities, among others.
Driving factors
Increasing urbanization and population growth
As cities continue to grow and populations increase, the demand for new housing and infrastructure increases. Traditional construction methods frequently struggle to keep up with the required velocity to satisfy these demands. The manufacturing of building components off-site is a component of these methods, allowing for concurrent construction activities. This serves to meet the increasing demand for urban construction projects.
Cost-effectiveness and time efficiency
The production of prefabricated components in controlled factory environments reduces labor costs and material waste. In addition, the assembly of prefabricated elements on-site is faster and more efficient than in conventional construction. The reduced construction time results in cost reductions for developers and contractors, which makes dry construction an attractive option for projects with limited budgets and strict deadlines.
Durability and environmental concerns
The pressure to implement sustainable and environmentally friendly practices has been increasing in the construction industry. Dry construction corresponds with these concerns by minimizing waste production, decreasing energy consumption, and maximizing resource efficiency. Prefabricated components are produced using precise manufacturing processes that help reduce material waste. Additionally, the ability to optimize insulation and energy efficiency during the manufacturing phase contributes to long-term energy conservation. As developers place a greater emphasis on sustainability, dry construction methods acquire market share.
Technological advancements and innovation
The market for dry construction is significantly driven by technological advancements. The industry has been revolutionized by innovations such as 3D printing, autonomous automation, and Building Information Modeling (BIM). With 3D printing, it is possible to create complex, customized building components with minimal material waste. Robotic automation streamlines manufacturing processes, thereby increasing precision and output. BIM facilitates digital collaboration, thereby enhancing project coordination and minimizing errors. These advancements improve the efficiency and quality of dry construction, attracting stakeholders who value cutting-edge technology and innovation.
Flexibility and design possibilities
Compared to conventional construction, dry construction methods offer more latitude and design options. The ability to customize a product is a major factor in the success of any business. Complex shapes and intricate details are now simple to attain thanks to advancements in manufacturing techniques. This adaptability appeals to architects, designers, and clients who value creative license and individualized designs. Its market demand is bolstered by the capability of constructing visually remarkable structures using dry construction methods.
Restraining Factors
Lack of Skilled Workers and Specialized Contractors
The lack of skilled workers and specialized contractors is one of the greatest obstacles facing the dry construction market. Due to the use of prefabricated components in dry construction, workers must possess specific abilities to assemble them accurately and efficiently. Nevertheless, the industry confronts a unique challenge due to the dearth of trained workers and contractors in this field.
It is essential to invest in training and skill development programs to overcome this challenge. The industry and educational institutions can collaborate to provide courses and apprenticeships in dry construction techniques. In addition to providing on-the-job training and offering attractive incentives, businesses can attract and retain competent workers.
Inadequate Funding for Dry-Construction Projects
Inadequate funding for dry construction projects is another significant challenge confronted by dry construction companies. Dry construction requires the use of specialized components and equipment, which can make it more expensive than traditional construction methods. This can result in projects being underfunded or even abandoned in the middle of their completion.
To mitigate this challenge, the construction industry must promote the benefits of dry construction to investors and government agencies. Additionally, businesses can collaborate with financial institutions to provide specialized funding and investment programs for dry construction. Governments can also encourage dry construction by offering tax rebates and other financial incentives to investors and contractors.
Type Analysis
The adoption of the Supporting framework Segment is rapidly increasing in the dry construction market. This segment dominates the market as a result of its superior structural properties and sturdiness. In addition, it is commonly used for walls, ceilings, and floors, making it an adaptable material for contemporary construction projects.
Due to their swiftly expanding real estate sectors, emerging economies such as India, China, and Brazil are driving the adoption of the Supporting framework Segment. The increased demand for affordable housing in these nations has led to an increase in construction activity. As the Supporting Framework Segment is readily accessible and inexpensive, it has become a popular option among builders and developers.
Due to its energy efficiency and eco-friendliness, consumer trends indicate a growing preference for the Supporting framework Segment. As the importance of sustainability in the construction industry grows, the Supporting framework Segment provides an excellent method for reducing carbon footprint and energy consumption.
Material Analysis
Due to its superior fire resistance and outstanding sound insulation qualities, the Plasterboard Segment dominates the dry construction market. It is commonly used for partition walls, ceilings, and artificial ceilings, making it a versatile material for contemporary building projects.
In these nations, the demand for residential and commercial space is rising rapidly, and the Plasterboard Segment provides an excellent solution for expedient construction.
Consumer trends indicate an increasing preference for the Plasterboard Segment as a result of its aesthetic appeal and usability. Plasterboard Segment has become a popular choice among householders and contractors as a result of its availability in a variety of styles and customizability options.
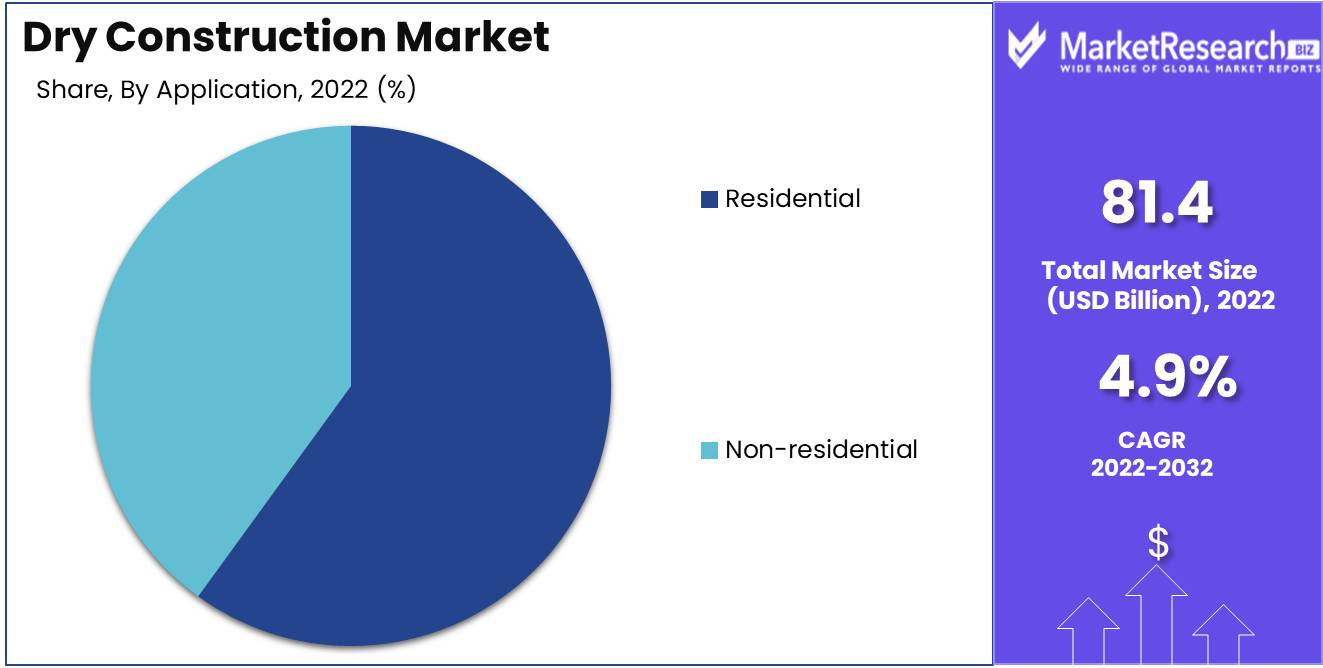
Application Analysis
Due to the growing demand for affordable housing and smart dwellings, the Residential Segment dominates the dry construction market. This segment provides a variety of options for homeowners, including eco-friendly options for sustainable living and lightweight construction materials for quick and efficient construction.
Due to the growing demand for affordable housing, emerging economies are propelling the adoption of the Residential Segment. As the rate of urbanization continues to increase, more people are migrating to cities, resulting in tremendous housing demand. The Residential Segment provides an excellent solution for affordable and environmentally friendly housing options.
Due to the growing demand for energy-efficient and eco-friendly living spaces, consumer trends indicate a growing preference for Residential segments. As a result of the availability of intelligent home technologies and energy-efficient building materials, the Residential Segment has become a popular option among homeowners.
Key Market Segments
By Type
- Supporting framework
- Boarding
By Material
- Plasterboard
- Wood
- Metals
- Plastic
- Glass
- Carpet
By Application
- Residential
- Non-residential
By System
- Wall
- Ceiling
- Flooring
- Windows
- Partition
- Door systems
Growth Opportunity
Rise in Prefabrication and Modular Construction
In the dry construction market, prefabrication and modular construction techniques are acquiring popularity. These techniques involve the assembly of building components off-site, which increases efficiency and shortens the duration of construction. The advantages of prefabrication include cost savings, improved quality control, and reduced environmental impact.
Increasing Adoption of Sustainable Material
There is a notable transition towards the use of sustainable materials in dry construction as environmental consciousness grows. Eco-friendly alternatives such as recycled materials, low VOC (volatile organic compound) products, and renewable resources like bamboo and cork are favored by architects and contractors. The desire to reduce carbon footprints and create healthier indoor environments is driving this trend.
BIM (Building Information Modeling) development.
Building Information Modeling (BIM) is revolutionizing the industry of dry construction. BIM technology enables digital modeling and coordination of construction projects, thereby facilitating architects', engineers', and contractors' collaboration. It increases project efficiency, decreases errors, and facilitates improved decision-making. Additionally, BIM simplifies the integration of prefabricated components and construction processes.
Increasing Interest in Acoustic Solutions
In urban areas, noise pollution is a major concern, resulting in an increased demand for acoustic solutions in dry construction. Builders and developers are employing soundproofing materials and technologies to create indoor spaces that are quieter and more comfortable. This trend is most pronounced in residential buildings, educational institutions, healthcare facilities, and commercial spaces where noise reduction is essential.
Importance of Energy Efficiency
In the dry construction market, energy efficiency is a primary focus. As building codes and regulations become more stringent, the demand for energy-efficient solutions to reduce energy consumption and operational costs increases. The use of dry construction techniques improves insulation, airtightness, and thermal performance. To meet sustainability goals and enhance overall building performance, builders are incorporating energy-efficient materials such as high-performance insulation, LED lighting systems, and smart HVAC (heating, ventilation, and air conditioning) controls.
Latest Trends
Need for Rapid, Cost-Effective Construction Techniques
The pressure on construction professionals to complete projects quicker and more cost-effectively is increasing. Traditional methods of construction cannot always satisfy these requirements. Consequently, construction companies and contractors are employing dry construction methods. Using off-site manufacturing and prefabricated building components, this strategy streamlines the construction process, improves quality control, and reduces the need for on-site labor. Dry construction is also environmentally friendly because it uses less waste and energy.
Focus on environmentally responsible building practices
The construction industry is becoming increasingly concerned with sustainability. Increasing awareness of environmental issues drives demand for environmentally friendly building solutions. Dry construction methods are inherently more sustainable than traditional methods because they use fewer materials and produce less debris. In addition, there has been an increase in the use of eco-friendly materials, such as recycled content, verdant roofs, and energy-efficient insulation systems.
Demand for modular and prefabricated building components is increasing.
Modular construction is a prevalent method of dry construction that employs off-site manufacturing to produce transportable, prefabricated building components. This method has numerous advantages, including shorter construction schedules, improved cost management, and higher-quality finishes. Having said that, it's important to note that the majority of the time, the majority of the time, the majority of the time, the majority of the time.
Skilled Labor Shortage in the Construction Industry
The construction industry has been experiencing a labor shortage for some time. This shortage makes it challenging for contractors to finish projects on time and within budget. Dry construction methods are an effective solution to this issue, as they require fewer employees and improve productivity. In addition, modular construction can be readily automated, meaning fewer workers are required to complete building projects.
Changing Building Codes and Regulations
Changing building regulations and codes present difficulties for construction professionals. Dry construction methods are well-positioned to acclimate to these changes because they are more adaptable and customizable than traditional methods. In addition, the use of eco-friendly materials and energy-efficient systems can assist buildings in complying with new regulations and codes.
Regional Analysis
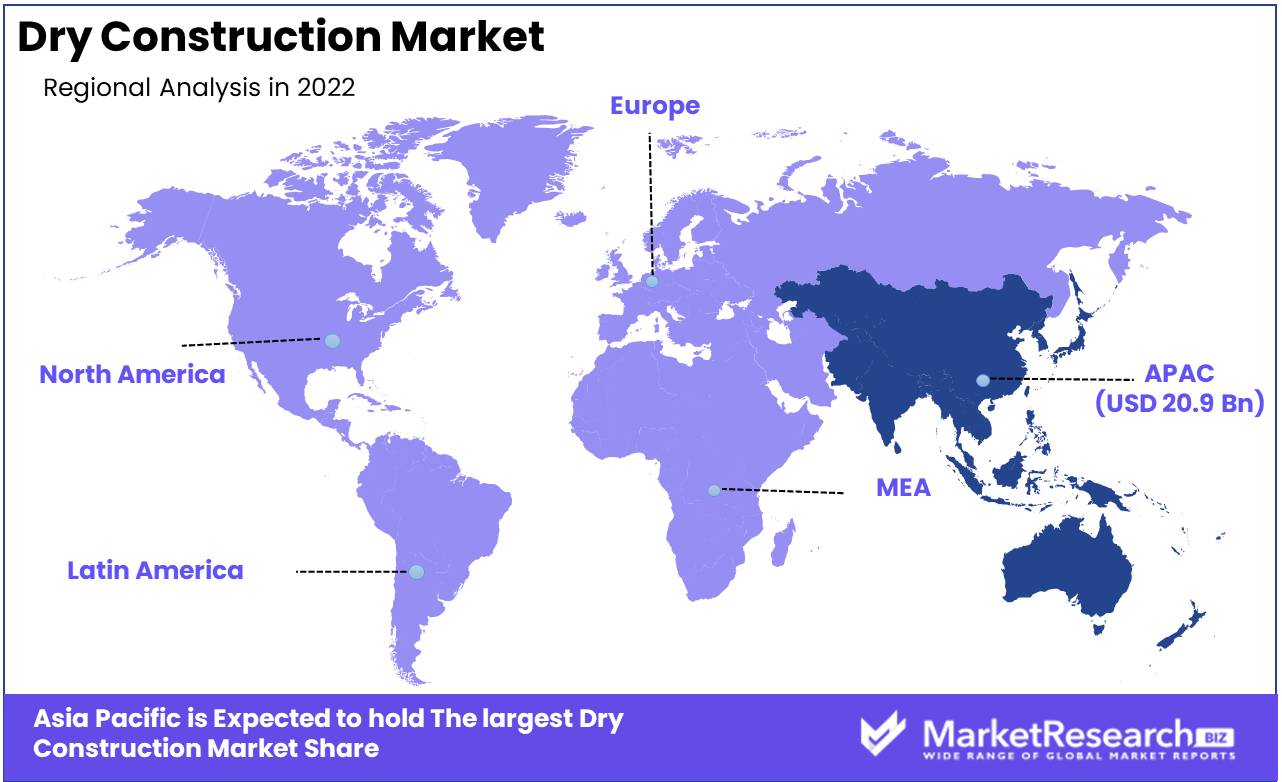
Asia-Pacific dominates the worldwide dry construction market
Due to its numerous advantages over conventional building techniques, the market for dry construction has experienced significant growth and adoption over the years. Dry construction is the on-site assembly of prefabricated building components, such as gypsum boards, metal frames, and insulation materials. Compared to conventional construction techniques, dry construction offers several advantages, including a shorter construction period, decreased waste, and enhanced environmental sustainability.
Rapid population development and urbanization in countries such as China and India are among the primary factors that have contributed to the rise of dry construction in the Asia-Pacific region. The demand for quicker and more efficient construction methods has increased due to the need for more affordable housing options. Dry construction is a viable solution to these demands because it substantially reduces construction time and costs.
Another factor is the region's emphasis on eco-friendly solutions and sustainability. Dry construction offers a more sustainable and eco-friendly alternative to conventional construction methods as concerns about their environmental impact grow. The Asia-Pacific region has adopted these solutions rapidly, with governments implementing policies and regulations that encourage their use.
Key Regions and Countries
North America
- US
- Canada
- Mexico
Western Europe
- Germany
- France
- The UK
- Spain
- Italy
- Portugal
- Ireland
- Austria
- Switzerland
- Benelux
- Nordic
- Rest of Western Europe
Eastern Europe
- Russia
- Poland
- The Czech Republic
- Greece
- Rest of Eastern Europe
APAC
- China
- Japan
- South Korea
- India
- Australia & New Zealand
- Indonesia
- Malaysia
- Philippines
- Singapore
- Thailand
- Vietnam
- Rest of APAC
Latin America
- Brazil
- Colombia
- Chile
- Argentina
- Costa Rica
- Rest of Latin America
Middle East & Africa
- Algeria
- Egypt
- Israel
- Kuwait
- Nigeria
- Saudi Arabia
- South Africa
- Turkey
- United Arab Emirates
- Rest of MEA
Key Players Analysis
The dry construction market has grown consistently over the past few years, and this trend will continue. This has led to the emergence of a number of market leaders, each of whom plays an essential role in expanding the market and meeting the rising demand for dry construction techniques.
Knauf is a German company that specializes in the design and production of construction materials including drywall systems, ceiling systems, and accessories. The company is well-known for its innovative products and superior services and has a significant global presence.
Saint-Gobain is a French multinational corporation that specializes in the production and distribution of materials for the construction, industrial, and consumer markets. Plasterboards, jointing and finishing compounds, and gypsum plasters are among the dry construction products offered by the company.
USG Corporation is another significant participant in the dry construction market. The American company is well-known for its innovative products and unique solutions, such as soundproofing and moisture-resistant drywalls. USG is well-known in North America and Europe for its commitment to sustainability and environmentally favorable business practices.
Other prominent participants in the dry construction market include Armstrong World Industries, British Gypsum, LafargeHolcim, and National Gypsum Company. Because they are known for their high-quality products and services, these companies are anticipated to play a significant role in the growth of the dry construction market in the coming years.
Top Key Players in Dry Construction Market
- Panel Rey
- Etex Group
- Saint Gobain
- Pabco Gypsum
- Armstrong World Industries
- Knauf, CSR Ltd.
- Xella Group
- Fletcher Building
- USG Boral
- Georgia-Pacific Wood Products
Recent Development
- In 2021, The foremost manufacturer of building materials, USG Corporation, has introduced innovative drywall products with enhanced fire resistance and soundproofing properties. These innovations serve the construction industry's growing demand for safer and more efficient building materials.
- In 2022, Armstrong World Industries, a leading provider of ceiling and wall solutions, has introduced a new line of modular wall systems that are designed for simple installation. Faster construction and renovation projects are made possible by these systems' incorporation of sustainable materials and increased flexibility.
- In 2023, The world's leading provider of construction materials, Saint-Gobain, has introduced a new generation of high-performance, energy-efficient, and environmentally friendly products. These products improve the energy efficiency of buildings, thereby reducing heating and cooling costs and fostering sustainable construction practices.
- In 2023, Knauf, an industry leader in dry construction systems, has introduced an innovative digital platform that incorporates Building Information Modeling (BIM) technology with their product offerings. This platform facilitates improved project coordination, simplifies communication, and increases overall construction productivity.
Report Scope
Report Features Description Market Value (2022) USD 81.4 Bn Forecast Revenue (2032) USD 129.7 Bn CAGR (2023-2032) 4.9% Base Year for Estimation 2022 Historic Period 2016-2022 Forecast Period 2023-2032 Report Coverage Revenue Forecast, Market Dynamics, COVID-19 Impact, Competitive Landscape, Recent Developments Segments Covered By Type (Supporting framework, Boarding), By Material(Plasterboard, Wood, Metals), By Application(Residential, Non-residential), By System (Wall, Ceiling, Others) Regional Analysis North America – The US, Canada, & Mexico; Western Europe – Germany, France, The UK, Spain, Italy, Portugal, Ireland, Austria, Switzerland, Benelux, Nordic, & Rest of Western Europe; Eastern Europe – Russia, Poland, The Czech Republic, Greece, & Rest of Eastern Europe; APAC – China, Japan, South Korea, India, Australia & New Zealand, Indonesia, Malaysia, Philippines, Singapore, Thailand, Vietnam, & Rest of APAC; Latin America – Brazil, Colombia, Chile, Argentina, Costa Rica, & Rest of Latin America; Middle East & Africa – Algeria, Egypt, Israel, Kuwait, Nigeria, Saudi Arabia, South Africa, Turkey, United Arab Emirates, & Rest of MEA Competitive Landscape Panel Rey, Etex Group, Saint Gobain, Pabco Gypsum, Armstrong World Industries, Knauf, CSR Ltd., Xella Group, Fletcher Building, USG Boral, Georgia-Pacific Wood Products Customization Scope Customization for segments, region/country-level will be provided. Moreover, additional customization can be done based on the requirements. Purchase Options We have three licenses to opt for: Single User License, Multi-User License (Up to 5 Users), Corporate Use License (Unlimited User and Printable PDF) -
- 1. Executive Summary
- 1.1. Definition
- 1.2. Taxonomy
- 1.3. Research Scope
- 1.4. Key Analysis
- 1.5. Key Findings by Major Segments
- 1.6. Top strategies by Major Players
- 2. Global Dry Construction Market Overview
- 2.1. Dry Construction Market Dynamics
- 2.1.1. Drivers
- 2.1.2. Opportunities
- 2.1.3. Restraints
- 2.1.4. Challenges
- 2.2. Macro-economic Factors
- 2.3. Regulatory Framework
- 2.4. Market Investment Feasibility Index
- 2.5. PEST Analysis
- 2.6. PORTER’S Five Force Analysis
- 2.7. Drivers & Restraints Impact Analysis
- 2.8. Industry Chain Analysis
- 2.9. Cost Structure Analysis
- 2.10. Marketing Strategy
- 2.11. Russia-Ukraine War Impact Analysis
- 2.12. Opportunity Map Analysis
- 2.13. Market Competition Scenario Analysis
- 2.14. Product Life Cycle Analysis
- 2.15. Opportunity Orbits
- 2.16. Manufacturer Intensity Map
- 2.17. Major Companies sales by Value & Volume
- 2.1. Dry Construction Market Dynamics
- 3. Global Dry Construction Market Analysis, Opportunity and Forecast, 2016-2032
- 3.1. Global Dry Construction Market Analysis, 2016-2021
- 3.2. Global Dry Construction Market Opportunity and Forecast, 2023-2032
- 3.3. Global Dry Construction Market Analysis, Opportunity and Forecast, By By Type, 2016-2032
- 3.3.1. Global Dry Construction Market Analysis by By Type: Introduction
- 3.3.2. Market Size Absolute $ Opportunity Analysis and Forecast, By By Type, 2016-2032
- 3.3.3. Supporting framework
- 3.3.4. Boarding
- 3.4. Global Dry Construction Market Analysis, Opportunity and Forecast, By By Material, 2016-2032
- 3.4.1. Global Dry Construction Market Analysis by By Material: Introduction
- 3.4.2. Market Size Absolute $ Opportunity Analysis and Forecast, By By Material, 2016-2032
- 3.4.3. Plasterboard
- 3.4.4. Wood
- 3.4.5. Metals
- 3.4.6. Plastic
- 3.4.7. Glass
- 3.4.8. Carpet
- 3.5. Global Dry Construction Market Analysis, Opportunity and Forecast, By By Application, 2016-2032
- 3.5.1. Global Dry Construction Market Analysis by By Application: Introduction
- 3.5.2. Market Size Absolute $ Opportunity Analysis and Forecast, By By Application, 2016-2032
- 3.5.3. Residential
- 3.5.4. Non-residential
- 3.6. Global Dry Construction Market Analysis, Opportunity and Forecast, By By System, 2016-2032
- 3.6.1. Global Dry Construction Market Analysis by By System: Introduction
- 3.6.2. Market Size Absolute $ Opportunity Analysis and Forecast, By By System, 2016-2032
- 3.6.3. Wall
- 3.6.4. Ceiling
- 3.6.5. Flooring
- 3.6.6. Windows
- 3.6.7. Partition
- 3.6.8. Door systems
- 4. North America Dry Construction Market Analysis, Opportunity and Forecast, 2016-2032
- 4.1. North America Dry Construction Market Analysis, 2016-2021
- 4.2. North America Dry Construction Market Opportunity and Forecast, 2023-2032
- 4.3. North America Dry Construction Market Analysis, Opportunity and Forecast, By By Type, 2016-2032
- 4.3.1. North America Dry Construction Market Analysis by By Type: Introduction
- 4.3.2. Market Size Absolute $ Opportunity Analysis and Forecast, By By Type, 2016-2032
- 4.3.3. Supporting framework
- 4.3.4. Boarding
- 4.4. North America Dry Construction Market Analysis, Opportunity and Forecast, By By Material, 2016-2032
- 4.4.1. North America Dry Construction Market Analysis by By Material: Introduction
- 4.4.2. Market Size Absolute $ Opportunity Analysis and Forecast, By By Material, 2016-2032
- 4.4.3. Plasterboard
- 4.4.4. Wood
- 4.4.5. Metals
- 4.4.6. Plastic
- 4.4.7. Glass
- 4.4.8. Carpet
- 4.5. North America Dry Construction Market Analysis, Opportunity and Forecast, By By Application, 2016-2032
- 4.5.1. North America Dry Construction Market Analysis by By Application: Introduction
- 4.5.2. Market Size Absolute $ Opportunity Analysis and Forecast, By By Application, 2016-2032
- 4.5.3. Residential
- 4.5.4. Non-residential
- 4.6. North America Dry Construction Market Analysis, Opportunity and Forecast, By By System, 2016-2032
- 4.6.1. North America Dry Construction Market Analysis by By System: Introduction
- 4.6.2. Market Size Absolute $ Opportunity Analysis and Forecast, By By System, 2016-2032
- 4.6.3. Wall
- 4.6.4. Ceiling
- 4.6.5. Flooring
- 4.6.6. Windows
- 4.6.7. Partition
- 4.6.8. Door systems
- 4.7. North America Dry Construction Market Analysis, Opportunity and Forecast, By Country , 2016-2032
- 4.7.1. North America Dry Construction Market Analysis by Country : Introduction
- 4.7.2. Market Size Absolute $ Opportunity Analysis and Forecast, Country , 2016-2032
- 4.7.2.1. The US
- 4.7.2.2. Canada
- 4.7.2.3. Mexico
- 5. Western Europe Dry Construction Market Analysis, Opportunity and Forecast, 2016-2032
- 5.1. Western Europe Dry Construction Market Analysis, 2016-2021
- 5.2. Western Europe Dry Construction Market Opportunity and Forecast, 2023-2032
- 5.3. Western Europe Dry Construction Market Analysis, Opportunity and Forecast, By By Type, 2016-2032
- 5.3.1. Western Europe Dry Construction Market Analysis by By Type: Introduction
- 5.3.2. Market Size Absolute $ Opportunity Analysis and Forecast, By By Type, 2016-2032
- 5.3.3. Supporting framework
- 5.3.4. Boarding
- 5.4. Western Europe Dry Construction Market Analysis, Opportunity and Forecast, By By Material, 2016-2032
- 5.4.1. Western Europe Dry Construction Market Analysis by By Material: Introduction
- 5.4.2. Market Size Absolute $ Opportunity Analysis and Forecast, By By Material, 2016-2032
- 5.4.3. Plasterboard
- 5.4.4. Wood
- 5.4.5. Metals
- 5.4.6. Plastic
- 5.4.7. Glass
- 5.4.8. Carpet
- 5.5. Western Europe Dry Construction Market Analysis, Opportunity and Forecast, By By Application, 2016-2032
- 5.5.1. Western Europe Dry Construction Market Analysis by By Application: Introduction
- 5.5.2. Market Size Absolute $ Opportunity Analysis and Forecast, By By Application, 2016-2032
- 5.5.3. Residential
- 5.5.4. Non-residential
- 5.6. Western Europe Dry Construction Market Analysis, Opportunity and Forecast, By By System, 2016-2032
- 5.6.1. Western Europe Dry Construction Market Analysis by By System: Introduction
- 5.6.2. Market Size Absolute $ Opportunity Analysis and Forecast, By By System, 2016-2032
- 5.6.3. Wall
- 5.6.4. Ceiling
- 5.6.5. Flooring
- 5.6.6. Windows
- 5.6.7. Partition
- 5.6.8. Door systems
- 5.7. Western Europe Dry Construction Market Analysis, Opportunity and Forecast, By Country , 2016-2032
- 5.7.1. Western Europe Dry Construction Market Analysis by Country : Introduction
- 5.7.2. Market Size Absolute $ Opportunity Analysis and Forecast, Country , 2016-2032
- 5.7.2.1. Germany
- 5.7.2.2. France
- 5.7.2.3. The UK
- 5.7.2.4. Spain
- 5.7.2.5. Italy
- 5.7.2.6. Portugal
- 5.7.2.7. Ireland
- 5.7.2.8. Austria
- 5.7.2.9. Switzerland
- 5.7.2.10. Benelux
- 5.7.2.11. Nordic
- 5.7.2.12. Rest of Western Europe
- 6. Eastern Europe Dry Construction Market Analysis, Opportunity and Forecast, 2016-2032
- 6.1. Eastern Europe Dry Construction Market Analysis, 2016-2021
- 6.2. Eastern Europe Dry Construction Market Opportunity and Forecast, 2023-2032
- 6.3. Eastern Europe Dry Construction Market Analysis, Opportunity and Forecast, By By Type, 2016-2032
- 6.3.1. Eastern Europe Dry Construction Market Analysis by By Type: Introduction
- 6.3.2. Market Size Absolute $ Opportunity Analysis and Forecast, By By Type, 2016-2032
- 6.3.3. Supporting framework
- 6.3.4. Boarding
- 6.4. Eastern Europe Dry Construction Market Analysis, Opportunity and Forecast, By By Material, 2016-2032
- 6.4.1. Eastern Europe Dry Construction Market Analysis by By Material: Introduction
- 6.4.2. Market Size Absolute $ Opportunity Analysis and Forecast, By By Material, 2016-2032
- 6.4.3. Plasterboard
- 6.4.4. Wood
- 6.4.5. Metals
- 6.4.6. Plastic
- 6.4.7. Glass
- 6.4.8. Carpet
- 6.5. Eastern Europe Dry Construction Market Analysis, Opportunity and Forecast, By By Application, 2016-2032
- 6.5.1. Eastern Europe Dry Construction Market Analysis by By Application: Introduction
- 6.5.2. Market Size Absolute $ Opportunity Analysis and Forecast, By By Application, 2016-2032
- 6.5.3. Residential
- 6.5.4. Non-residential
- 6.6. Eastern Europe Dry Construction Market Analysis, Opportunity and Forecast, By By System, 2016-2032
- 6.6.1. Eastern Europe Dry Construction Market Analysis by By System: Introduction
- 6.6.2. Market Size Absolute $ Opportunity Analysis and Forecast, By By System, 2016-2032
- 6.6.3. Wall
- 6.6.4. Ceiling
- 6.6.5. Flooring
- 6.6.6. Windows
- 6.6.7. Partition
- 6.6.8. Door systems
- 6.7. Eastern Europe Dry Construction Market Analysis, Opportunity and Forecast, By Country , 2016-2032
- 6.7.1. Eastern Europe Dry Construction Market Analysis by Country : Introduction
- 6.7.2. Market Size Absolute $ Opportunity Analysis and Forecast, Country , 2016-2032
- 6.7.2.1. Russia
- 6.7.2.2. Poland
- 6.7.2.3. The Czech Republic
- 6.7.2.4. Greece
- 6.7.2.5. Rest of Eastern Europe
- 7. APAC Dry Construction Market Analysis, Opportunity and Forecast, 2016-2032
- 7.1. APAC Dry Construction Market Analysis, 2016-2021
- 7.2. APAC Dry Construction Market Opportunity and Forecast, 2023-2032
- 7.3. APAC Dry Construction Market Analysis, Opportunity and Forecast, By By Type, 2016-2032
- 7.3.1. APAC Dry Construction Market Analysis by By Type: Introduction
- 7.3.2. Market Size Absolute $ Opportunity Analysis and Forecast, By By Type, 2016-2032
- 7.3.3. Supporting framework
- 7.3.4. Boarding
- 7.4. APAC Dry Construction Market Analysis, Opportunity and Forecast, By By Material, 2016-2032
- 7.4.1. APAC Dry Construction Market Analysis by By Material: Introduction
- 7.4.2. Market Size Absolute $ Opportunity Analysis and Forecast, By By Material, 2016-2032
- 7.4.3. Plasterboard
- 7.4.4. Wood
- 7.4.5. Metals
- 7.4.6. Plastic
- 7.4.7. Glass
- 7.4.8. Carpet
- 7.5. APAC Dry Construction Market Analysis, Opportunity and Forecast, By By Application, 2016-2032
- 7.5.1. APAC Dry Construction Market Analysis by By Application: Introduction
- 7.5.2. Market Size Absolute $ Opportunity Analysis and Forecast, By By Application, 2016-2032
- 7.5.3. Residential
- 7.5.4. Non-residential
- 7.6. APAC Dry Construction Market Analysis, Opportunity and Forecast, By By System, 2016-2032
- 7.6.1. APAC Dry Construction Market Analysis by By System: Introduction
- 7.6.2. Market Size Absolute $ Opportunity Analysis and Forecast, By By System, 2016-2032
- 7.6.3. Wall
- 7.6.4. Ceiling
- 7.6.5. Flooring
- 7.6.6. Windows
- 7.6.7. Partition
- 7.6.8. Door systems
- 7.7. APAC Dry Construction Market Analysis, Opportunity and Forecast, By Country , 2016-2032
- 7.7.1. APAC Dry Construction Market Analysis by Country : Introduction
- 7.7.2. Market Size Absolute $ Opportunity Analysis and Forecast, Country , 2016-2032
- 7.7.2.1. China
- 7.7.2.2. Japan
- 7.7.2.3. South Korea
- 7.7.2.4. India
- 7.7.2.5. Australia & New Zeland
- 7.7.2.6. Indonesia
- 7.7.2.7. Malaysia
- 7.7.2.8. Philippines
- 7.7.2.9. Singapore
- 7.7.2.10. Thailand
- 7.7.2.11. Vietnam
- 7.7.2.12. Rest of APAC
- 8. Latin America Dry Construction Market Analysis, Opportunity and Forecast, 2016-2032
- 8.1. Latin America Dry Construction Market Analysis, 2016-2021
- 8.2. Latin America Dry Construction Market Opportunity and Forecast, 2023-2032
- 8.3. Latin America Dry Construction Market Analysis, Opportunity and Forecast, By By Type, 2016-2032
- 8.3.1. Latin America Dry Construction Market Analysis by By Type: Introduction
- 8.3.2. Market Size Absolute $ Opportunity Analysis and Forecast, By By Type, 2016-2032
- 8.3.3. Supporting framework
- 8.3.4. Boarding
- 8.4. Latin America Dry Construction Market Analysis, Opportunity and Forecast, By By Material, 2016-2032
- 8.4.1. Latin America Dry Construction Market Analysis by By Material: Introduction
- 8.4.2. Market Size Absolute $ Opportunity Analysis and Forecast, By By Material, 2016-2032
- 8.4.3. Plasterboard
- 8.4.4. Wood
- 8.4.5. Metals
- 8.4.6. Plastic
- 8.4.7. Glass
- 8.4.8. Carpet
- 8.5. Latin America Dry Construction Market Analysis, Opportunity and Forecast, By By Application, 2016-2032
- 8.5.1. Latin America Dry Construction Market Analysis by By Application: Introduction
- 8.5.2. Market Size Absolute $ Opportunity Analysis and Forecast, By By Application, 2016-2032
- 8.5.3. Residential
- 8.5.4. Non-residential
- 8.6. Latin America Dry Construction Market Analysis, Opportunity and Forecast, By By System, 2016-2032
- 8.6.1. Latin America Dry Construction Market Analysis by By System: Introduction
- 8.6.2. Market Size Absolute $ Opportunity Analysis and Forecast, By By System, 2016-2032
- 8.6.3. Wall
- 8.6.4. Ceiling
- 8.6.5. Flooring
- 8.6.6. Windows
- 8.6.7. Partition
- 8.6.8. Door systems
- 8.7. Latin America Dry Construction Market Analysis, Opportunity and Forecast, By Country , 2016-2032
- 8.7.1. Latin America Dry Construction Market Analysis by Country : Introduction
- 8.7.2. Market Size Absolute $ Opportunity Analysis and Forecast, Country , 2016-2032
- 8.7.2.1. Brazil
- 8.7.2.2. Colombia
- 8.7.2.3. Chile
- 8.7.2.4. Argentina
- 8.7.2.5. Costa Rica
- 8.7.2.6. Rest of Latin America
- 9. Middle East & Africa Dry Construction Market Analysis, Opportunity and Forecast, 2016-2032
- 9.1. Middle East & Africa Dry Construction Market Analysis, 2016-2021
- 9.2. Middle East & Africa Dry Construction Market Opportunity and Forecast, 2023-2032
- 9.3. Middle East & Africa Dry Construction Market Analysis, Opportunity and Forecast, By By Type, 2016-2032
- 9.3.1. Middle East & Africa Dry Construction Market Analysis by By Type: Introduction
- 9.3.2. Market Size Absolute $ Opportunity Analysis and Forecast, By By Type, 2016-2032
- 9.3.3. Supporting framework
- 9.3.4. Boarding
- 9.4. Middle East & Africa Dry Construction Market Analysis, Opportunity and Forecast, By By Material, 2016-2032
- 9.4.1. Middle East & Africa Dry Construction Market Analysis by By Material: Introduction
- 9.4.2. Market Size Absolute $ Opportunity Analysis and Forecast, By By Material, 2016-2032
- 9.4.3. Plasterboard
- 9.4.4. Wood
- 9.4.5. Metals
- 9.4.6. Plastic
- 9.4.7. Glass
- 9.4.8. Carpet
- 9.5. Middle East & Africa Dry Construction Market Analysis, Opportunity and Forecast, By By Application, 2016-2032
- 9.5.1. Middle East & Africa Dry Construction Market Analysis by By Application: Introduction
- 9.5.2. Market Size Absolute $ Opportunity Analysis and Forecast, By By Application, 2016-2032
- 9.5.3. Residential
- 9.5.4. Non-residential
- 9.6. Middle East & Africa Dry Construction Market Analysis, Opportunity and Forecast, By By System, 2016-2032
- 9.6.1. Middle East & Africa Dry Construction Market Analysis by By System: Introduction
- 9.6.2. Market Size Absolute $ Opportunity Analysis and Forecast, By By System, 2016-2032
- 9.6.3. Wall
- 9.6.4. Ceiling
- 9.6.5. Flooring
- 9.6.6. Windows
- 9.6.7. Partition
- 9.6.8. Door systems
- 9.7. Middle East & Africa Dry Construction Market Analysis, Opportunity and Forecast, By Country , 2016-2032
- 9.7.1. Middle East & Africa Dry Construction Market Analysis by Country : Introduction
- 9.7.2. Market Size Absolute $ Opportunity Analysis and Forecast, Country , 2016-2032
- 9.7.2.1. Algeria
- 9.7.2.2. Egypt
- 9.7.2.3. Israel
- 9.7.2.4. Kuwait
- 9.7.2.5. Nigeria
- 9.7.2.6. Saudi Arabia
- 9.7.2.7. South Africa
- 9.7.2.8. Turkey
- 9.7.2.9. The UAE
- 9.7.2.10. Rest of MEA
- 10. Global Dry Construction Market Analysis, Opportunity and Forecast, By Region , 2016-2032
- 10.1. Global Dry Construction Market Analysis by Region : Introduction
- 10.2. Market Size Absolute $ Opportunity Analysis and Forecast, By Region , 2016-2032
- 10.2.1. North America
- 10.2.2. Western Europe
- 10.2.3. Eastern Europe
- 10.2.4. APAC
- 10.2.5. Latin America
- 10.2.6. Middle East & Africa
- 11. Global Dry Construction Market Competitive Landscape, Market Share Analysis, and Company Profiles
- 11.1. Market Share Analysis
- 11.2. Company Profiles
- 11.3. Panel Rey
- 11.3.1. Company Overview
- 11.3.2. Financial Highlights
- 11.3.3. Product Portfolio
- 11.3.4. SWOT Analysis
- 11.3.5. Key Strategies and Developments
- 11.4. Etex Group
- 11.4.1. Company Overview
- 11.4.2. Financial Highlights
- 11.4.3. Product Portfolio
- 11.4.4. SWOT Analysis
- 11.4.5. Key Strategies and Developments
- 11.5. Saint Gobain
- 11.5.1. Company Overview
- 11.5.2. Financial Highlights
- 11.5.3. Product Portfolio
- 11.5.4. SWOT Analysis
- 11.5.5. Key Strategies and Developments
- 11.6. Pabco Gypsum
- 11.6.1. Company Overview
- 11.6.2. Financial Highlights
- 11.6.3. Product Portfolio
- 11.6.4. SWOT Analysis
- 11.6.5. Key Strategies and Developments
- 11.7. Armstrong World Industries
- 11.7.1. Company Overview
- 11.7.2. Financial Highlights
- 11.7.3. Product Portfolio
- 11.7.4. SWOT Analysis
- 11.7.5. Key Strategies and Developments
- 11.8. Knauf, CSR Ltd.
- 11.8.1. Company Overview
- 11.8.2. Financial Highlights
- 11.8.3. Product Portfolio
- 11.8.4. SWOT Analysis
- 11.8.5. Key Strategies and Developments
- 11.9. Xella Group
- 11.9.1. Company Overview
- 11.9.2. Financial Highlights
- 11.9.3. Product Portfolio
- 11.9.4. SWOT Analysis
- 11.9.5. Key Strategies and Developments
- 11.10. Fletcher Building
- 11.10.1. Company Overview
- 11.10.2. Financial Highlights
- 11.10.3. Product Portfolio
- 11.10.4. SWOT Analysis
- 11.10.5. Key Strategies and Developments
- 11.11. USG Boral
- 11.11.1. Company Overview
- 11.11.2. Financial Highlights
- 11.11.3. Product Portfolio
- 11.11.4. SWOT Analysis
- 11.11.5. Key Strategies and Developments
- 11.12. Georgia-Pacific Wood Products
- 11.12.1. Company Overview
- 11.12.2. Financial Highlights
- 11.12.3. Product Portfolio
- 11.12.4. SWOT Analysis
- 11.12.5. Key Strategies and Developments
- 12. Assumptions and Acronyms
- 13. Research Methodology
- 14. Contact
List of Figures
-
- Figure 1: Global Dry Construction Market Revenue (US$ Mn) Market Share by Type in 2022
- Figure 2: Global Dry Construction Market Attractiveness Analysis by Type, 2016-2032
- Figure 3: Global Dry Construction Market Revenue (US$ Mn) Market Share by Materialin 2022
- Figure 4: Global Dry Construction Market Attractiveness Analysis by Material, 2016-2032
- Figure 5: Global Dry Construction Market Revenue (US$ Mn) Market Share by Applicationin 2022
- Figure 6: Global Dry Construction Market Attractiveness Analysis by Application, 2016-2032
- Figure 7: Global Dry Construction Market Revenue (US$ Mn) Market Share by Systemin 2022
- Figure 8: Global Dry Construction Market Attractiveness Analysis by System, 2016-2032
- Figure 9: Global Dry Construction Market Revenue (US$ Mn) Market Share by Region in 2022
- Figure 10: Global Dry Construction Market Attractiveness Analysis by Region, 2016-2032
- Figure 11: Global Dry Construction Market Revenue (US$ Mn) (2016-2032)
- Figure 12: Global Dry Construction Market Revenue (US$ Mn) Comparison by Region (2016-2032)
- Figure 13: Global Dry Construction Market Revenue (US$ Mn) Comparison by Type (2016-2032)
- Figure 14: Global Dry Construction Market Revenue (US$ Mn) Comparison by Material (2016-2032)
- Figure 15: Global Dry Construction Market Revenue (US$ Mn) Comparison by Application (2016-2032)
- Figure 16: Global Dry Construction Market Revenue (US$ Mn) Comparison by System (2016-2032)
- Figure 17: Global Dry Construction Market Y-o-Y Growth Rate Comparison by Region (2016-2032)
- Figure 18: Global Dry Construction Market Y-o-Y Growth Rate Comparison by Type (2016-2032)
- Figure 19: Global Dry Construction Market Y-o-Y Growth Rate Comparison by Material (2016-2032)
- Figure 20: Global Dry Construction Market Y-o-Y Growth Rate Comparison by Application (2016-2032)
- Figure 21: Global Dry Construction Market Y-o-Y Growth Rate Comparison by System (2016-2032)
- Figure 22: Global Dry Construction Market Share Comparison by Region (2016-2032)
- Figure 23: Global Dry Construction Market Share Comparison by Type (2016-2032)
- Figure 24: Global Dry Construction Market Share Comparison by Material (2016-2032)
- Figure 25: Global Dry Construction Market Share Comparison by Application (2016-2032)
- Figure 26: Global Dry Construction Market Share Comparison by System (2016-2032)
- Figure 27: North America Dry Construction Market Revenue (US$ Mn) Market Share by Typein 2022
- Figure 28: North America Dry Construction Market Attractiveness Analysis by Type, 2016-2032
- Figure 29: North America Dry Construction Market Revenue (US$ Mn) Market Share by Materialin 2022
- Figure 30: North America Dry Construction Market Attractiveness Analysis by Material, 2016-2032
- Figure 31: North America Dry Construction Market Revenue (US$ Mn) Market Share by Applicationin 2022
- Figure 32: North America Dry Construction Market Attractiveness Analysis by Application, 2016-2032
- Figure 33: North America Dry Construction Market Revenue (US$ Mn) Market Share by Systemin 2022
- Figure 34: North America Dry Construction Market Attractiveness Analysis by System, 2016-2032
- Figure 35: North America Dry Construction Market Revenue (US$ Mn) Market Share by Country in 2022
- Figure 36: North America Dry Construction Market Attractiveness Analysis by Country, 2016-2032
- Figure 37: North America Dry Construction Market Revenue (US$ Mn) (2016-2032)
- Figure 38: North America Dry Construction Market Revenue (US$ Mn) Comparison by Country (2016-2032)
- Figure 39: North America Dry Construction Market Revenue (US$ Mn) Comparison by Type (2016-2032)
- Figure 40: North America Dry Construction Market Revenue (US$ Mn) Comparison by Material (2016-2032)
- Figure 41: North America Dry Construction Market Revenue (US$ Mn) Comparison by Application (2016-2032)
- Figure 42: North America Dry Construction Market Revenue (US$ Mn) Comparison by System (2016-2032)
- Figure 43: North America Dry Construction Market Y-o-Y Growth Rate Comparison by Country (2016-2032)
- Figure 44: North America Dry Construction Market Y-o-Y Growth Rate Comparison by Type (2016-2032)
- Figure 45: North America Dry Construction Market Y-o-Y Growth Rate Comparison by Material (2016-2032)
- Figure 46: North America Dry Construction Market Y-o-Y Growth Rate Comparison by Application (2016-2032)
- Figure 47: North America Dry Construction Market Y-o-Y Growth Rate Comparison by System (2016-2032)
- Figure 48: North America Dry Construction Market Share Comparison by Country (2016-2032)
- Figure 49: North America Dry Construction Market Share Comparison by Type (2016-2032)
- Figure 50: North America Dry Construction Market Share Comparison by Material (2016-2032)
- Figure 51: North America Dry Construction Market Share Comparison by Application (2016-2032)
- Figure 52: North America Dry Construction Market Share Comparison by System (2016-2032)
- Figure 53: Western Europe Dry Construction Market Revenue (US$ Mn) Market Share by Typein 2022
- Figure 54: Western Europe Dry Construction Market Attractiveness Analysis by Type, 2016-2032
- Figure 55: Western Europe Dry Construction Market Revenue (US$ Mn) Market Share by Materialin 2022
- Figure 56: Western Europe Dry Construction Market Attractiveness Analysis by Material, 2016-2032
- Figure 57: Western Europe Dry Construction Market Revenue (US$ Mn) Market Share by Applicationin 2022
- Figure 58: Western Europe Dry Construction Market Attractiveness Analysis by Application, 2016-2032
- Figure 59: Western Europe Dry Construction Market Revenue (US$ Mn) Market Share by Systemin 2022
- Figure 60: Western Europe Dry Construction Market Attractiveness Analysis by System, 2016-2032
- Figure 61: Western Europe Dry Construction Market Revenue (US$ Mn) Market Share by Country in 2022
- Figure 62: Western Europe Dry Construction Market Attractiveness Analysis by Country, 2016-2032
- Figure 63: Western Europe Dry Construction Market Revenue (US$ Mn) (2016-2032)
- Figure 64: Western Europe Dry Construction Market Revenue (US$ Mn) Comparison by Country (2016-2032)
- Figure 65: Western Europe Dry Construction Market Revenue (US$ Mn) Comparison by Type (2016-2032)
- Figure 66: Western Europe Dry Construction Market Revenue (US$ Mn) Comparison by Material (2016-2032)
- Figure 67: Western Europe Dry Construction Market Revenue (US$ Mn) Comparison by Application (2016-2032)
- Figure 68: Western Europe Dry Construction Market Revenue (US$ Mn) Comparison by System (2016-2032)
- Figure 69: Western Europe Dry Construction Market Y-o-Y Growth Rate Comparison by Country (2016-2032)
- Figure 70: Western Europe Dry Construction Market Y-o-Y Growth Rate Comparison by Type (2016-2032)
- Figure 71: Western Europe Dry Construction Market Y-o-Y Growth Rate Comparison by Material (2016-2032)
- Figure 72: Western Europe Dry Construction Market Y-o-Y Growth Rate Comparison by Application (2016-2032)
- Figure 73: Western Europe Dry Construction Market Y-o-Y Growth Rate Comparison by System (2016-2032)
- Figure 74: Western Europe Dry Construction Market Share Comparison by Country (2016-2032)
- Figure 75: Western Europe Dry Construction Market Share Comparison by Type (2016-2032)
- Figure 76: Western Europe Dry Construction Market Share Comparison by Material (2016-2032)
- Figure 77: Western Europe Dry Construction Market Share Comparison by Application (2016-2032)
- Figure 78: Western Europe Dry Construction Market Share Comparison by System (2016-2032)
- Figure 79: Eastern Europe Dry Construction Market Revenue (US$ Mn) Market Share by Typein 2022
- Figure 80: Eastern Europe Dry Construction Market Attractiveness Analysis by Type, 2016-2032
- Figure 81: Eastern Europe Dry Construction Market Revenue (US$ Mn) Market Share by Materialin 2022
- Figure 82: Eastern Europe Dry Construction Market Attractiveness Analysis by Material, 2016-2032
- Figure 83: Eastern Europe Dry Construction Market Revenue (US$ Mn) Market Share by Applicationin 2022
- Figure 84: Eastern Europe Dry Construction Market Attractiveness Analysis by Application, 2016-2032
- Figure 85: Eastern Europe Dry Construction Market Revenue (US$ Mn) Market Share by Systemin 2022
- Figure 86: Eastern Europe Dry Construction Market Attractiveness Analysis by System, 2016-2032
- Figure 87: Eastern Europe Dry Construction Market Revenue (US$ Mn) Market Share by Country in 2022
- Figure 88: Eastern Europe Dry Construction Market Attractiveness Analysis by Country, 2016-2032
- Figure 89: Eastern Europe Dry Construction Market Revenue (US$ Mn) (2016-2032)
- Figure 90: Eastern Europe Dry Construction Market Revenue (US$ Mn) Comparison by Country (2016-2032)
- Figure 91: Eastern Europe Dry Construction Market Revenue (US$ Mn) Comparison by Type (2016-2032)
- Figure 92: Eastern Europe Dry Construction Market Revenue (US$ Mn) Comparison by Material (2016-2032)
- Figure 93: Eastern Europe Dry Construction Market Revenue (US$ Mn) Comparison by Application (2016-2032)
- Figure 94: Eastern Europe Dry Construction Market Revenue (US$ Mn) Comparison by System (2016-2032)
- Figure 95: Eastern Europe Dry Construction Market Y-o-Y Growth Rate Comparison by Country (2016-2032)
- Figure 96: Eastern Europe Dry Construction Market Y-o-Y Growth Rate Comparison by Type (2016-2032)
- Figure 97: Eastern Europe Dry Construction Market Y-o-Y Growth Rate Comparison by Material (2016-2032)
- Figure 98: Eastern Europe Dry Construction Market Y-o-Y Growth Rate Comparison by Application (2016-2032)
- Figure 99: Eastern Europe Dry Construction Market Y-o-Y Growth Rate Comparison by System (2016-2032)
- Figure 100: Eastern Europe Dry Construction Market Share Comparison by Country (2016-2032)
- Figure 101: Eastern Europe Dry Construction Market Share Comparison by Type (2016-2032)
- Figure 102: Eastern Europe Dry Construction Market Share Comparison by Material (2016-2032)
- Figure 103: Eastern Europe Dry Construction Market Share Comparison by Application (2016-2032)
- Figure 104: Eastern Europe Dry Construction Market Share Comparison by System (2016-2032)
- Figure 105: APAC Dry Construction Market Revenue (US$ Mn) Market Share by Typein 2022
- Figure 106: APAC Dry Construction Market Attractiveness Analysis by Type, 2016-2032
- Figure 107: APAC Dry Construction Market Revenue (US$ Mn) Market Share by Materialin 2022
- Figure 108: APAC Dry Construction Market Attractiveness Analysis by Material, 2016-2032
- Figure 109: APAC Dry Construction Market Revenue (US$ Mn) Market Share by Applicationin 2022
- Figure 110: APAC Dry Construction Market Attractiveness Analysis by Application, 2016-2032
- Figure 111: APAC Dry Construction Market Revenue (US$ Mn) Market Share by Systemin 2022
- Figure 112: APAC Dry Construction Market Attractiveness Analysis by System, 2016-2032
- Figure 113: APAC Dry Construction Market Revenue (US$ Mn) Market Share by Country in 2022
- Figure 114: APAC Dry Construction Market Attractiveness Analysis by Country, 2016-2032
- Figure 115: APAC Dry Construction Market Revenue (US$ Mn) (2016-2032)
- Figure 116: APAC Dry Construction Market Revenue (US$ Mn) Comparison by Country (2016-2032)
- Figure 117: APAC Dry Construction Market Revenue (US$ Mn) Comparison by Type (2016-2032)
- Figure 118: APAC Dry Construction Market Revenue (US$ Mn) Comparison by Material (2016-2032)
- Figure 119: APAC Dry Construction Market Revenue (US$ Mn) Comparison by Application (2016-2032)
- Figure 120: APAC Dry Construction Market Revenue (US$ Mn) Comparison by System (2016-2032)
- Figure 121: APAC Dry Construction Market Y-o-Y Growth Rate Comparison by Country (2016-2032)
- Figure 122: APAC Dry Construction Market Y-o-Y Growth Rate Comparison by Type (2016-2032)
- Figure 123: APAC Dry Construction Market Y-o-Y Growth Rate Comparison by Material (2016-2032)
- Figure 124: APAC Dry Construction Market Y-o-Y Growth Rate Comparison by Application (2016-2032)
- Figure 125: APAC Dry Construction Market Y-o-Y Growth Rate Comparison by System (2016-2032)
- Figure 126: APAC Dry Construction Market Share Comparison by Country (2016-2032)
- Figure 127: APAC Dry Construction Market Share Comparison by Type (2016-2032)
- Figure 128: APAC Dry Construction Market Share Comparison by Material (2016-2032)
- Figure 129: APAC Dry Construction Market Share Comparison by Application (2016-2032)
- Figure 130: APAC Dry Construction Market Share Comparison by System (2016-2032)
- Figure 131: Latin America Dry Construction Market Revenue (US$ Mn) Market Share by Typein 2022
- Figure 132: Latin America Dry Construction Market Attractiveness Analysis by Type, 2016-2032
- Figure 133: Latin America Dry Construction Market Revenue (US$ Mn) Market Share by Materialin 2022
- Figure 134: Latin America Dry Construction Market Attractiveness Analysis by Material, 2016-2032
- Figure 135: Latin America Dry Construction Market Revenue (US$ Mn) Market Share by Applicationin 2022
- Figure 136: Latin America Dry Construction Market Attractiveness Analysis by Application, 2016-2032
- Figure 137: Latin America Dry Construction Market Revenue (US$ Mn) Market Share by Systemin 2022
- Figure 138: Latin America Dry Construction Market Attractiveness Analysis by System, 2016-2032
- Figure 139: Latin America Dry Construction Market Revenue (US$ Mn) Market Share by Country in 2022
- Figure 140: Latin America Dry Construction Market Attractiveness Analysis by Country, 2016-2032
- Figure 141: Latin America Dry Construction Market Revenue (US$ Mn) (2016-2032)
- Figure 142: Latin America Dry Construction Market Revenue (US$ Mn) Comparison by Country (2016-2032)
- Figure 143: Latin America Dry Construction Market Revenue (US$ Mn) Comparison by Type (2016-2032)
- Figure 144: Latin America Dry Construction Market Revenue (US$ Mn) Comparison by Material (2016-2032)
- Figure 145: Latin America Dry Construction Market Revenue (US$ Mn) Comparison by Application (2016-2032)
- Figure 146: Latin America Dry Construction Market Revenue (US$ Mn) Comparison by System (2016-2032)
- Figure 147: Latin America Dry Construction Market Y-o-Y Growth Rate Comparison by Country (2016-2032)
- Figure 148: Latin America Dry Construction Market Y-o-Y Growth Rate Comparison by Type (2016-2032)
- Figure 149: Latin America Dry Construction Market Y-o-Y Growth Rate Comparison by Material (2016-2032)
- Figure 150: Latin America Dry Construction Market Y-o-Y Growth Rate Comparison by Application (2016-2032)
- Figure 151: Latin America Dry Construction Market Y-o-Y Growth Rate Comparison by System (2016-2032)
- Figure 152: Latin America Dry Construction Market Share Comparison by Country (2016-2032)
- Figure 153: Latin America Dry Construction Market Share Comparison by Type (2016-2032)
- Figure 154: Latin America Dry Construction Market Share Comparison by Material (2016-2032)
- Figure 155: Latin America Dry Construction Market Share Comparison by Application (2016-2032)
- Figure 156: Latin America Dry Construction Market Share Comparison by System (2016-2032)
- Figure 157: Middle East & Africa Dry Construction Market Revenue (US$ Mn) Market Share by Typein 2022
- Figure 158: Middle East & Africa Dry Construction Market Attractiveness Analysis by Type, 2016-2032
- Figure 159: Middle East & Africa Dry Construction Market Revenue (US$ Mn) Market Share by Materialin 2022
- Figure 160: Middle East & Africa Dry Construction Market Attractiveness Analysis by Material, 2016-2032
- Figure 161: Middle East & Africa Dry Construction Market Revenue (US$ Mn) Market Share by Applicationin 2022
- Figure 162: Middle East & Africa Dry Construction Market Attractiveness Analysis by Application, 2016-2032
- Figure 163: Middle East & Africa Dry Construction Market Revenue (US$ Mn) Market Share by Systemin 2022
- Figure 164: Middle East & Africa Dry Construction Market Attractiveness Analysis by System, 2016-2032
- Figure 165: Middle East & Africa Dry Construction Market Revenue (US$ Mn) Market Share by Country in 2022
- Figure 166: Middle East & Africa Dry Construction Market Attractiveness Analysis by Country, 2016-2032
- Figure 167: Middle East & Africa Dry Construction Market Revenue (US$ Mn) (2016-2032)
- Figure 168: Middle East & Africa Dry Construction Market Revenue (US$ Mn) Comparison by Country (2016-2032)
- Figure 169: Middle East & Africa Dry Construction Market Revenue (US$ Mn) Comparison by Type (2016-2032)
- Figure 170: Middle East & Africa Dry Construction Market Revenue (US$ Mn) Comparison by Material (2016-2032)
- Figure 171: Middle East & Africa Dry Construction Market Revenue (US$ Mn) Comparison by Application (2016-2032)
- Figure 172: Middle East & Africa Dry Construction Market Revenue (US$ Mn) Comparison by System (2016-2032)
- Figure 173: Middle East & Africa Dry Construction Market Y-o-Y Growth Rate Comparison by Country (2016-2032)
- Figure 174: Middle East & Africa Dry Construction Market Y-o-Y Growth Rate Comparison by Type (2016-2032)
- Figure 175: Middle East & Africa Dry Construction Market Y-o-Y Growth Rate Comparison by Material (2016-2032)
- Figure 176: Middle East & Africa Dry Construction Market Y-o-Y Growth Rate Comparison by Application (2016-2032)
- Figure 177: Middle East & Africa Dry Construction Market Y-o-Y Growth Rate Comparison by System (2016-2032)
- Figure 178: Middle East & Africa Dry Construction Market Share Comparison by Country (2016-2032)
- Figure 179: Middle East & Africa Dry Construction Market Share Comparison by Type (2016-2032)
- Figure 180: Middle East & Africa Dry Construction Market Share Comparison by Material (2016-2032)
- Figure 181: Middle East & Africa Dry Construction Market Share Comparison by Application (2016-2032)
- Figure 182: Middle East & Africa Dry Construction Market Share Comparison by System (2016-2032)
List of Tables
- Table 1: Global Dry Construction Market Comparison by Type (2016-2032)
- Table 2: Global Dry Construction Market Comparison by Material (2016-2032)
- Table 3: Global Dry Construction Market Comparison by Application (2016-2032)
- Table 4: Global Dry Construction Market Comparison by System (2016-2032)
- Table 5: Global Dry Construction Market Revenue (US$ Mn) Comparison by Region (2016-2032)
- Table 6: Global Dry Construction Market Revenue (US$ Mn) (2016-2032)
- Table 7: Global Dry Construction Market Revenue (US$ Mn) Comparison by Region (2016-2032)
- Table 8: Global Dry Construction Market Revenue (US$ Mn) Comparison by Type (2016-2032)
- Table 9: Global Dry Construction Market Revenue (US$ Mn) Comparison by Material (2016-2032)
- Table 10: Global Dry Construction Market Revenue (US$ Mn) Comparison by Application (2016-2032)
- Table 11: Global Dry Construction Market Revenue (US$ Mn) Comparison by System (2016-2032)
- Table 12: Global Dry Construction Market Y-o-Y Growth Rate Comparison by Region (2016-2032)
- Table 13: Global Dry Construction Market Y-o-Y Growth Rate Comparison by Type (2016-2032)
- Table 14: Global Dry Construction Market Y-o-Y Growth Rate Comparison by Material (2016-2032)
- Table 15: Global Dry Construction Market Y-o-Y Growth Rate Comparison by Application (2016-2032)
- Table 16: Global Dry Construction Market Y-o-Y Growth Rate Comparison by System (2016-2032)
- Table 17: Global Dry Construction Market Share Comparison by Region (2016-2032)
- Table 18: Global Dry Construction Market Share Comparison by Type (2016-2032)
- Table 19: Global Dry Construction Market Share Comparison by Material (2016-2032)
- Table 20: Global Dry Construction Market Share Comparison by Application (2016-2032)
- Table 21: Global Dry Construction Market Share Comparison by System (2016-2032)
- Table 22: North America Dry Construction Market Comparison by Material (2016-2032)
- Table 23: North America Dry Construction Market Comparison by Application (2016-2032)
- Table 24: North America Dry Construction Market Comparison by System (2016-2032)
- Table 25: North America Dry Construction Market Revenue (US$ Mn) Comparison by Country (2016-2032)
- Table 26: North America Dry Construction Market Revenue (US$ Mn) (2016-2032)
- Table 27: North America Dry Construction Market Revenue (US$ Mn) Comparison by Country (2016-2032)
- Table 28: North America Dry Construction Market Revenue (US$ Mn) Comparison by Type (2016-2032)
- Table 29: North America Dry Construction Market Revenue (US$ Mn) Comparison by Material (2016-2032)
- Table 30: North America Dry Construction Market Revenue (US$ Mn) Comparison by Application (2016-2032)
- Table 31: North America Dry Construction Market Revenue (US$ Mn) Comparison by System (2016-2032)
- Table 32: North America Dry Construction Market Y-o-Y Growth Rate Comparison by Country (2016-2032)
- Table 33: North America Dry Construction Market Y-o-Y Growth Rate Comparison by Type (2016-2032)
- Table 34: North America Dry Construction Market Y-o-Y Growth Rate Comparison by Material (2016-2032)
- Table 35: North America Dry Construction Market Y-o-Y Growth Rate Comparison by Application (2016-2032)
- Table 36: North America Dry Construction Market Y-o-Y Growth Rate Comparison by System (2016-2032)
- Table 37: North America Dry Construction Market Share Comparison by Country (2016-2032)
- Table 38: North America Dry Construction Market Share Comparison by Type (2016-2032)
- Table 39: North America Dry Construction Market Share Comparison by Material (2016-2032)
- Table 40: North America Dry Construction Market Share Comparison by Application (2016-2032)
- Table 41: North America Dry Construction Market Share Comparison by System (2016-2032)
- Table 42: Western Europe Dry Construction Market Comparison by Type (2016-2032)
- Table 43: Western Europe Dry Construction Market Comparison by Material (2016-2032)
- Table 44: Western Europe Dry Construction Market Comparison by Application (2016-2032)
- Table 45: Western Europe Dry Construction Market Comparison by System (2016-2032)
- Table 46: Western Europe Dry Construction Market Revenue (US$ Mn) Comparison by Country (2016-2032)
- Table 47: Western Europe Dry Construction Market Revenue (US$ Mn) (2016-2032)
- Table 48: Western Europe Dry Construction Market Revenue (US$ Mn) Comparison by Country (2016-2032)
- Table 49: Western Europe Dry Construction Market Revenue (US$ Mn) Comparison by Type (2016-2032)
- Table 50: Western Europe Dry Construction Market Revenue (US$ Mn) Comparison by Material (2016-2032)
- Table 51: Western Europe Dry Construction Market Revenue (US$ Mn) Comparison by Application (2016-2032)
- Table 52: Western Europe Dry Construction Market Revenue (US$ Mn) Comparison by System (2016-2032)
- Table 53: Western Europe Dry Construction Market Y-o-Y Growth Rate Comparison by Country (2016-2032)
- Table 54: Western Europe Dry Construction Market Y-o-Y Growth Rate Comparison by Type (2016-2032)
- Table 55: Western Europe Dry Construction Market Y-o-Y Growth Rate Comparison by Material (2016-2032)
- Table 56: Western Europe Dry Construction Market Y-o-Y Growth Rate Comparison by Application (2016-2032)
- Table 57: Western Europe Dry Construction Market Y-o-Y Growth Rate Comparison by System (2016-2032)
- Table 58: Western Europe Dry Construction Market Share Comparison by Country (2016-2032)
- Table 59: Western Europe Dry Construction Market Share Comparison by Type (2016-2032)
- Table 60: Western Europe Dry Construction Market Share Comparison by Material (2016-2032)
- Table 61: Western Europe Dry Construction Market Share Comparison by Application (2016-2032)
- Table 62: Western Europe Dry Construction Market Share Comparison by System (2016-2032)
- Table 63: Eastern Europe Dry Construction Market Comparison by Type (2016-2032)
- Table 64: Eastern Europe Dry Construction Market Comparison by Material (2016-2032)
- Table 65: Eastern Europe Dry Construction Market Comparison by Application (2016-2032)
- Table 66: Eastern Europe Dry Construction Market Comparison by System (2016-2032)
- Table 67: Eastern Europe Dry Construction Market Revenue (US$ Mn) Comparison by Country (2016-2032)
- Table 68: Eastern Europe Dry Construction Market Revenue (US$ Mn) (2016-2032)
- Table 69: Eastern Europe Dry Construction Market Revenue (US$ Mn) Comparison by Country (2016-2032)
- Table 70: Eastern Europe Dry Construction Market Revenue (US$ Mn) Comparison by Type (2016-2032)
- Table 71: Eastern Europe Dry Construction Market Revenue (US$ Mn) Comparison by Material (2016-2032)
- Table 72: Eastern Europe Dry Construction Market Revenue (US$ Mn) Comparison by Application (2016-2032)
- Table 73: Eastern Europe Dry Construction Market Revenue (US$ Mn) Comparison by System (2016-2032)
- Table 74: Eastern Europe Dry Construction Market Y-o-Y Growth Rate Comparison by Country (2016-2032)
- Table 75: Eastern Europe Dry Construction Market Y-o-Y Growth Rate Comparison by Type (2016-2032)
- Table 76: Eastern Europe Dry Construction Market Y-o-Y Growth Rate Comparison by Material (2016-2032)
- Table 77: Eastern Europe Dry Construction Market Y-o-Y Growth Rate Comparison by Application (2016-2032)
- Table 78: Eastern Europe Dry Construction Market Y-o-Y Growth Rate Comparison by System (2016-2032)
- Table 79: Eastern Europe Dry Construction Market Share Comparison by Country (2016-2032)
- Table 80: Eastern Europe Dry Construction Market Share Comparison by Type (2016-2032)
- Table 81: Eastern Europe Dry Construction Market Share Comparison by Material (2016-2032)
- Table 82: Eastern Europe Dry Construction Market Share Comparison by Application (2016-2032)
- Table 83: Eastern Europe Dry Construction Market Share Comparison by System (2016-2032)
- Table 84: APAC Dry Construction Market Comparison by Type (2016-2032)
- Table 85: APAC Dry Construction Market Comparison by Material (2016-2032)
- Table 86: APAC Dry Construction Market Comparison by Application (2016-2032)
- Table 87: APAC Dry Construction Market Comparison by System (2016-2032)
- Table 88: APAC Dry Construction Market Revenue (US$ Mn) Comparison by Country (2016-2032)
- Table 89: APAC Dry Construction Market Revenue (US$ Mn) (2016-2032)
- Table 90: APAC Dry Construction Market Revenue (US$ Mn) Comparison by Country (2016-2032)
- Table 91: APAC Dry Construction Market Revenue (US$ Mn) Comparison by Type (2016-2032)
- Table 92: APAC Dry Construction Market Revenue (US$ Mn) Comparison by Material (2016-2032)
- Table 93: APAC Dry Construction Market Revenue (US$ Mn) Comparison by Application (2016-2032)
- Table 94: APAC Dry Construction Market Revenue (US$ Mn) Comparison by System (2016-2032)
- Table 95: APAC Dry Construction Market Y-o-Y Growth Rate Comparison by Country (2016-2032)
- Table 96: APAC Dry Construction Market Y-o-Y Growth Rate Comparison by Type (2016-2032)
- Table 97: APAC Dry Construction Market Y-o-Y Growth Rate Comparison by Material (2016-2032)
- Table 98: APAC Dry Construction Market Y-o-Y Growth Rate Comparison by Application (2016-2032)
- Table 99: APAC Dry Construction Market Y-o-Y Growth Rate Comparison by System (2016-2032)
- Table 100: APAC Dry Construction Market Share Comparison by Country (2016-2032)
- Table 101: APAC Dry Construction Market Share Comparison by Type (2016-2032)
- Table 102: APAC Dry Construction Market Share Comparison by Material (2016-2032)
- Table 103: APAC Dry Construction Market Share Comparison by Application (2016-2032)
- Table 104: APAC Dry Construction Market Share Comparison by System (2016-2032)
- Table 105: Latin America Dry Construction Market Comparison by Type (2016-2032)
- Table 106: Latin America Dry Construction Market Comparison by Material (2016-2032)
- Table 107: Latin America Dry Construction Market Comparison by Application (2016-2032)
- Table 108: Latin America Dry Construction Market Comparison by System (2016-2032)
- Table 109: Latin America Dry Construction Market Revenue (US$ Mn) Comparison by Country (2016-2032)
- Table 110: Latin America Dry Construction Market Revenue (US$ Mn) (2016-2032)
- Table 111: Latin America Dry Construction Market Revenue (US$ Mn) Comparison by Country (2016-2032)
- Table 112: Latin America Dry Construction Market Revenue (US$ Mn) Comparison by Type (2016-2032)
- Table 113: Latin America Dry Construction Market Revenue (US$ Mn) Comparison by Material (2016-2032)
- Table 114: Latin America Dry Construction Market Revenue (US$ Mn) Comparison by Application (2016-2032)
- Table 115: Latin America Dry Construction Market Revenue (US$ Mn) Comparison by System (2016-2032)
- Table 116: Latin America Dry Construction Market Y-o-Y Growth Rate Comparison by Country (2016-2032)
- Table 117: Latin America Dry Construction Market Y-o-Y Growth Rate Comparison by Type (2016-2032)
- Table 118: Latin America Dry Construction Market Y-o-Y Growth Rate Comparison by Material (2016-2032)
- Table 119: Latin America Dry Construction Market Y-o-Y Growth Rate Comparison by Application (2016-2032)
- Table 120: Latin America Dry Construction Market Y-o-Y Growth Rate Comparison by System (2016-2032)
- Table 121: Latin America Dry Construction Market Share Comparison by Country (2016-2032)
- Table 122: Latin America Dry Construction Market Share Comparison by Type (2016-2032)
- Table 123: Latin America Dry Construction Market Share Comparison by Material (2016-2032)
- Table 124: Latin America Dry Construction Market Share Comparison by Application (2016-2032)
- Table 125: Latin America Dry Construction Market Share Comparison by System (2016-2032)
- Table 126: Middle East & Africa Dry Construction Market Comparison by Type (2016-2032)
- Table 127: Middle East & Africa Dry Construction Market Comparison by Material (2016-2032)
- Table 128: Middle East & Africa Dry Construction Market Comparison by Application (2016-2032)
- Table 129: Middle East & Africa Dry Construction Market Comparison by System (2016-2032)
- Table 130: Middle East & Africa Dry Construction Market Revenue (US$ Mn) Comparison by Country (2016-2032)
- Table 131: Middle East & Africa Dry Construction Market Revenue (US$ Mn) (2016-2032)
- Table 132: Middle East & Africa Dry Construction Market Revenue (US$ Mn) Comparison by Country (2016-2032)
- Table 133: Middle East & Africa Dry Construction Market Revenue (US$ Mn) Comparison by Type (2016-2032)
- Table 134: Middle East & Africa Dry Construction Market Revenue (US$ Mn) Comparison by Material (2016-2032)
- Table 135: Middle East & Africa Dry Construction Market Revenue (US$ Mn) Comparison by Application (2016-2032)
- Table 136: Middle East & Africa Dry Construction Market Revenue (US$ Mn) Comparison by System (2016-2032)
- Table 137: Middle East & Africa Dry Construction Market Y-o-Y Growth Rate Comparison by Country (2016-2032)
- Table 138: Middle East & Africa Dry Construction Market Y-o-Y Growth Rate Comparison by Type (2016-2032)
- Table 139: Middle East & Africa Dry Construction Market Y-o-Y Growth Rate Comparison by Material (2016-2032)
- Table 140: Middle East & Africa Dry Construction Market Y-o-Y Growth Rate Comparison by Application (2016-2032)
- Table 141: Middle East & Africa Dry Construction Market Y-o-Y Growth Rate Comparison by System (2016-2032)
- Table 142: Middle East & Africa Dry Construction Market Share Comparison by Country (2016-2032)
- Table 143: Middle East & Africa Dry Construction Market Share Comparison by Type (2016-2032)
- Table 144: Middle East & Africa Dry Construction Market Share Comparison by Material (2016-2032)
- Table 145: Middle East & Africa Dry Construction Market Share Comparison by Application (2016-2032)
- Table 146: Middle East & Africa Dry Construction Market Share Comparison by System (2016-2032)
- 1. Executive Summary
-
- Panel Rey
- Etex Group
- Saint Gobain
- Pabco Gypsum
- Armstrong World Industries
- Knauf, CSR Ltd.
- Xella Group
- Fletcher Building
- USG Boral
- Georgia-Pacific Wood Products
Our Clients


View Our Licence Options
