
Dredging Market By Dredging Method (Mechanical Dredging, Hydraulic Dredging, Other), By Application (Trade Maintenance, Coastal Protection, Other), By End-User (Government, Oil and Gas Industry, Other), By Region And Companies - Industry Segment Outlook, Market Assessment, Competition Scenario, Trends, And Forecast 2023-2032
-
38163
-
June 2023
-
170
-


-
This report was compiled by Shreyas Rokade Shreyas Rokade is a seasoned Research Analyst with CMFE, bringing extensive expertise in market research and consulting, with a strong background in Chemical Engineering. Correspondence Team Lead-CMFE Linkedin | Detailed Market research Methodology Our methodology involves a mix of primary research, including interviews with leading mental health experts, and secondary research from reputable medical journals and databases. View Detailed Methodology Page
-
Quick Navigation
Report Overview
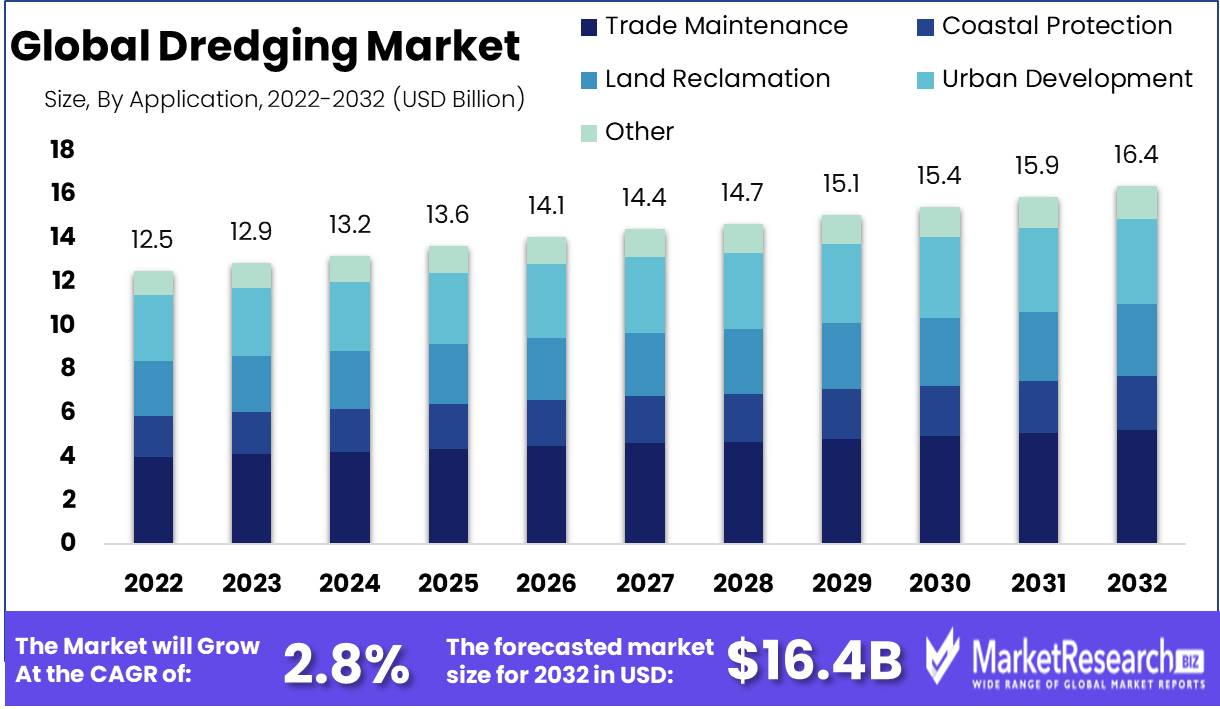
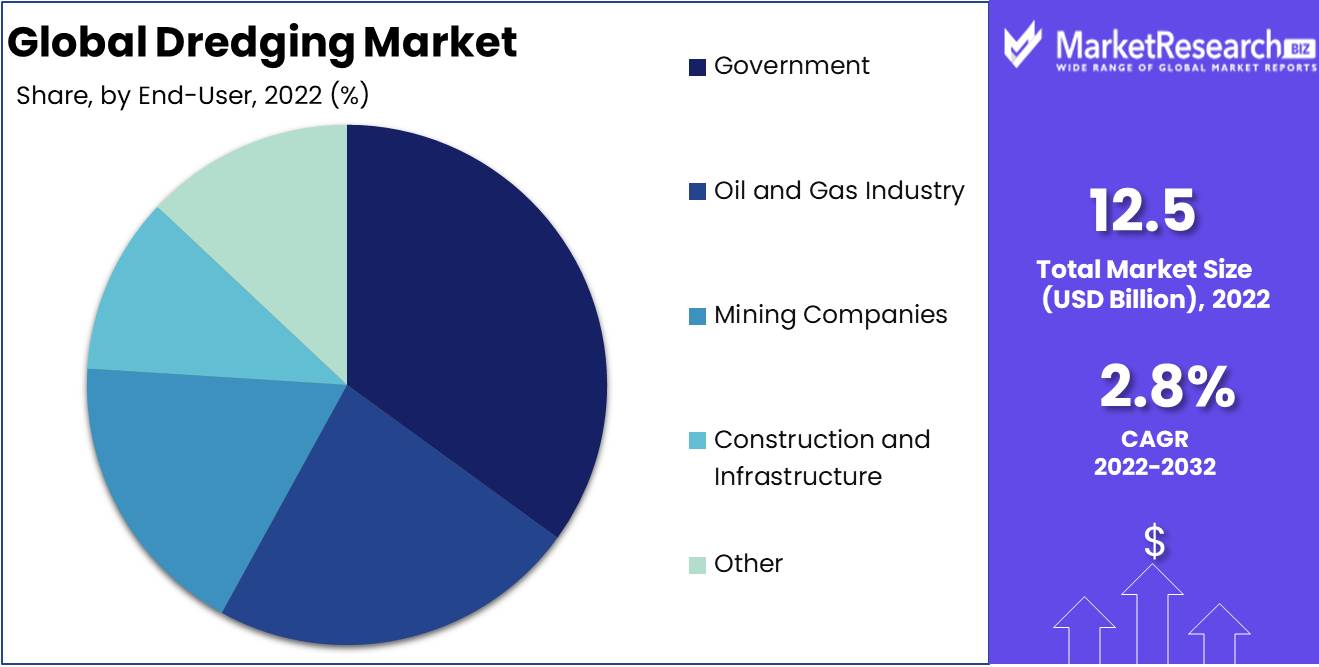
Dredging Market size is expected to be worth around USD 16.4 Bn by 2032 from USD 12.5 Bn in 2022, growing at a CAGR of 2.8% during the forecast period from 2023 to 2032.
The dredging plays a crucial role in the maintenance and improvement of waterway infrastructure, as well as in the support of numerous industries and the promotion of safe navigation. Dredging is the excavation and removal of sediment, debris, and other materials from the seafloor, riverbeds, and harbors to deepen water channels and construct ship berths.
Due to increasing maritime trade activities, expanding seaports, and rising demand for coastal protection and land reclamation projects, the global dredging market has experienced consistent growth over the past several years. Due to the need for infrastructure development to support economic growth, developing economies in Asia-Pacific and Africa have emerged as significant contributors to the market.
Governments throughout the globe are investing heavily in dredging projects to improve navigational channels, make room for larger vessels, and increase the overall capacity of ports and harbors. In addition, dredging is essential for sustaining ecosystems, restoring wetlands, and preserving biodiversity, making it a vital component of environmental conservation efforts.
In addition to technological advancements, the dredging market has witnessed the introduction of innovative equipment and techniques that increase efficiency and reduce environmental impacts. Modern dredging vessels are outfitted with cutting-edge positioning and monitoring systems, allowing for precise and eco-friendly operations.
Capital dredging entails the creation of new waterways or the deepening of existing ones to accommodate larger vessels, whereas maintenance dredging focuses on the removal of sediment accumulation to ensure safe navigation and prevent siltation. Capital and maintenance dredging contribute significantly to the growth of the market.
Driving factors
Growing Maritime Trade
The expansion of global trade has increased shipping activity and necessitated the maintenance of waterways. Dredging is essential for assuring that ports and harbors can accommodate larger vessels and cargo. The demand for dredging services is expected to increase as international trade continues to expand, propelling the expansion of the dredging market.
Growing Maritime Trade
Rapid urbanization and coastal development necessitate extensive dredging efforts. To create land for infrastructure initiatives such as ports, airports, and industrial zones, dredging is required. In addition, coastal cities frequently encounter the problem of erosion, which can be mitigated by beach nourishment projects involving the replacement of eroded beaches with dredged sand. These elements contribute to the growing demand for dredging services in urban and coastal areas.
Infrastructure Development for Energy
Offshore wind farms, liquefied natural gas (LNG) terminals, and oil and gas pipelines are just a few examples of the energy infrastructure that requires dredging. For seabed preparation, trenching, and cable and pipeline burial, dredging is required. As the global demand for renewable energy sources and hydrocarbon extraction continues to rise, the associated infrastructure development is anticipated to benefit the dredging market.
Change Climate Adaptation
Coastal regions face significant challenges from the effects of climate change, such as rising sea levels and more frequent extreme weather events. By creating or maintaining channels and water storage areas, dredging plays a vital role in coastal protection and flood mitigation. In addition, dredging can be used to restore ecosystems by removing sediment contaminants or invasive species. As governments and communities concentrate on adapting to climate change, the demand for dredging services to address these issues is expected to rise.
Restraining Factors
Environmental Considerations and Rules
In recent years, environmental concerns and regulations have become increasingly stringent. These regulations seek to minimize the negative environmental impact of dredging, including water pollution, habitat destruction, and harm to marine life. Compliance can be complex, expensive, and time-consuming, as regulatory requirements vary from country to country. To ensure compliance, the dredging industry must invest in new technologies and procedures, which can result in higher costs and extended project durations.
High initial dredging equipment costs
The high initial costs of equipment are a further significant obstacle for the dredging industry. Dredging operations require expensive, specialized equipment including dredgers, pumps, and pipelines. To maintain these machines in good condition and compliance with environmental regulations, routine maintenance, and upgrades are necessary.
Impact Potential on Marine Ecosystems
A significant concern for the dredging industry is the potential impact on marine ecosystems. Dredging can disrupt marine life's natural habitats, including coral reefs, seagrass meadows, and other delicate ecosystems. This can impact marine populations, reduce biodiversity, and cause irreparable environmental damage. To minimize their impact on marine ecosystems, dredging operations must be meticulously planned and implemented.
Application Analysis
The Trade Maintenance Segment Dominates the Global Dredging Market. In the dredging industry, the trade maintenance market segment is the largest and most lucrative. This segment focuses predominantly on the maintenance and expansion of ports and harbors, ensuring the efficient flow of trade. The demand for larger cargo vessels has put enormous pressure on ports and harbors around the globe, which has created an opportunity for the dredging industry to step in and provide solutions. The trade maintenance segment accounted for 60% of the global dredging market in 2019, and this trend is anticipated to continue in the years to come.
Emerging economies such as China, India, and Brazil have experienced significant economic development in recent years, which has increased their import and export activities. These nations' growth has led to an increase in demand for trade maintenance services, driving the expansion of the dredging industry. Developing nations, particularly those with expansive coastlines, require continuous dredging and maintenance of their ports and harbors, resulting in a substantial demand for dredging services.
End User Analysis
Global Dredging Market Dominates Government Segment. The government segment represents more than 40 percent of the global dredging market and represents the largest end-user segment. The government segment focuses primarily on maintaining waterways, regulating water levels, and the construction and maintenance of naval and military ports. The growing demand for naval bases around the globe has created an opportunity for the dredging industry to step in and offer solutions. The government segment is highly dependent on economic and political factors, and any change in policy or legislation can have a substantial effect on the industry's growth.
Emerging economies are witnessing significant development in a variety of industries, and the dredging industry's government segment is no exception. The growth of emerging economies has led to an increase in demand for the construction and maintenance of naval ports and waterways, driving the segment of the dredging industry known as the government.
Key Market Segments
By Method
- Mechanical Dredging
- Hydraulic Dredging
- Other
By Application
- Trade Maintenance
- Coastal Protection
- Land Reclamation
- Urban Development
- Environmental Remediation
- Other
By End-User
- Government
- Oil and Gas Industry
- Mining Companies
- Construction and Infrastructure
- Other
Growth Opportunity
Expansion of Dredging Operations in Emerging Markets
One of the primary factors fueling the growth of the Global Dredging Market is the increasing demand for dredging operations in emerging markets such as Asia Pacific and Africa. Significant demand for dredging services is generated by the region's increasing demand for infrastructure development, urbanization, and expansion of ports and waterways. The expansion of dredging operations in Asia-Pacific and Africa is driven predominantly by investments in infrastructure development projects and rising demand for natural resources.
Sustainable and eco-friendly dredging technique development
Environmental concerns have played a significant role in shaping the dredging industry over the years, and the industry has responded with the development of sustainable and environmentally favorable dredging techniques. Increasing awareness of the environmental impact of dredging and regulations mandating the use of sustainable techniques have driven the development of sustainable dredging methods. Sustainable dredging techniques minimize the environmental impact of dredging operations, reduce emissions, and conserve natural resources.
Utilization of Remotely-Controlled and Autonomous Dredging Systems
By facilitating 24/7 operations, increasing efficiency, and enhancing safety, the utilization of autonomous and remotely operated dredging systems is revolutionizing the dredging industry. Autonomy and remote operations enable dredging companies to reduce the number of crew members required for dredging operations, minimize the risk of accidents and injuries, and increase dredging productivity. Additionally, autonomous dredging systems are advantageous in areas that are challenging for humans to access.
Latest Trends
Dredging for Ports and Waterways Maintenance
Globally, maintenance dredging is a necessity for ports and waterways. It entails the removal of sediment and debris that accumulate in waterways and port areas over time, ensuring safe and efficient navigation. The removal of sediments from maritime channels, berths, and quays is typical for maintenance dredging projects. The depth, width, and configuration of the navigational channels must be maintained. The growth of global trade and the requirement to accommodate larger vessels are the primary causes of the rising demand for maintenance dredging. The increasing frequency and severity of natural disasters around the globe have also contributed to the growth of this market segment.
Dredging Investment for Harbor Expansion
Capital dredging involves removing sediments and debris to create a new harbor or expand an existing one. The expansion of a harbor is necessary to meet the rising demand for shipping and port activities. Due to the rising demand for port facilities in developing countries, the market for capital dredging has been expanding. The expansion of harbors enables these nations to participate in international commerce more effectively, thereby contributing to their economic growth. The growth of ecotourism has also increased the demand for capital dredging projects. In some Caribbean islands, for instance, new harbors have been dredged and new docks have been constructed to facilitate the growing number of tourists.
Combining Digital Technologies
The incorporation of digital technologies has revolutionized the dredging industry and is playing a crucial role in the formation of the global dredging market. For effective project planning and execution, digital technologies such as artificial intelligence, machine learning, Augmented, and Virtual Reality are used to collect and analyze data. Additionally, digital technologies have improved the safety and precision, and accuracy of dredging operations. The accumulation and analysis of real-time data can detect any deviation from the planned dredging operations to ensure that they are timely, cost-efficient, and have minimal environmental impact.
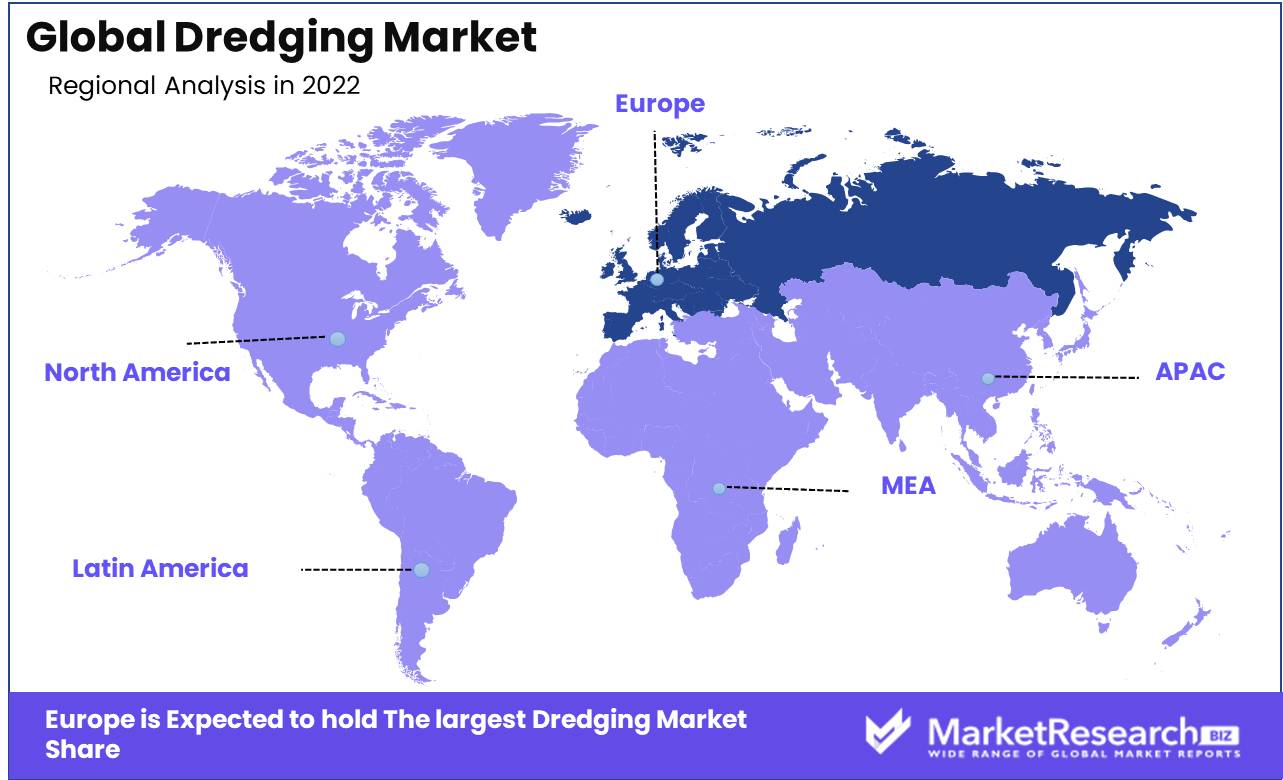
Regional Analysis
Europe dominates the market for dredging. The dredging market is an integral part of the global marine industry. It plays a crucial role in the development, maintenance, and enhancement of ports, harbors, and waterways. As such, it represents a substantial economic opportunity for many countries around the world. Despite the presence of numerous competitors in this market in recent years, Europe has come to dominate it due to a combination of factors that have given it a competitive advantage. In this article, we'll take a closer look at Europe's role in the dredging market, analyzing what factors have contributed to its success and what the future may hold.
Before discussing Europe's role in the dredging market, let's first define this term. Dredging is the removal of sediment and other materials from the bottoms of waterways, ports, and harbors. This may involve excavating and moving soil, sand, gravel, and other materials to create deeper channels or new land formations.
The global dredging industry is a multibillion-dollar enterprise that employs tens of thousands of individuals. Europe stands out as one of the most dominant participants in this market, even though many countries are present.
Europe has long been a leader in engineering and technical know-how, with extensive experience in fields such as water management, infrastructure construction, and marine engineering. This has provided it with a competitive advantage in the dredging market, where precise engineering and technical expertise are essential for success.
Key Regions and Countries
North America
- US
- Canada
- Mexico
Western Europe
- Germany
- France
- The UK
- Spain
- Italy
- Portugal
- Ireland
- Austria
- Switzerland
- Benelux
- Nordic
- Rest of Western Europe
Eastern Europe
- Russia
- Poland
- The Czech Republic
- Greece
- Rest of Eastern Europe
APAC
- China
- Japan
- South Korea
- India
- Australia & New Zealand
- Indonesia
- Malaysia
- Philippines
- Singapore
- Thailand
- Vietnam
- Rest of APAC
Latin America
- Brazil
- Colombia
- Chile
- Argentina
- Costa Rica
- Rest of Latin America
Middle East & Africa
- Algeria
- Egypt
- Israel
- Kuwait
- Nigeria
- Saudi Arabia
- South Africa
- Turkey
- United Arab Emirates
- Rest of MEA
Key Players Analysis
Royal Boskalis Westminster N.V., a Dutch company that provides offshore and onshore dredging services, as well as other maritime solutions including towing, salvage, and terminal services, is one of the main players in the dredging industry. Among the high-profile contracts in their portfolio are the expansion of the Suez Canal in Egypt and the construction of Maasvlakte 2, a new marine terminal in the Netherlands.
Van Oord, a Dutch company that provides a variety of dredging and marine engineering solutions, is another major actor in the global dredging market. They have participated in several noteworthy initiatives, such as the reclamation of land for the Singapore Tuas Terminal and the creation of a new island in the Maldives.
Jan De Nul Group, with its headquarters in Belgium, is an additional prominent participant in the dredging industry with a global presence on multiple continents. The company specializes in excavation, offshore construction, and environmental services and has participated in several large-scale projects, including the expansion of the Panama Canal and the construction of Dubai's Palm Jumeirah Island.
DEME Group, China Harbour Engineering Company, and Great Lakes Dredge & Dock Corporation are additional market leaders. These businesses are continually innovating and investing in new technologies to increase efficiency and provide clients with sustainable solutions. With the increasing demand for dredging services across the globe, these key players are anticipated to maintain their market dominance for many years.
Top Key Players in Dredging Market
- DEME Group
- Great Lakes Dredge & Dock Corporation
- National Marine Dredging Company
- Hyundai Engineering & Construction
- Manson Construction Co.
- Jan De Nul Group
- Boskalis
- Royal Van Oord
- Weeks Marine
- Royal IHC
- Other
Recent Development
- In 2022, The US Army Corps of Engineers awarded Weeks Marine a $1.2 billion contract to build a new dredging and maintenance facility in New York Harbor.
- In 2023, The Dutch dredging company Boskalis was awarded a €400 million contract to maintain the Suez Canal.
- In 2023, The US Environmental Protection Agency awarded the Port of Houston a $100 million grant to finance dredging projects to improve navigation and reduce flooding risks.
Report Scope:
Report Features Description Market Value (2022) USD 12.5 Bn Forecast Revenue (2032) USD 16.4 Bn CAGR (2023-2032) 2.8% Base Year for Estimation 2022 Historic Period 2016-2022 Forecast Period 2023-2032 Report Coverage Revenue Forecast, Market Dynamics, COVID-19 Impact, Competitive Landscape, Recent Developments Segments Covered By Dredging Method (Mechanical Dredging, Hydraulic Dredging, Other Methods)
By Application (Trade Maintenance, Coastal Protection, Land Reclamation, Urban Development, Environmental Remediation, Other Applications)
By End-User (Government, Oil, and Gas Industry, Mining Companies, Construction and Infrastructure, Other End-Users)Regional Analysis North America – The US, Canada, & Mexico; Western Europe – Germany, France, The UK, Spain, Italy, Portugal, Ireland, Austria, Switzerland, Benelux, Nordic, & Rest of Western Europe; Eastern Europe – Russia, Poland, The Czech Republic, Greece, & Rest of Eastern Europe; APAC – China, Japan, South Korea, India, Australia & New Zealand, Indonesia, Malaysia, Philippines, Singapore, Thailand, Vietnam, & Rest of APAC; Latin America – Brazil, Colombia, Chile, Argentina, Costa Rica, & Rest of Latin America; the Middle East & Africa – Algeria, Egypt, Israel, Kuwait, Nigeria, Saudi Arabia, South Africa, Turkey, United Arab Emirates, & Rest of MEA Competitive Landscape DEME Group, Great Lakes Dredge & Dock Corporation, National Marine Dredging Company, Hyundai Engineering & Construction, Manson Construction Co., Jan De Nul Group, Boskalis, Royal Van Oord, Weeks Marine, Royal IHC, Other Key Players Customization Scope Customization for segments, region/country-level will be provided. Moreover, additional customization can be done based on the requirements. Purchase Options We have three licenses to opt for Single User License, Multi-User License (Up to 5 Users), Corporate Use License (Unlimited User and Printable PDF) -
- 1. Executive Summary
- 1.1. Definition
- 1.2. Taxonomy
- 1.3. Research Scope
- 1.4. Key Analysis
- 1.5. Key Findings by Major Segments
- 1.6. Top strategies by Major Players
- 2. Global Dredging Market Overview
- 2.1. Dredging Market Dynamics
- 2.1.1. Drivers
- 2.1.2. Opportunities
- 2.1.3. Restraints
- 2.1.4. Challenges
- 2.2. Macro-economic Factors
- 2.3. Regulatory Framework
- 2.4. Market Investment Feasibility Index
- 2.5. PEST Analysis
- 2.6. PORTER’S Five Force Analysis
- 2.7. Drivers & Restraints Impact Analysis
- 2.8. Industry Chain Analysis
- 2.9. Cost Structure Analysis
- 2.10. Marketing Strategy
- 2.11. Russia-Ukraine War Impact Analysis
- 2.12. Opportunity Map Analysis
- 2.13. Market Competition Scenario Analysis
- 2.14. Product Life Cycle Analysis
- 2.15. Opportunity Orbits
- 2.16. Manufacturer Intensity Map
- 2.17. Major Companies sales by Value & Volume
- 2.1. Dredging Market Dynamics
- 3. Global Dredging Market Analysis, Opportunity and Forecast, 2016-2032
- 3.1. Global Dredging Market Analysis, 2016-2021
- 3.2. Global Dredging Market Opportunity and Forecast, 2023-2032
- 3.3. Global Dredging Market Analysis, Opportunity and Forecast, By By Dredging Method, 2016-2032
- 3.3.1. Global Dredging Market Analysis by By Dredging Method: Introduction
- 3.3.2. Market Size Absolute $ Opportunity Analysis and Forecast, By By Dredging Method, 2016-2032
- 3.3.3. Mechanical Dredging
- 3.3.4. Hydraulic Dredging
- 3.3.5. Other
- 3.4. Global Dredging Market Analysis, Opportunity and Forecast, By By Application, 2016-2032
- 3.4.1. Global Dredging Market Analysis by By Application: Introduction
- 3.4.2. Market Size Absolute $ Opportunity Analysis and Forecast, By By Application, 2016-2032
- 3.4.3. Trade Maintenance
- 3.4.4. Coastal Protection
- 3.4.5. Land Reclamation
- 3.4.6. Urban Development
- 3.4.7. Environmental Remediation
- 3.4.8. Other
- 3.5. Global Dredging Market Analysis, Opportunity and Forecast, By By End-User, 2016-2032
- 3.5.1. Global Dredging Market Analysis by By End-User: Introduction
- 3.5.2. Market Size Absolute $ Opportunity Analysis and Forecast, By By End-User, 2016-2032
- 3.5.3. Government
- 3.5.4. Oil and Gas Industry
- 3.5.5. Mining Companies
- 3.5.6. Construction and Infrastructure
- 3.5.7. Other
- 4. North America Dredging Market Analysis, Opportunity and Forecast, 2016-2032
- 4.1. North America Dredging Market Analysis, 2016-2021
- 4.2. North America Dredging Market Opportunity and Forecast, 2023-2032
- 4.3. North America Dredging Market Analysis, Opportunity and Forecast, By By Dredging Method, 2016-2032
- 4.3.1. North America Dredging Market Analysis by By Dredging Method: Introduction
- 4.3.2. Market Size Absolute $ Opportunity Analysis and Forecast, By By Dredging Method, 2016-2032
- 4.3.3. Mechanical Dredging
- 4.3.4. Hydraulic Dredging
- 4.3.5. Other
- 4.4. North America Dredging Market Analysis, Opportunity and Forecast, By By Application, 2016-2032
- 4.4.1. North America Dredging Market Analysis by By Application: Introduction
- 4.4.2. Market Size Absolute $ Opportunity Analysis and Forecast, By By Application, 2016-2032
- 4.4.3. Trade Maintenance
- 4.4.4. Coastal Protection
- 4.4.5. Land Reclamation
- 4.4.6. Urban Development
- 4.4.7. Environmental Remediation
- 4.4.8. Other
- 4.5. North America Dredging Market Analysis, Opportunity and Forecast, By By End-User, 2016-2032
- 4.5.1. North America Dredging Market Analysis by By End-User: Introduction
- 4.5.2. Market Size Absolute $ Opportunity Analysis and Forecast, By By End-User, 2016-2032
- 4.5.3. Government
- 4.5.4. Oil and Gas Industry
- 4.5.5. Mining Companies
- 4.5.6. Construction and Infrastructure
- 4.5.7. Other
- 4.6. North America Dredging Market Analysis, Opportunity and Forecast, By Country , 2016-2032
- 4.6.1. North America Dredging Market Analysis by Country : Introduction
- 4.6.2. Market Size Absolute $ Opportunity Analysis and Forecast, Country , 2016-2032
- 4.6.2.1. The US
- 4.6.2.2. Canada
- 4.6.2.3. Mexico
- 5. Western Europe Dredging Market Analysis, Opportunity and Forecast, 2016-2032
- 5.1. Western Europe Dredging Market Analysis, 2016-2021
- 5.2. Western Europe Dredging Market Opportunity and Forecast, 2023-2032
- 5.3. Western Europe Dredging Market Analysis, Opportunity and Forecast, By By Dredging Method, 2016-2032
- 5.3.1. Western Europe Dredging Market Analysis by By Dredging Method: Introduction
- 5.3.2. Market Size Absolute $ Opportunity Analysis and Forecast, By By Dredging Method, 2016-2032
- 5.3.3. Mechanical Dredging
- 5.3.4. Hydraulic Dredging
- 5.3.5. Other
- 5.4. Western Europe Dredging Market Analysis, Opportunity and Forecast, By By Application, 2016-2032
- 5.4.1. Western Europe Dredging Market Analysis by By Application: Introduction
- 5.4.2. Market Size Absolute $ Opportunity Analysis and Forecast, By By Application, 2016-2032
- 5.4.3. Trade Maintenance
- 5.4.4. Coastal Protection
- 5.4.5. Land Reclamation
- 5.4.6. Urban Development
- 5.4.7. Environmental Remediation
- 5.4.8. Other
- 5.5. Western Europe Dredging Market Analysis, Opportunity and Forecast, By By End-User, 2016-2032
- 5.5.1. Western Europe Dredging Market Analysis by By End-User: Introduction
- 5.5.2. Market Size Absolute $ Opportunity Analysis and Forecast, By By End-User, 2016-2032
- 5.5.3. Government
- 5.5.4. Oil and Gas Industry
- 5.5.5. Mining Companies
- 5.5.6. Construction and Infrastructure
- 5.5.7. Other
- 5.6. Western Europe Dredging Market Analysis, Opportunity and Forecast, By Country , 2016-2032
- 5.6.1. Western Europe Dredging Market Analysis by Country : Introduction
- 5.6.2. Market Size Absolute $ Opportunity Analysis and Forecast, Country , 2016-2032
- 5.6.2.1. Germany
- 5.6.2.2. France
- 5.6.2.3. The UK
- 5.6.2.4. Spain
- 5.6.2.5. Italy
- 5.6.2.6. Portugal
- 5.6.2.7. Ireland
- 5.6.2.8. Austria
- 5.6.2.9. Switzerland
- 5.6.2.10. Benelux
- 5.6.2.11. Nordic
- 5.6.2.12. Rest of Western Europe
- 6. Eastern Europe Dredging Market Analysis, Opportunity and Forecast, 2016-2032
- 6.1. Eastern Europe Dredging Market Analysis, 2016-2021
- 6.2. Eastern Europe Dredging Market Opportunity and Forecast, 2023-2032
- 6.3. Eastern Europe Dredging Market Analysis, Opportunity and Forecast, By By Dredging Method, 2016-2032
- 6.3.1. Eastern Europe Dredging Market Analysis by By Dredging Method: Introduction
- 6.3.2. Market Size Absolute $ Opportunity Analysis and Forecast, By By Dredging Method, 2016-2032
- 6.3.3. Mechanical Dredging
- 6.3.4. Hydraulic Dredging
- 6.3.5. Other
- 6.4. Eastern Europe Dredging Market Analysis, Opportunity and Forecast, By By Application, 2016-2032
- 6.4.1. Eastern Europe Dredging Market Analysis by By Application: Introduction
- 6.4.2. Market Size Absolute $ Opportunity Analysis and Forecast, By By Application, 2016-2032
- 6.4.3. Trade Maintenance
- 6.4.4. Coastal Protection
- 6.4.5. Land Reclamation
- 6.4.6. Urban Development
- 6.4.7. Environmental Remediation
- 6.4.8. Other
- 6.5. Eastern Europe Dredging Market Analysis, Opportunity and Forecast, By By End-User, 2016-2032
- 6.5.1. Eastern Europe Dredging Market Analysis by By End-User: Introduction
- 6.5.2. Market Size Absolute $ Opportunity Analysis and Forecast, By By End-User, 2016-2032
- 6.5.3. Government
- 6.5.4. Oil and Gas Industry
- 6.5.5. Mining Companies
- 6.5.6. Construction and Infrastructure
- 6.5.7. Other
- 6.6. Eastern Europe Dredging Market Analysis, Opportunity and Forecast, By Country , 2016-2032
- 6.6.1. Eastern Europe Dredging Market Analysis by Country : Introduction
- 6.6.2. Market Size Absolute $ Opportunity Analysis and Forecast, Country , 2016-2032
- 6.6.2.1. Russia
- 6.6.2.2. Poland
- 6.6.2.3. The Czech Republic
- 6.6.2.4. Greece
- 6.6.2.5. Rest of Eastern Europe
- 7. APAC Dredging Market Analysis, Opportunity and Forecast, 2016-2032
- 7.1. APAC Dredging Market Analysis, 2016-2021
- 7.2. APAC Dredging Market Opportunity and Forecast, 2023-2032
- 7.3. APAC Dredging Market Analysis, Opportunity and Forecast, By By Dredging Method, 2016-2032
- 7.3.1. APAC Dredging Market Analysis by By Dredging Method: Introduction
- 7.3.2. Market Size Absolute $ Opportunity Analysis and Forecast, By By Dredging Method, 2016-2032
- 7.3.3. Mechanical Dredging
- 7.3.4. Hydraulic Dredging
- 7.3.5. Other
- 7.4. APAC Dredging Market Analysis, Opportunity and Forecast, By By Application, 2016-2032
- 7.4.1. APAC Dredging Market Analysis by By Application: Introduction
- 7.4.2. Market Size Absolute $ Opportunity Analysis and Forecast, By By Application, 2016-2032
- 7.4.3. Trade Maintenance
- 7.4.4. Coastal Protection
- 7.4.5. Land Reclamation
- 7.4.6. Urban Development
- 7.4.7. Environmental Remediation
- 7.4.8. Other
- 7.5. APAC Dredging Market Analysis, Opportunity and Forecast, By By End-User, 2016-2032
- 7.5.1. APAC Dredging Market Analysis by By End-User: Introduction
- 7.5.2. Market Size Absolute $ Opportunity Analysis and Forecast, By By End-User, 2016-2032
- 7.5.3. Government
- 7.5.4. Oil and Gas Industry
- 7.5.5. Mining Companies
- 7.5.6. Construction and Infrastructure
- 7.5.7. Other
- 7.6. APAC Dredging Market Analysis, Opportunity and Forecast, By Country , 2016-2032
- 7.6.1. APAC Dredging Market Analysis by Country : Introduction
- 7.6.2. Market Size Absolute $ Opportunity Analysis and Forecast, Country , 2016-2032
- 7.6.2.1. China
- 7.6.2.2. Japan
- 7.6.2.3. South Korea
- 7.6.2.4. India
- 7.6.2.5. Australia & New Zeland
- 7.6.2.6. Indonesia
- 7.6.2.7. Malaysia
- 7.6.2.8. Philippines
- 7.6.2.9. Singapore
- 7.6.2.10. Thailand
- 7.6.2.11. Vietnam
- 7.6.2.12. Rest of APAC
- 8. Latin America Dredging Market Analysis, Opportunity and Forecast, 2016-2032
- 8.1. Latin America Dredging Market Analysis, 2016-2021
- 8.2. Latin America Dredging Market Opportunity and Forecast, 2023-2032
- 8.3. Latin America Dredging Market Analysis, Opportunity and Forecast, By By Dredging Method, 2016-2032
- 8.3.1. Latin America Dredging Market Analysis by By Dredging Method: Introduction
- 8.3.2. Market Size Absolute $ Opportunity Analysis and Forecast, By By Dredging Method, 2016-2032
- 8.3.3. Mechanical Dredging
- 8.3.4. Hydraulic Dredging
- 8.3.5. Other
- 8.4. Latin America Dredging Market Analysis, Opportunity and Forecast, By By Application, 2016-2032
- 8.4.1. Latin America Dredging Market Analysis by By Application: Introduction
- 8.4.2. Market Size Absolute $ Opportunity Analysis and Forecast, By By Application, 2016-2032
- 8.4.3. Trade Maintenance
- 8.4.4. Coastal Protection
- 8.4.5. Land Reclamation
- 8.4.6. Urban Development
- 8.4.7. Environmental Remediation
- 8.4.8. Other
- 8.5. Latin America Dredging Market Analysis, Opportunity and Forecast, By By End-User, 2016-2032
- 8.5.1. Latin America Dredging Market Analysis by By End-User: Introduction
- 8.5.2. Market Size Absolute $ Opportunity Analysis and Forecast, By By End-User, 2016-2032
- 8.5.3. Government
- 8.5.4. Oil and Gas Industry
- 8.5.5. Mining Companies
- 8.5.6. Construction and Infrastructure
- 8.5.7. Other
- 8.6. Latin America Dredging Market Analysis, Opportunity and Forecast, By Country , 2016-2032
- 8.6.1. Latin America Dredging Market Analysis by Country : Introduction
- 8.6.2. Market Size Absolute $ Opportunity Analysis and Forecast, Country , 2016-2032
- 8.6.2.1. Brazil
- 8.6.2.2. Colombia
- 8.6.2.3. Chile
- 8.6.2.4. Argentina
- 8.6.2.5. Costa Rica
- 8.6.2.6. Rest of Latin America
- 9. Middle East & Africa Dredging Market Analysis, Opportunity and Forecast, 2016-2032
- 9.1. Middle East & Africa Dredging Market Analysis, 2016-2021
- 9.2. Middle East & Africa Dredging Market Opportunity and Forecast, 2023-2032
- 9.3. Middle East & Africa Dredging Market Analysis, Opportunity and Forecast, By By Dredging Method, 2016-2032
- 9.3.1. Middle East & Africa Dredging Market Analysis by By Dredging Method: Introduction
- 9.3.2. Market Size Absolute $ Opportunity Analysis and Forecast, By By Dredging Method, 2016-2032
- 9.3.3. Mechanical Dredging
- 9.3.4. Hydraulic Dredging
- 9.3.5. Other
- 9.4. Middle East & Africa Dredging Market Analysis, Opportunity and Forecast, By By Application, 2016-2032
- 9.4.1. Middle East & Africa Dredging Market Analysis by By Application: Introduction
- 9.4.2. Market Size Absolute $ Opportunity Analysis and Forecast, By By Application, 2016-2032
- 9.4.3. Trade Maintenance
- 9.4.4. Coastal Protection
- 9.4.5. Land Reclamation
- 9.4.6. Urban Development
- 9.4.7. Environmental Remediation
- 9.4.8. Other
- 9.5. Middle East & Africa Dredging Market Analysis, Opportunity and Forecast, By By End-User, 2016-2032
- 9.5.1. Middle East & Africa Dredging Market Analysis by By End-User: Introduction
- 9.5.2. Market Size Absolute $ Opportunity Analysis and Forecast, By By End-User, 2016-2032
- 9.5.3. Government
- 9.5.4. Oil and Gas Industry
- 9.5.5. Mining Companies
- 9.5.6. Construction and Infrastructure
- 9.5.7. Other
- 9.6. Middle East & Africa Dredging Market Analysis, Opportunity and Forecast, By Country , 2016-2032
- 9.6.1. Middle East & Africa Dredging Market Analysis by Country : Introduction
- 9.6.2. Market Size Absolute $ Opportunity Analysis and Forecast, Country , 2016-2032
- 9.6.2.1. Algeria
- 9.6.2.2. Egypt
- 9.6.2.3. Israel
- 9.6.2.4. Kuwait
- 9.6.2.5. Nigeria
- 9.6.2.6. Saudi Arabia
- 9.6.2.7. South Africa
- 9.6.2.8. Turkey
- 9.6.2.9. The UAE
- 9.6.2.10. Rest of MEA
- 10. Global Dredging Market Analysis, Opportunity and Forecast, By Region , 2016-2032
- 10.1. Global Dredging Market Analysis by Region : Introduction
- 10.2. Market Size Absolute $ Opportunity Analysis and Forecast, By Region , 2016-2032
- 10.2.1. North America
- 10.2.2. Western Europe
- 10.2.3. Eastern Europe
- 10.2.4. APAC
- 10.2.5. Latin America
- 10.2.6. Middle East & Africa
- 11. Global Dredging Market Competitive Landscape, Market Share Analysis, and Company Profiles
- 11.1. Market Share Analysis
- 11.2. Company Profiles
- 11.3. DEME Group
- 11.3.1. Company Overview
- 11.3.2. Financial Highlights
- 11.3.3. Product Portfolio
- 11.3.4. SWOT Analysis
- 11.3.5. Key Strategies and Developments
- 11.4. Great Lakes Dredge & Dock Corporation
- 11.4.1. Company Overview
- 11.4.2. Financial Highlights
- 11.4.3. Product Portfolio
- 11.4.4. SWOT Analysis
- 11.4.5. Key Strategies and Developments
- 11.5. National Marine Dredging Company
- 11.5.1. Company Overview
- 11.5.2. Financial Highlights
- 11.5.3. Product Portfolio
- 11.5.4. SWOT Analysis
- 11.5.5. Key Strategies and Developments
- 11.6. Hyundai Engineering & Construction
- 11.6.1. Company Overview
- 11.6.2. Financial Highlights
- 11.6.3. Product Portfolio
- 11.6.4. SWOT Analysis
- 11.6.5. Key Strategies and Developments
- 11.7. Manson Construction Co.
- 11.7.1. Company Overview
- 11.7.2. Financial Highlights
- 11.7.3. Product Portfolio
- 11.7.4. SWOT Analysis
- 11.7.5. Key Strategies and Developments
- 11.8. Jan De Nul Group
- 11.8.1. Company Overview
- 11.8.2. Financial Highlights
- 11.8.3. Product Portfolio
- 11.8.4. SWOT Analysis
- 11.8.5. Key Strategies and Developments
- 11.9. Boskalis
- 11.9.1. Company Overview
- 11.9.2. Financial Highlights
- 11.9.3. Product Portfolio
- 11.9.4. SWOT Analysis
- 11.9.5. Key Strategies and Developments
- 11.10. Royal Van Oord
- 11.10.1. Company Overview
- 11.10.2. Financial Highlights
- 11.10.3. Product Portfolio
- 11.10.4. SWOT Analysis
- 11.10.5. Key Strategies and Developments
- 11.11. Weeks Marine
- 11.11.1. Company Overview
- 11.11.2. Financial Highlights
- 11.11.3. Product Portfolio
- 11.11.4. SWOT Analysis
- 11.11.5. Key Strategies and Developments
- 11.12. Royal IHC
- 11.12.1. Company Overview
- 11.12.2. Financial Highlights
- 11.12.3. Product Portfolio
- 11.12.4. SWOT Analysis
- 11.12.5. Key Strategies and Developments
- 11.13. Other
- 11.13.1. Company Overview
- 11.13.2. Financial Highlights
- 11.13.3. Product Portfolio
- 11.13.4. SWOT Analysis
- 11.13.5. Key Strategies and Developments
- 12. Assumptions and Acronyms
- 13. Research Methodology
- 14. Contact
List of Figures
- Figure 1: Global Dredging Market Revenue (US$ Mn) Market Share by By Dredging Method in 2022
- Figure 2: Global Dredging Market Attractiveness Analysis by By Dredging Method, 2016-2032
- Figure 3: Global Dredging Market Revenue (US$ Mn) Market Share by By Applicationin 2022
- Figure 4: Global Dredging Market Attractiveness Analysis by By Application, 2016-2032
- Figure 5: Global Dredging Market Revenue (US$ Mn) Market Share by By End-Userin 2022
- Figure 6: Global Dredging Market Attractiveness Analysis by By End-User, 2016-2032
- Figure 7: Global Dredging Market Revenue (US$ Mn) Market Share by Region in 2022
- Figure 8: Global Dredging Market Attractiveness Analysis by Region, 2016-2032
- Figure 9: Global Dredging Market Revenue (US$ Mn) (2016-2032)
- Figure 10: Global Dredging Market Revenue (US$ Mn) Comparison by Region (2016-2032)
- Figure 11: Global Dredging Market Revenue (US$ Mn) Comparison by By Dredging Method (2016-2032)
- Figure 12: Global Dredging Market Revenue (US$ Mn) Comparison by By Application (2016-2032)
- Figure 13: Global Dredging Market Revenue (US$ Mn) Comparison by By End-User (2016-2032)
- Figure 14: Global Dredging Market Y-o-Y Growth Rate Comparison by Region (2016-2032)
- Figure 15: Global Dredging Market Y-o-Y Growth Rate Comparison by By Dredging Method (2016-2032)
- Figure 16: Global Dredging Market Y-o-Y Growth Rate Comparison by By Application (2016-2032)
- Figure 17: Global Dredging Market Y-o-Y Growth Rate Comparison by By End-User (2016-2032)
- Figure 18: Global Dredging Market Share Comparison by Region (2016-2032)
- Figure 19: Global Dredging Market Share Comparison by By Dredging Method (2016-2032)
- Figure 20: Global Dredging Market Share Comparison by By Application (2016-2032)
- Figure 21: Global Dredging Market Share Comparison by By End-User (2016-2032)
- Figure 22: North America Dredging Market Revenue (US$ Mn) Market Share by By Dredging Methodin 2022
- Figure 23: North America Dredging Market Attractiveness Analysis by By Dredging Method, 2016-2032
- Figure 24: North America Dredging Market Revenue (US$ Mn) Market Share by By Applicationin 2022
- Figure 25: North America Dredging Market Attractiveness Analysis by By Application, 2016-2032
- Figure 26: North America Dredging Market Revenue (US$ Mn) Market Share by By End-Userin 2022
- Figure 27: North America Dredging Market Attractiveness Analysis by By End-User, 2016-2032
- Figure 28: North America Dredging Market Revenue (US$ Mn) Market Share by Country in 2022
- Figure 29: North America Dredging Market Attractiveness Analysis by Country, 2016-2032
- Figure 30: North America Dredging Market Revenue (US$ Mn) (2016-2032)
- Figure 31: North America Dredging Market Revenue (US$ Mn) Comparison by Country (2016-2032)
- Figure 32: North America Dredging Market Revenue (US$ Mn) Comparison by By Dredging Method (2016-2032)
- Figure 33: North America Dredging Market Revenue (US$ Mn) Comparison by By Application (2016-2032)
- Figure 34: North America Dredging Market Revenue (US$ Mn) Comparison by By End-User (2016-2032)
- Figure 35: North America Dredging Market Y-o-Y Growth Rate Comparison by Country (2016-2032)
- Figure 36: North America Dredging Market Y-o-Y Growth Rate Comparison by By Dredging Method (2016-2032)
- Figure 37: North America Dredging Market Y-o-Y Growth Rate Comparison by By Application (2016-2032)
- Figure 38: North America Dredging Market Y-o-Y Growth Rate Comparison by By End-User (2016-2032)
- Figure 39: North America Dredging Market Share Comparison by Country (2016-2032)
- Figure 40: North America Dredging Market Share Comparison by By Dredging Method (2016-2032)
- Figure 41: North America Dredging Market Share Comparison by By Application (2016-2032)
- Figure 42: North America Dredging Market Share Comparison by By End-User (2016-2032)
- Figure 43: Western Europe Dredging Market Revenue (US$ Mn) Market Share by By Dredging Methodin 2022
- Figure 44: Western Europe Dredging Market Attractiveness Analysis by By Dredging Method, 2016-2032
- Figure 45: Western Europe Dredging Market Revenue (US$ Mn) Market Share by By Applicationin 2022
- Figure 46: Western Europe Dredging Market Attractiveness Analysis by By Application, 2016-2032
- Figure 47: Western Europe Dredging Market Revenue (US$ Mn) Market Share by By End-Userin 2022
- Figure 48: Western Europe Dredging Market Attractiveness Analysis by By End-User, 2016-2032
- Figure 49: Western Europe Dredging Market Revenue (US$ Mn) Market Share by Country in 2022
- Figure 50: Western Europe Dredging Market Attractiveness Analysis by Country, 2016-2032
- Figure 51: Western Europe Dredging Market Revenue (US$ Mn) (2016-2032)
- Figure 52: Western Europe Dredging Market Revenue (US$ Mn) Comparison by Country (2016-2032)
- Figure 53: Western Europe Dredging Market Revenue (US$ Mn) Comparison by By Dredging Method (2016-2032)
- Figure 54: Western Europe Dredging Market Revenue (US$ Mn) Comparison by By Application (2016-2032)
- Figure 55: Western Europe Dredging Market Revenue (US$ Mn) Comparison by By End-User (2016-2032)
- Figure 56: Western Europe Dredging Market Y-o-Y Growth Rate Comparison by Country (2016-2032)
- Figure 57: Western Europe Dredging Market Y-o-Y Growth Rate Comparison by By Dredging Method (2016-2032)
- Figure 58: Western Europe Dredging Market Y-o-Y Growth Rate Comparison by By Application (2016-2032)
- Figure 59: Western Europe Dredging Market Y-o-Y Growth Rate Comparison by By End-User (2016-2032)
- Figure 60: Western Europe Dredging Market Share Comparison by Country (2016-2032)
- Figure 61: Western Europe Dredging Market Share Comparison by By Dredging Method (2016-2032)
- Figure 62: Western Europe Dredging Market Share Comparison by By Application (2016-2032)
- Figure 63: Western Europe Dredging Market Share Comparison by By End-User (2016-2032)
- Figure 64: Eastern Europe Dredging Market Revenue (US$ Mn) Market Share by By Dredging Methodin 2022
- Figure 65: Eastern Europe Dredging Market Attractiveness Analysis by By Dredging Method, 2016-2032
- Figure 66: Eastern Europe Dredging Market Revenue (US$ Mn) Market Share by By Applicationin 2022
- Figure 67: Eastern Europe Dredging Market Attractiveness Analysis by By Application, 2016-2032
- Figure 68: Eastern Europe Dredging Market Revenue (US$ Mn) Market Share by By End-Userin 2022
- Figure 69: Eastern Europe Dredging Market Attractiveness Analysis by By End-User, 2016-2032
- Figure 70: Eastern Europe Dredging Market Revenue (US$ Mn) Market Share by Country in 2022
- Figure 71: Eastern Europe Dredging Market Attractiveness Analysis by Country, 2016-2032
- Figure 72: Eastern Europe Dredging Market Revenue (US$ Mn) (2016-2032)
- Figure 73: Eastern Europe Dredging Market Revenue (US$ Mn) Comparison by Country (2016-2032)
- Figure 74: Eastern Europe Dredging Market Revenue (US$ Mn) Comparison by By Dredging Method (2016-2032)
- Figure 75: Eastern Europe Dredging Market Revenue (US$ Mn) Comparison by By Application (2016-2032)
- Figure 76: Eastern Europe Dredging Market Revenue (US$ Mn) Comparison by By End-User (2016-2032)
- Figure 77: Eastern Europe Dredging Market Y-o-Y Growth Rate Comparison by Country (2016-2032)
- Figure 78: Eastern Europe Dredging Market Y-o-Y Growth Rate Comparison by By Dredging Method (2016-2032)
- Figure 79: Eastern Europe Dredging Market Y-o-Y Growth Rate Comparison by By Application (2016-2032)
- Figure 80: Eastern Europe Dredging Market Y-o-Y Growth Rate Comparison by By End-User (2016-2032)
- Figure 81: Eastern Europe Dredging Market Share Comparison by Country (2016-2032)
- Figure 82: Eastern Europe Dredging Market Share Comparison by By Dredging Method (2016-2032)
- Figure 83: Eastern Europe Dredging Market Share Comparison by By Application (2016-2032)
- Figure 84: Eastern Europe Dredging Market Share Comparison by By End-User (2016-2032)
- Figure 85: APAC Dredging Market Revenue (US$ Mn) Market Share by By Dredging Methodin 2022
- Figure 86: APAC Dredging Market Attractiveness Analysis by By Dredging Method, 2016-2032
- Figure 87: APAC Dredging Market Revenue (US$ Mn) Market Share by By Applicationin 2022
- Figure 88: APAC Dredging Market Attractiveness Analysis by By Application, 2016-2032
- Figure 89: APAC Dredging Market Revenue (US$ Mn) Market Share by By End-Userin 2022
- Figure 90: APAC Dredging Market Attractiveness Analysis by By End-User, 2016-2032
- Figure 91: APAC Dredging Market Revenue (US$ Mn) Market Share by Country in 2022
- Figure 92: APAC Dredging Market Attractiveness Analysis by Country, 2016-2032
- Figure 93: APAC Dredging Market Revenue (US$ Mn) (2016-2032)
- Figure 94: APAC Dredging Market Revenue (US$ Mn) Comparison by Country (2016-2032)
- Figure 95: APAC Dredging Market Revenue (US$ Mn) Comparison by By Dredging Method (2016-2032)
- Figure 96: APAC Dredging Market Revenue (US$ Mn) Comparison by By Application (2016-2032)
- Figure 97: APAC Dredging Market Revenue (US$ Mn) Comparison by By End-User (2016-2032)
- Figure 98: APAC Dredging Market Y-o-Y Growth Rate Comparison by Country (2016-2032)
- Figure 99: APAC Dredging Market Y-o-Y Growth Rate Comparison by By Dredging Method (2016-2032)
- Figure 100: APAC Dredging Market Y-o-Y Growth Rate Comparison by By Application (2016-2032)
- Figure 101: APAC Dredging Market Y-o-Y Growth Rate Comparison by By End-User (2016-2032)
- Figure 102: APAC Dredging Market Share Comparison by Country (2016-2032)
- Figure 103: APAC Dredging Market Share Comparison by By Dredging Method (2016-2032)
- Figure 104: APAC Dredging Market Share Comparison by By Application (2016-2032)
- Figure 105: APAC Dredging Market Share Comparison by By End-User (2016-2032)
- Figure 106: Latin America Dredging Market Revenue (US$ Mn) Market Share by By Dredging Methodin 2022
- Figure 107: Latin America Dredging Market Attractiveness Analysis by By Dredging Method, 2016-2032
- Figure 108: Latin America Dredging Market Revenue (US$ Mn) Market Share by By Applicationin 2022
- Figure 109: Latin America Dredging Market Attractiveness Analysis by By Application, 2016-2032
- Figure 110: Latin America Dredging Market Revenue (US$ Mn) Market Share by By End-Userin 2022
- Figure 111: Latin America Dredging Market Attractiveness Analysis by By End-User, 2016-2032
- Figure 112: Latin America Dredging Market Revenue (US$ Mn) Market Share by Country in 2022
- Figure 113: Latin America Dredging Market Attractiveness Analysis by Country, 2016-2032
- Figure 114: Latin America Dredging Market Revenue (US$ Mn) (2016-2032)
- Figure 115: Latin America Dredging Market Revenue (US$ Mn) Comparison by Country (2016-2032)
- Figure 116: Latin America Dredging Market Revenue (US$ Mn) Comparison by By Dredging Method (2016-2032)
- Figure 117: Latin America Dredging Market Revenue (US$ Mn) Comparison by By Application (2016-2032)
- Figure 118: Latin America Dredging Market Revenue (US$ Mn) Comparison by By End-User (2016-2032)
- Figure 119: Latin America Dredging Market Y-o-Y Growth Rate Comparison by Country (2016-2032)
- Figure 120: Latin America Dredging Market Y-o-Y Growth Rate Comparison by By Dredging Method (2016-2032)
- Figure 121: Latin America Dredging Market Y-o-Y Growth Rate Comparison by By Application (2016-2032)
- Figure 122: Latin America Dredging Market Y-o-Y Growth Rate Comparison by By End-User (2016-2032)
- Figure 123: Latin America Dredging Market Share Comparison by Country (2016-2032)
- Figure 124: Latin America Dredging Market Share Comparison by By Dredging Method (2016-2032)
- Figure 125: Latin America Dredging Market Share Comparison by By Application (2016-2032)
- Figure 126: Latin America Dredging Market Share Comparison by By End-User (2016-2032)
- Figure 127: Middle East & Africa Dredging Market Revenue (US$ Mn) Market Share by By Dredging Methodin 2022
- Figure 128: Middle East & Africa Dredging Market Attractiveness Analysis by By Dredging Method, 2016-2032
- Figure 129: Middle East & Africa Dredging Market Revenue (US$ Mn) Market Share by By Applicationin 2022
- Figure 130: Middle East & Africa Dredging Market Attractiveness Analysis by By Application, 2016-2032
- Figure 131: Middle East & Africa Dredging Market Revenue (US$ Mn) Market Share by By End-Userin 2022
- Figure 132: Middle East & Africa Dredging Market Attractiveness Analysis by By End-User, 2016-2032
- Figure 133: Middle East & Africa Dredging Market Revenue (US$ Mn) Market Share by Country in 2022
- Figure 134: Middle East & Africa Dredging Market Attractiveness Analysis by Country, 2016-2032
- Figure 135: Middle East & Africa Dredging Market Revenue (US$ Mn) (2016-2032)
- Figure 136: Middle East & Africa Dredging Market Revenue (US$ Mn) Comparison by Country (2016-2032)
- Figure 137: Middle East & Africa Dredging Market Revenue (US$ Mn) Comparison by By Dredging Method (2016-2032)
- Figure 138: Middle East & Africa Dredging Market Revenue (US$ Mn) Comparison by By Application (2016-2032)
- Figure 139: Middle East & Africa Dredging Market Revenue (US$ Mn) Comparison by By End-User (2016-2032)
- Figure 140: Middle East & Africa Dredging Market Y-o-Y Growth Rate Comparison by Country (2016-2032)
- Figure 141: Middle East & Africa Dredging Market Y-o-Y Growth Rate Comparison by By Dredging Method (2016-2032)
- Figure 142: Middle East & Africa Dredging Market Y-o-Y Growth Rate Comparison by By Application (2016-2032)
- Figure 143: Middle East & Africa Dredging Market Y-o-Y Growth Rate Comparison by By End-User (2016-2032)
- Figure 144: Middle East & Africa Dredging Market Share Comparison by Country (2016-2032)
- Figure 145: Middle East & Africa Dredging Market Share Comparison by By Dredging Method (2016-2032)
- Figure 146: Middle East & Africa Dredging Market Share Comparison by By Application (2016-2032)
- Figure 147: Middle East & Africa Dredging Market Share Comparison by By End-User (2016-2032)
List of Tables
- Table 1: Global Dredging Market Comparison by By Dredging Method (2016-2032)
- Table 2: Global Dredging Market Comparison by By Application (2016-2032)
- Table 3: Global Dredging Market Comparison by By End-User (2016-2032)
- Table 4: Global Dredging Market Revenue (US$ Mn) Comparison by Region (2016-2032)
- Table 5: Global Dredging Market Revenue (US$ Mn) (2016-2032)
- Table 6: Global Dredging Market Revenue (US$ Mn) Comparison by Region (2016-2032)
- Table 7: Global Dredging Market Revenue (US$ Mn) Comparison by By Dredging Method (2016-2032)
- Table 8: Global Dredging Market Revenue (US$ Mn) Comparison by By Application (2016-2032)
- Table 9: Global Dredging Market Revenue (US$ Mn) Comparison by By End-User (2016-2032)
- Table 10: Global Dredging Market Y-o-Y Growth Rate Comparison by Region (2016-2032)
- Table 11: Global Dredging Market Y-o-Y Growth Rate Comparison by By Dredging Method (2016-2032)
- Table 12: Global Dredging Market Y-o-Y Growth Rate Comparison by By Application (2016-2032)
- Table 13: Global Dredging Market Y-o-Y Growth Rate Comparison by By End-User (2016-2032)
- Table 14: Global Dredging Market Share Comparison by Region (2016-2032)
- Table 15: Global Dredging Market Share Comparison by By Dredging Method (2016-2032)
- Table 16: Global Dredging Market Share Comparison by By Application (2016-2032)
- Table 17: Global Dredging Market Share Comparison by By End-User (2016-2032)
- Table 18: North America Dredging Market Comparison by By Application (2016-2032)
- Table 19: North America Dredging Market Comparison by By End-User (2016-2032)
- Table 20: North America Dredging Market Revenue (US$ Mn) Comparison by Country (2016-2032)
- Table 21: North America Dredging Market Revenue (US$ Mn) (2016-2032)
- Table 22: North America Dredging Market Revenue (US$ Mn) Comparison by Country (2016-2032)
- Table 23: North America Dredging Market Revenue (US$ Mn) Comparison by By Dredging Method (2016-2032)
- Table 24: North America Dredging Market Revenue (US$ Mn) Comparison by By Application (2016-2032)
- Table 25: North America Dredging Market Revenue (US$ Mn) Comparison by By End-User (2016-2032)
- Table 26: North America Dredging Market Y-o-Y Growth Rate Comparison by Country (2016-2032)
- Table 27: North America Dredging Market Y-o-Y Growth Rate Comparison by By Dredging Method (2016-2032)
- Table 28: North America Dredging Market Y-o-Y Growth Rate Comparison by By Application (2016-2032)
- Table 29: North America Dredging Market Y-o-Y Growth Rate Comparison by By End-User (2016-2032)
- Table 30: North America Dredging Market Share Comparison by Country (2016-2032)
- Table 31: North America Dredging Market Share Comparison by By Dredging Method (2016-2032)
- Table 32: North America Dredging Market Share Comparison by By Application (2016-2032)
- Table 33: North America Dredging Market Share Comparison by By End-User (2016-2032)
- Table 34: Western Europe Dredging Market Comparison by By Dredging Method (2016-2032)
- Table 35: Western Europe Dredging Market Comparison by By Application (2016-2032)
- Table 36: Western Europe Dredging Market Comparison by By End-User (2016-2032)
- Table 37: Western Europe Dredging Market Revenue (US$ Mn) Comparison by Country (2016-2032)
- Table 38: Western Europe Dredging Market Revenue (US$ Mn) (2016-2032)
- Table 39: Western Europe Dredging Market Revenue (US$ Mn) Comparison by Country (2016-2032)
- Table 40: Western Europe Dredging Market Revenue (US$ Mn) Comparison by By Dredging Method (2016-2032)
- Table 41: Western Europe Dredging Market Revenue (US$ Mn) Comparison by By Application (2016-2032)
- Table 42: Western Europe Dredging Market Revenue (US$ Mn) Comparison by By End-User (2016-2032)
- Table 43: Western Europe Dredging Market Y-o-Y Growth Rate Comparison by Country (2016-2032)
- Table 44: Western Europe Dredging Market Y-o-Y Growth Rate Comparison by By Dredging Method (2016-2032)
- Table 45: Western Europe Dredging Market Y-o-Y Growth Rate Comparison by By Application (2016-2032)
- Table 46: Western Europe Dredging Market Y-o-Y Growth Rate Comparison by By End-User (2016-2032)
- Table 47: Western Europe Dredging Market Share Comparison by Country (2016-2032)
- Table 48: Western Europe Dredging Market Share Comparison by By Dredging Method (2016-2032)
- Table 49: Western Europe Dredging Market Share Comparison by By Application (2016-2032)
- Table 50: Western Europe Dredging Market Share Comparison by By End-User (2016-2032)
- Table 51: Eastern Europe Dredging Market Comparison by By Dredging Method (2016-2032)
- Table 52: Eastern Europe Dredging Market Comparison by By Application (2016-2032)
- Table 53: Eastern Europe Dredging Market Comparison by By End-User (2016-2032)
- Table 54: Eastern Europe Dredging Market Revenue (US$ Mn) Comparison by Country (2016-2032)
- Table 55: Eastern Europe Dredging Market Revenue (US$ Mn) (2016-2032)
- Table 56: Eastern Europe Dredging Market Revenue (US$ Mn) Comparison by Country (2016-2032)
- Table 57: Eastern Europe Dredging Market Revenue (US$ Mn) Comparison by By Dredging Method (2016-2032)
- Table 58: Eastern Europe Dredging Market Revenue (US$ Mn) Comparison by By Application (2016-2032)
- Table 59: Eastern Europe Dredging Market Revenue (US$ Mn) Comparison by By End-User (2016-2032)
- Table 60: Eastern Europe Dredging Market Y-o-Y Growth Rate Comparison by Country (2016-2032)
- Table 61: Eastern Europe Dredging Market Y-o-Y Growth Rate Comparison by By Dredging Method (2016-2032)
- Table 62: Eastern Europe Dredging Market Y-o-Y Growth Rate Comparison by By Application (2016-2032)
- Table 63: Eastern Europe Dredging Market Y-o-Y Growth Rate Comparison by By End-User (2016-2032)
- Table 64: Eastern Europe Dredging Market Share Comparison by Country (2016-2032)
- Table 65: Eastern Europe Dredging Market Share Comparison by By Dredging Method (2016-2032)
- Table 66: Eastern Europe Dredging Market Share Comparison by By Application (2016-2032)
- Table 67: Eastern Europe Dredging Market Share Comparison by By End-User (2016-2032)
- Table 68: APAC Dredging Market Comparison by By Dredging Method (2016-2032)
- Table 69: APAC Dredging Market Comparison by By Application (2016-2032)
- Table 70: APAC Dredging Market Comparison by By End-User (2016-2032)
- Table 71: APAC Dredging Market Revenue (US$ Mn) Comparison by Country (2016-2032)
- Table 72: APAC Dredging Market Revenue (US$ Mn) (2016-2032)
- Table 73: APAC Dredging Market Revenue (US$ Mn) Comparison by Country (2016-2032)
- Table 74: APAC Dredging Market Revenue (US$ Mn) Comparison by By Dredging Method (2016-2032)
- Table 75: APAC Dredging Market Revenue (US$ Mn) Comparison by By Application (2016-2032)
- Table 76: APAC Dredging Market Revenue (US$ Mn) Comparison by By End-User (2016-2032)
- Table 77: APAC Dredging Market Y-o-Y Growth Rate Comparison by Country (2016-2032)
- Table 78: APAC Dredging Market Y-o-Y Growth Rate Comparison by By Dredging Method (2016-2032)
- Table 79: APAC Dredging Market Y-o-Y Growth Rate Comparison by By Application (2016-2032)
- Table 80: APAC Dredging Market Y-o-Y Growth Rate Comparison by By End-User (2016-2032)
- Table 81: APAC Dredging Market Share Comparison by Country (2016-2032)
- Table 82: APAC Dredging Market Share Comparison by By Dredging Method (2016-2032)
- Table 83: APAC Dredging Market Share Comparison by By Application (2016-2032)
- Table 84: APAC Dredging Market Share Comparison by By End-User (2016-2032)
- Table 85: Latin America Dredging Market Comparison by By Dredging Method (2016-2032)
- Table 86: Latin America Dredging Market Comparison by By Application (2016-2032)
- Table 87: Latin America Dredging Market Comparison by By End-User (2016-2032)
- Table 88: Latin America Dredging Market Revenue (US$ Mn) Comparison by Country (2016-2032)
- Table 89: Latin America Dredging Market Revenue (US$ Mn) (2016-2032)
- Table 90: Latin America Dredging Market Revenue (US$ Mn) Comparison by Country (2016-2032)
- Table 91: Latin America Dredging Market Revenue (US$ Mn) Comparison by By Dredging Method (2016-2032)
- Table 92: Latin America Dredging Market Revenue (US$ Mn) Comparison by By Application (2016-2032)
- Table 93: Latin America Dredging Market Revenue (US$ Mn) Comparison by By End-User (2016-2032)
- Table 94: Latin America Dredging Market Y-o-Y Growth Rate Comparison by Country (2016-2032)
- Table 95: Latin America Dredging Market Y-o-Y Growth Rate Comparison by By Dredging Method (2016-2032)
- Table 96: Latin America Dredging Market Y-o-Y Growth Rate Comparison by By Application (2016-2032)
- Table 97: Latin America Dredging Market Y-o-Y Growth Rate Comparison by By End-User (2016-2032)
- Table 98: Latin America Dredging Market Share Comparison by Country (2016-2032)
- Table 99: Latin America Dredging Market Share Comparison by By Dredging Method (2016-2032)
- Table 100: Latin America Dredging Market Share Comparison by By Application (2016-2032)
- Table 101: Latin America Dredging Market Share Comparison by By End-User (2016-2032)
- Table 102: Middle East & Africa Dredging Market Comparison by By Dredging Method (2016-2032)
- Table 103: Middle East & Africa Dredging Market Comparison by By Application (2016-2032)
- Table 104: Middle East & Africa Dredging Market Comparison by By End-User (2016-2032)
- Table 105: Middle East & Africa Dredging Market Revenue (US$ Mn) Comparison by Country (2016-2032)
- Table 106: Middle East & Africa Dredging Market Revenue (US$ Mn) (2016-2032)
- Table 107: Middle East & Africa Dredging Market Revenue (US$ Mn) Comparison by Country (2016-2032)
- Table 108: Middle East & Africa Dredging Market Revenue (US$ Mn) Comparison by By Dredging Method (2016-2032)
- Table 109: Middle East & Africa Dredging Market Revenue (US$ Mn) Comparison by By Application (2016-2032)
- Table 110: Middle East & Africa Dredging Market Revenue (US$ Mn) Comparison by By End-User (2016-2032)
- Table 111: Middle East & Africa Dredging Market Y-o-Y Growth Rate Comparison by Country (2016-2032)
- Table 112: Middle East & Africa Dredging Market Y-o-Y Growth Rate Comparison by By Dredging Method (2016-2032)
- Table 113: Middle East & Africa Dredging Market Y-o-Y Growth Rate Comparison by By Application (2016-2032)
- Table 114: Middle East & Africa Dredging Market Y-o-Y Growth Rate Comparison by By End-User (2016-2032)
- Table 115: Middle East & Africa Dredging Market Share Comparison by Country (2016-2032)
- Table 116: Middle East & Africa Dredging Market Share Comparison by By Dredging Method (2016-2032)
- Table 117: Middle East & Africa Dredging Market Share Comparison by By Application (2016-2032)
- Table 118: Middle East & Africa Dredging Market Share Comparison by By End-User (2016-2032)
- 1. Executive Summary
-
- DEME Group
- Great Lakes Dredge & Dock Corporation
- National Marine Dredging Company
- Hyundai Engineering & Construction
- Manson Construction Co.
- Jan De Nul Group
- Boskalis
- Royal Van Oord
- Weeks Marine
- Royal IHC
- Other
Our Clients


View Our Licence Options
