
Disease Prevention Market By Stage (Primary Stage, Secondary Stage, and Tertiary Stage), By Prevention, By End-User, By Region and Companies - Industry Segment Outlook, Market Assessment, Competition Scenario, Trends, and Forecast 2023-2032
-
40240
-
July 2023
-
137
-


-
This report was compiled by Correspondence Linkedin | Detailed Market research Methodology Our methodology involves a mix of primary research, including interviews with leading mental health experts, and secondary research from reputable medical journals and databases. View Detailed Methodology Page
-
Quick Navigation
Report Overview
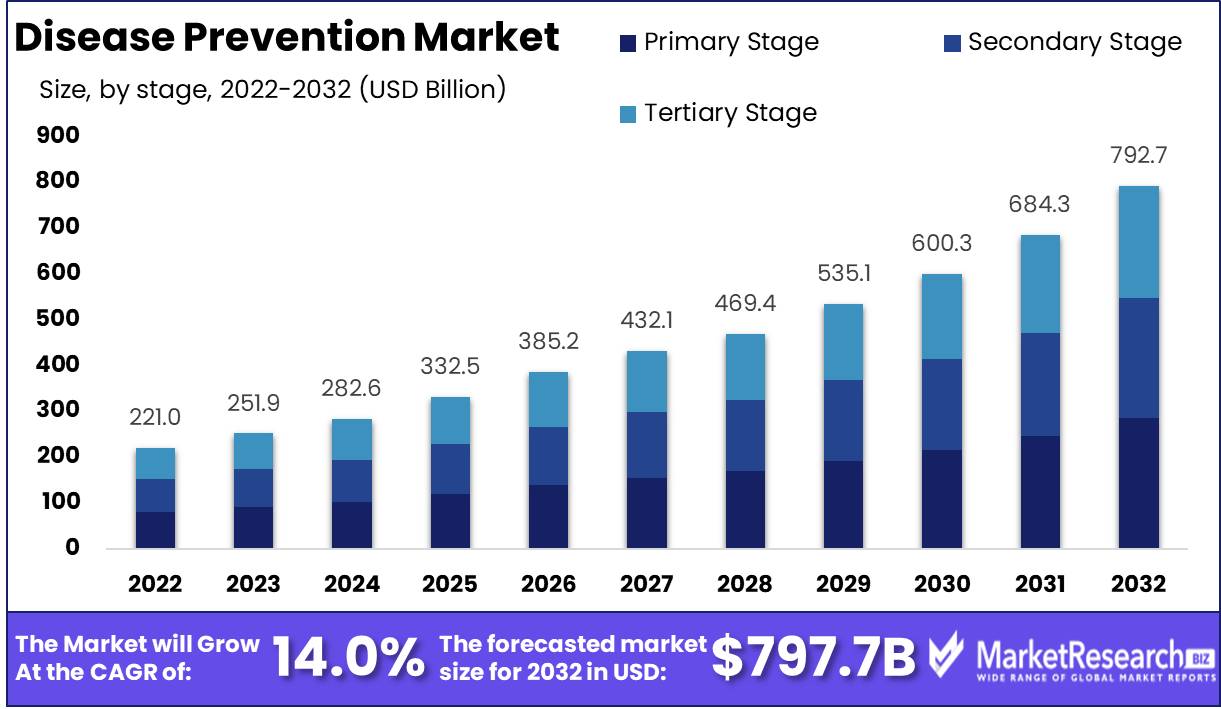
Disease Prevention Market size is expected to be worth around USD 792.7 Bn by 2032 from USD 221.0 Bn in 2022, growing at a CAGR of 14.0% during the forecast period from 2023 to 2032.
Disease prevention involves actions to reduce or eliminate exposure to risk that might increase the chances that an individual or group will incur disease, disability, or premature health. Preventing diseases through routine vaccination helps in improving health and economic stability. Increasing investments in immunization in low-middle countries could avert up to 36 million deaths and 24 million cases of poverty due to medical costs. The need for disease prevention is increasing in middle economies.
The national prevention activities include initiatives, regulatory programs, and policies such as National Tobacco Control Program and National Asthma Control Program that reduce exposure to harmful agents in the environment.
Driving factors
Health benefits of vaccination and increasing prevalence of chronic diseases driving the need for disease prevention
The rising prevalence of chronic diseases and the increasing geriatric population drive the need for preventive healthcare for the well-being of individuals. The vaccines provide immunity to fight against probable infections and help in improving the immune system. The diseases such as rabies, polio, tuberculosis, and smallpox have been prevented by vaccination. The demand for vaccination is more in children as their immune system is not fully developed. Vaccination helps in fighting against viruses and diseases by improving immune health.
Immunization is a key component of primary health care for well-being. The Flu vaccine is especially important for people with chronic health conditions, adults, and pregnant women. Most of the diseases, such as cancer, can be cured by detecting them in the early phase. The inventions in the healthcare field, such as gene sequencing, are capable of detecting the chances of disease occurrence in the early stage. Also, the use of Artificial Intelligence (AI) in the healthcare field helps healthcare professionals in the diagnosis of chronic diseases and surgery.
Restraining Factors
Lack of awareness and high services costs hampering the growth of the global disease prevention market
Disease prevention services are extremely helpful for the well-being of individuals, peoples are unaware of the concept, and its health benefits have a negative impact on market growth. The high cost of prevention, not having primary care providers, and lack of prevention services also have a negative impact on disease prevention market growth. Using fear arousal method prevention raises major ethical consideration issues. Not all preventive healthcare services are assessable to everybody, also restraining the development of the disease prevention market.
Stage Analysis
The primary stage segment has the largest market revenue share, with 36%
Based on the prevention stage, the disease prevention market is classified into primary stage, secondary stage, and tertiary stage. The primary stage prevention segment was dominant in the market, with the largest market revenue share of 36% in 2022. The growth of the segment is propelled by increasing governmental policies to minimize the harmful substances in the environment that cause diseases.
It prevents diseases or injury before it occurs. The primary benefit of primary prevention care intervention is the possibility of detecting early signs of diseases in a timely manner in order to allow diagnosis and management. The secondary stage prevention segment is expected to grow at the fastest CAGR during the forecast period owing to the increasing prevalence of chronic diseases and their diagnosis.
The secondary stage detects the diseases in its earliest stage, making treatment and diagnosis more effective. For example, mammograms to detect breast cancer, low-dose aspirin, and diet & exercise programs to prevent further heart attacks are coming under secondary prevention. Also, the use of external and internal condoms is an example of Multipurpose Prevention Technologies (MPTs) because they are effective in preventing STI and HIV transmission. Secondary prevention helps in preventing heart attack and stroke through drug therapy and counseling for high-risk individuals such as cardiovascular diseases (CVD).
Prevention Analysis
The vaccination segment is dominant in the disease prevention market.
By prevention method, the disease prevention market is classified into obesity prevention, sexually transmitted infections, chronic diseases prevention, cancer prevention, thrombosis prevention, vaccination, and other preventions. The vaccination prevention method was dominant in the market, with a significant market revenue share of 30% in 2022.
Vaccination is a primary prevention method that limits risk exposure and helps in improving the immunity of individuals to prevent the risk of diseases. Many infectious diseases can be prevented by using vaccination. Vaccination creates protective antibodies, such as protein, that help fight against infectious bacteria. The need for regular vaccination is increasing to keep children healthy, prevent outbreaks, and prevent the spreading of infectious diseases.
During the COVID-19 pandemic, the whole world was fighting against coronavirus. The governments started policies of vaccination to prevent the spreading of COVID-19. Baby’s immune system is not fully developed at birth, so they face a high risk of becoming infected and getting ill. The vaccines in babies improve the immune system of babies and build their natural defense. The chronic disease prevention segment is expected to grow at the fastest CAGR during the forecast period due to the increasing prevalence of chronic diseases with an increasing geriatric population. Prevention of chronic diseases can be done by avoiding the consumption of tobacco and alcohol.
End-User Analysis
The hospital segment is dominant, with a significant disease prevention market revenue share.
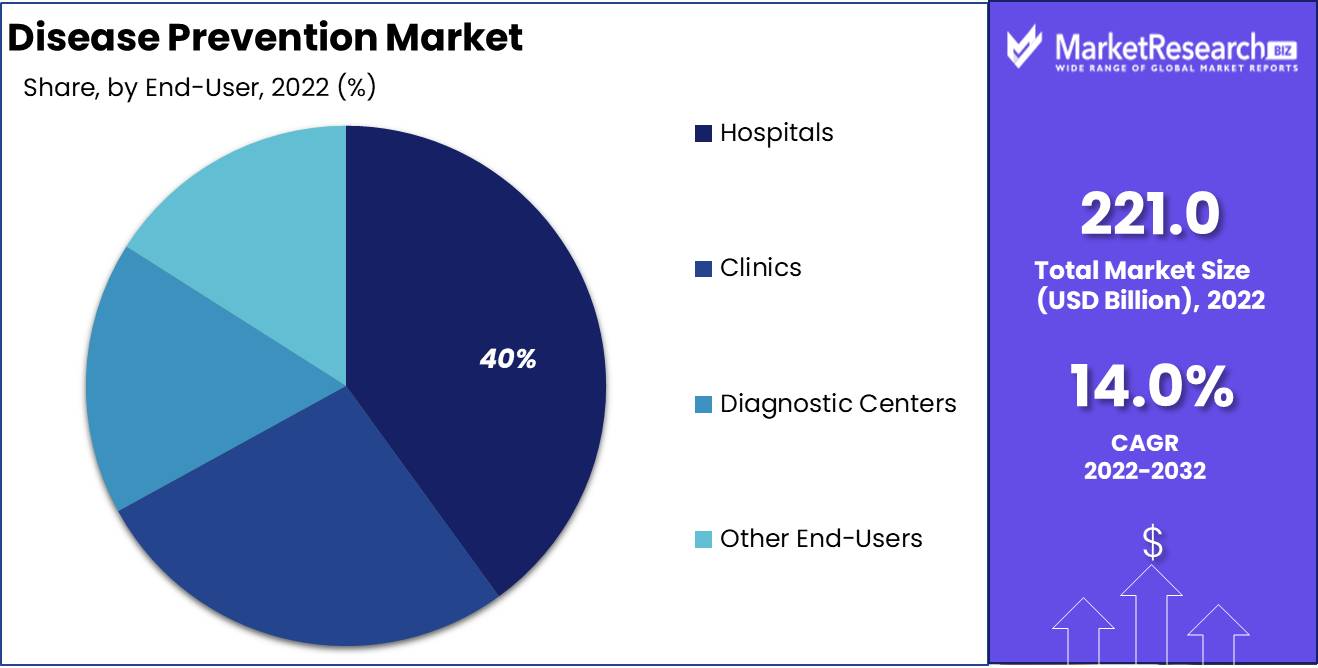
Based on end-user, the disease prevention market is classified into hospitals, clinics, diagnostic centers, and other end-users. The hospital segment was dominant in the disease prevention market, with the largest revenue share of 40% in 2022. Healthcare professionals in hospitals worldwide develop strategies and implementation of policies that protect immunocompromised in order to keep susceptible patients safe from healthcare-associated infections (HAIs).
Hospitals worldwide focus on public health surveillance to prevent the spreading of diseases. PPE, such as masks, goggles, and gowns, provide a physical barrier that prevents the hands, skin, nose, and mouth from coming in contact with infectious agents. Detecting viral antigen, immunoglobulin G (IgG), and IgM antibody prevention in diagnostic laboratories can be made using enzyme immunoassay testing. This is an essential element of disease surveillance for routine confirmation of infections and rapid identification of causes of outbreaks and epidemics.
Key Market Segments
By Stage
- Primary Stage
- Secondary Stage
- Tertiary Stage
By Prevention
- Obesity Prevention
- Sexually Transmitted Diseases
- Chronic Diseases Prevention
- Cancer Prevention
- Thrombosis Prevention
- Vaccination
- Other Preventions
By End-User
- Hospitals
- Clinics
- Diagnostic Centers
- Other End-Users
Growth Opportunity
Increasing research activities in the healthcare sector expected to create lucrative growth opportunities in the disease prevention market
The demand for disease prevention is increasing in middle-income countries, driving the need for disease prevention methods. Medical errors in hospitals cause a number of deaths. Preventive healthcare methods in hospitals help in avoiding errors in treatment. The research institutes and laboratories are focusing on next-generation sequencing techniques for rapid access to diseases and their treatment.
Governmental initiatives in several countries are implementing vaccination policies to prevent the spreading of diseases. This is expected to create lucrative growth opportunities in the global disease prevention market.
Latest Trends
Governmental bodies investing more and more in healthcare services
The governmental bodies in several countries announced that vaccination in babies of 1 to 2 months is mandatory to prevent diseases. Governments provide vaccines such as hepatitis B, diphtheria, tetanus, and whooping cough in hospitals free of cost. They are investing more and more in healthcare services. Thus, startups in disease prevention are working on research and development activities. Also, automation in hospital pharmacies and clinical decision support systems is increasing.
Regional Analysis
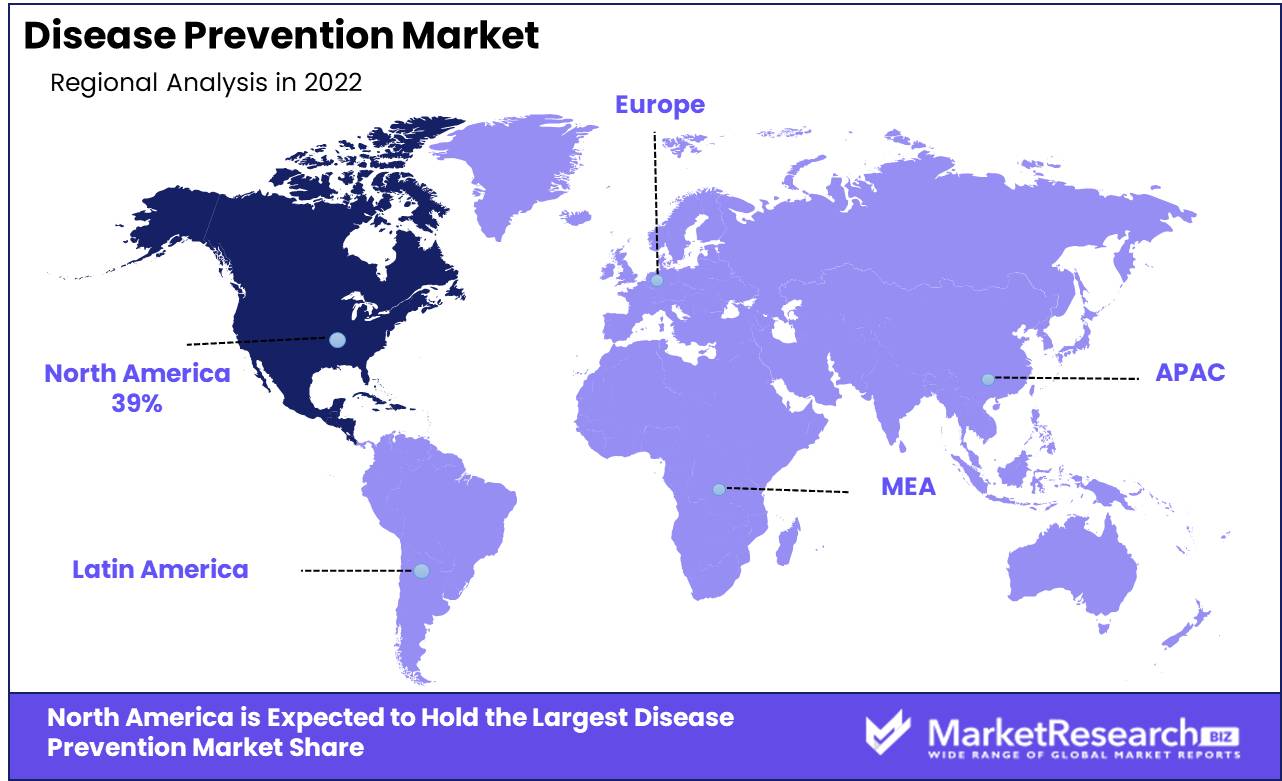
North America is dominant in the disease prevention market.
North America was dominant in the disease prevention market, with the largest revenue share of 39% in 2022. The growth of the region is attributed to increasing heart diseases, cancer, obesity, and Alzheimer’s diseases in the region. The regulatory bodies in North America implement health promotion and disease prevention programs that awaken people from sexually transmitted diseases.
Health promotion programs in North America are engaging and empowering individuals & communities to choose healthy behaviors and make changes that reduce the risk of developing chronic diseases. Asia Pacific is expected to grow at the fastest CAGR during the forecast period. The increasing chronic morbidity, loss of educational possibilities, and lack of awareness among individuals drive the need for disease prevention in the Asia Pacific.
Key Regions and Countries
North America
- US
- Canada
- Mexico
Western Europe
- Germany
- France
- The UK
- Spain
- Italy
- Portugal
- Ireland
- Austria
- Switzerland
- Benelux
- Nordic
- Rest of Western Europe
Eastern Europe
- Russia
- Poland
- The Czech Republic
- Greece
- Rest of Eastern Europe
APAC
- China
- Japan
- South Korea
- India
- Australia & New Zealand
- Indonesia
- Malaysia
- Philippines
- Singapore
- Thailand
- Vietnam
- Rest of APAC
Latin America
- Brazil
- Colombia
- Chile
- Argentina
- Costa Rica
- Rest of Latin America
Middle East & Africa
- Algeria
- Egypt
- Israel
- Kuwait
- Nigeria
- Saudi Arabia
- South Africa
- Turkey
- United Arab Emirates
- Rest of MEA
Key Players Analysis
The major key players in the disease prevention market are focusing on research and development activities. Key players are focusing on clinical research and drug discovery processes to detect and cure diseases. The top key players in the disease prevention market include Novartis AG, Edwards Lifesciences Corporation, Access Healthcare, Jazz Pharmaceuticals plc, Horizon Therapeutics Public Ltd Co., Penumbra, Inc., Carbon Health Inc., Accelerate Diagnostics, Inc., Medtronic, and Other Key Players.
Top Key Players in Disease Prevention Market
- Novartis AG
- Serum Institute of India Pvt. Ltd.
- Edwards Lifesciences Corporation
- Access Healthcare
- Jazz Pharmaceuticals plc
- Horizon Therapeutics Public Ltd Co.
- Penumbra, Inc.
- Carbon Health Inc.
- Accelerate Diagnostics, Inc.
- Medtronic Plc.
- Other Key Players
Recent Development
- In October 2022, Medtronic Plc. announced that it would work with GE Healthcare to support needs and care demands at Ambulatory Surgery Centers.
- In October 2020, Novartis AG developed therapeutic drugs to combat COVID-19.
- In 2020, The Serum Institute of India Pvt. Ltd. was the world’s largest vaccine producer by number of doses produced, manufacturing about 1.5 billion doses of vaccines per year.
Report Scope:
Report Features Description Market Value (2022) USD 221.0 Bn Forecast Revenue (2032) USD 792.7 Bn CAGR (2023-2032) 14.0% Base Year for Estimation 2022 Historic Period 2016-2022 Forecast Period 2023-2032 Report Coverage Revenue Forecast, Market Dynamics, COVID-19 Impact, Competitive Landscape, Recent Developments Segments Covered By Stage- Primary Stage, Secondary Stage, and Tertiary Stage; By Prevention- Obesity Prevention, Sexually Transmitted Diseases, Chronic Diseases Prevention, Cancer Prevention, Thrombosis Prevention, Vaccination, and Other Preventions; By End-User- Hospitals, Clinics, Diagnostic Centers, and Other End-Users Regional Analysis North America – The US, Canada, & Mexico; Western Europe – Germany, France, The UK, Spain, Italy, Portugal, Ireland, Austria, Switzerland, Benelux, Nordic, & Rest of Western Europe; Eastern Europe – Russia, Poland, The Czech Republic, Greece, & Rest of Eastern Europe; APAC – China, Japan, South Korea, India, Australia & New Zealand, Indonesia, Malaysia, Philippines, Singapore, Thailand, Vietnam, & Rest of APAC; Latin America – Brazil, Colombia, Chile, Argentina, Costa Rica, & Rest of Latin America; Middle East & Africa – Algeria, Egypt, Israel, Kuwait, Nigeria, Saudi Arabia, South Africa, Turkey, United Arab Emirates, & Rest of MEA Competitive Landscape Novartis AG, Serum Institute of India Pvt. Ltd., Edwards Lifesciences Corporation, Access Healthcare, Jazz Pharmaceuticals plc, Horizon Therapeutics Public Ltd Co., Penumbra, Inc., Carbon Health Inc., Accelerate Diagnostics, Inc., Medtronic, and Other Key Players. Customization Scope Customization for segments, region/country-level will be provided. Moreover, additional customization can be done based on the requirements. Purchase Options We have three licenses to opt for: Single User License, Multi-User License (Up to 5 Users), Corporate Use License (Unlimited User and Printable PDF) -
- 1. Executive Summary
- 1.1. Definition
- 1.2. Taxonomy
- 1.3. Research Scope
- 1.4. Key Analysis
- 1.5. Key Findings by Major Segments
- 1.6. Top strategies by Major Players
- 2. Global Disease Prevention Market Overview
- 2.1. Disease Prevention Market Dynamics
- 2.1.1. Drivers
- 2.1.2. Opportunities
- 2.1.3. Restraints
- 2.1.4. Challenges
- 2.2. Macro-economic Factors
- 2.3. Regulatory Framework
- 2.4. Market Investment Feasibility Index
- 2.5. PEST Analysis
- 2.6. PORTER’S Five Force Analysis
- 2.7. Drivers & Restraints Impact Analysis
- 2.8. Industry Chain Analysis
- 2.9. Cost Structure Analysis
- 2.10. Marketing Strategy
- 2.11. Russia-Ukraine War Impact Analysis
- 2.12. Opportunity Map Analysis
- 2.13. Market Competition Scenario Analysis
- 2.14. Product Life Cycle Analysis
- 2.15. Opportunity Orbits
- 2.16. Manufacturer Intensity Map
- 2.17. Major Companies sales by Value & Volume
- 2.1. Disease Prevention Market Dynamics
- 3. Global Disease Prevention Market Analysis, Opportunity and Forecast, 2016-2032
- 3.1. Global Disease Prevention Market Analysis, 2016-2021
- 3.2. Global Disease Prevention Market Opportunity and Forecast, 2023-2032
- 3.3. Global Disease Prevention Market Analysis, Opportunity and Forecast, By Stage, 2016-2032
- 3.3.1. Global Disease Prevention Market Analysis by Stage: Introduction
- 3.3.2. Market Size Absolute $ Opportunity Analysis and Forecast, By Stage, 2016-2032
- 3.3.3. Primary Stage
- 3.3.4. Secondary Stage
- 3.3.5. Tertiary Stage
- 3.4. Global Disease Prevention Market Analysis, Opportunity and Forecast, By Prevention, 2016-2032
- 3.4.1. Global Disease Prevention Market Analysis by Prevention: Introduction
- 3.4.2. Market Size Absolute $ Opportunity Analysis and Forecast, By Prevention, 2016-2032
- 3.4.3. Obesity Prevention
- 3.4.4. Sexually Transmitted Diseases
- 3.4.5. Chronic Diseases Prevention
- 3.4.6. Cancer Prevention
- 3.4.7. Thrombosis Prevention
- 3.4.8. Vaccination
- 3.4.9. Other Preventions
- 3.5. Global Disease Prevention Market Analysis, Opportunity and Forecast, By End-User, 2016-2032
- 3.5.1. Global Disease Prevention Market Analysis by End-User: Introduction
- 3.5.2. Market Size Absolute $ Opportunity Analysis and Forecast, By End-User, 2016-2032
- 3.5.3. Hospitals
- 3.5.4. Clinics
- 3.5.5. Diagnostic Centers
- 3.5.6. Other End-Users
- 4. North America Disease Prevention Market Analysis, Opportunity and Forecast, 2016-2032
- 4.1. North America Disease Prevention Market Analysis, 2016-2021
- 4.2. North America Disease Prevention Market Opportunity and Forecast, 2023-2032
- 4.3. North America Disease Prevention Market Analysis, Opportunity and Forecast, By Stage, 2016-2032
- 4.3.1. North America Disease Prevention Market Analysis by Stage: Introduction
- 4.3.2. Market Size Absolute $ Opportunity Analysis and Forecast, By Stage, 2016-2032
- 4.3.3. Primary Stage
- 4.3.4. Secondary Stage
- 4.3.5. Tertiary Stage
- 4.4. North America Disease Prevention Market Analysis, Opportunity and Forecast, By Prevention, 2016-2032
- 4.4.1. North America Disease Prevention Market Analysis by Prevention: Introduction
- 4.4.2. Market Size Absolute $ Opportunity Analysis and Forecast, By Prevention, 2016-2032
- 4.4.3. Obesity Prevention
- 4.4.4. Sexually Transmitted Diseases
- 4.4.5. Chronic Diseases Prevention
- 4.4.6. Cancer Prevention
- 4.4.7. Thrombosis Prevention
- 4.4.8. Vaccination
- 4.4.9. Other Preventions
- 4.5. North America Disease Prevention Market Analysis, Opportunity and Forecast, By End-User, 2016-2032
- 4.5.1. North America Disease Prevention Market Analysis by End-User: Introduction
- 4.5.2. Market Size Absolute $ Opportunity Analysis and Forecast, By End-User, 2016-2032
- 4.5.3. Hospitals
- 4.5.4. Clinics
- 4.5.5. Diagnostic Centers
- 4.5.6. Other End-Users
- 4.6. North America Disease Prevention Market Analysis, Opportunity and Forecast, By Country , 2016-2032
- 4.6.1. North America Disease Prevention Market Analysis by Country : Introduction
- 4.6.2. Market Size Absolute $ Opportunity Analysis and Forecast, Country , 2016-2032
- 4.6.2.1. The US
- 4.6.2.2. Canada
- 4.6.2.3. Mexico
- 5. Western Europe Disease Prevention Market Analysis, Opportunity and Forecast, 2016-2032
- 5.1. Western Europe Disease Prevention Market Analysis, 2016-2021
- 5.2. Western Europe Disease Prevention Market Opportunity and Forecast, 2023-2032
- 5.3. Western Europe Disease Prevention Market Analysis, Opportunity and Forecast, By Stage, 2016-2032
- 5.3.1. Western Europe Disease Prevention Market Analysis by Stage: Introduction
- 5.3.2. Market Size Absolute $ Opportunity Analysis and Forecast, By Stage, 2016-2032
- 5.3.3. Primary Stage
- 5.3.4. Secondary Stage
- 5.3.5. Tertiary Stage
- 5.4. Western Europe Disease Prevention Market Analysis, Opportunity and Forecast, By Prevention, 2016-2032
- 5.4.1. Western Europe Disease Prevention Market Analysis by Prevention: Introduction
- 5.4.2. Market Size Absolute $ Opportunity Analysis and Forecast, By Prevention, 2016-2032
- 5.4.3. Obesity Prevention
- 5.4.4. Sexually Transmitted Diseases
- 5.4.5. Chronic Diseases Prevention
- 5.4.6. Cancer Prevention
- 5.4.7. Thrombosis Prevention
- 5.4.8. Vaccination
- 5.4.9. Other Preventions
- 5.5. Western Europe Disease Prevention Market Analysis, Opportunity and Forecast, By End-User, 2016-2032
- 5.5.1. Western Europe Disease Prevention Market Analysis by End-User: Introduction
- 5.5.2. Market Size Absolute $ Opportunity Analysis and Forecast, By End-User, 2016-2032
- 5.5.3. Hospitals
- 5.5.4. Clinics
- 5.5.5. Diagnostic Centers
- 5.5.6. Other End-Users
- 5.6. Western Europe Disease Prevention Market Analysis, Opportunity and Forecast, By Country , 2016-2032
- 5.6.1. Western Europe Disease Prevention Market Analysis by Country : Introduction
- 5.6.2. Market Size Absolute $ Opportunity Analysis and Forecast, Country , 2016-2032
- 5.6.2.1. Germany
- 5.6.2.2. France
- 5.6.2.3. The UK
- 5.6.2.4. Spain
- 5.6.2.5. Italy
- 5.6.2.6. Portugal
- 5.6.2.7. Ireland
- 5.6.2.8. Austria
- 5.6.2.9. Switzerland
- 5.6.2.10. Benelux
- 5.6.2.11. Nordic
- 5.6.2.12. Rest of Western Europe
- 6. Eastern Europe Disease Prevention Market Analysis, Opportunity and Forecast, 2016-2032
- 6.1. Eastern Europe Disease Prevention Market Analysis, 2016-2021
- 6.2. Eastern Europe Disease Prevention Market Opportunity and Forecast, 2023-2032
- 6.3. Eastern Europe Disease Prevention Market Analysis, Opportunity and Forecast, By Stage, 2016-2032
- 6.3.1. Eastern Europe Disease Prevention Market Analysis by Stage: Introduction
- 6.3.2. Market Size Absolute $ Opportunity Analysis and Forecast, By Stage, 2016-2032
- 6.3.3. Primary Stage
- 6.3.4. Secondary Stage
- 6.3.5. Tertiary Stage
- 6.4. Eastern Europe Disease Prevention Market Analysis, Opportunity and Forecast, By Prevention, 2016-2032
- 6.4.1. Eastern Europe Disease Prevention Market Analysis by Prevention: Introduction
- 6.4.2. Market Size Absolute $ Opportunity Analysis and Forecast, By Prevention, 2016-2032
- 6.4.3. Obesity Prevention
- 6.4.4. Sexually Transmitted Diseases
- 6.4.5. Chronic Diseases Prevention
- 6.4.6. Cancer Prevention
- 6.4.7. Thrombosis Prevention
- 6.4.8. Vaccination
- 6.4.9. Other Preventions
- 6.5. Eastern Europe Disease Prevention Market Analysis, Opportunity and Forecast, By End-User, 2016-2032
- 6.5.1. Eastern Europe Disease Prevention Market Analysis by End-User: Introduction
- 6.5.2. Market Size Absolute $ Opportunity Analysis and Forecast, By End-User, 2016-2032
- 6.5.3. Hospitals
- 6.5.4. Clinics
- 6.5.5. Diagnostic Centers
- 6.5.6. Other End-Users
- 6.6. Eastern Europe Disease Prevention Market Analysis, Opportunity and Forecast, By Country , 2016-2032
- 6.6.1. Eastern Europe Disease Prevention Market Analysis by Country : Introduction
- 6.6.2. Market Size Absolute $ Opportunity Analysis and Forecast, Country , 2016-2032
- 6.6.2.1. Russia
- 6.6.2.2. Poland
- 6.6.2.3. The Czech Republic
- 6.6.2.4. Greece
- 6.6.2.5. Rest of Eastern Europe
- 7. APAC Disease Prevention Market Analysis, Opportunity and Forecast, 2016-2032
- 7.1. APAC Disease Prevention Market Analysis, 2016-2021
- 7.2. APAC Disease Prevention Market Opportunity and Forecast, 2023-2032
- 7.3. APAC Disease Prevention Market Analysis, Opportunity and Forecast, By Stage, 2016-2032
- 7.3.1. APAC Disease Prevention Market Analysis by Stage: Introduction
- 7.3.2. Market Size Absolute $ Opportunity Analysis and Forecast, By Stage, 2016-2032
- 7.3.3. Primary Stage
- 7.3.4. Secondary Stage
- 7.3.5. Tertiary Stage
- 7.4. APAC Disease Prevention Market Analysis, Opportunity and Forecast, By Prevention, 2016-2032
- 7.4.1. APAC Disease Prevention Market Analysis by Prevention: Introduction
- 7.4.2. Market Size Absolute $ Opportunity Analysis and Forecast, By Prevention, 2016-2032
- 7.4.3. Obesity Prevention
- 7.4.4. Sexually Transmitted Diseases
- 7.4.5. Chronic Diseases Prevention
- 7.4.6. Cancer Prevention
- 7.4.7. Thrombosis Prevention
- 7.4.8. Vaccination
- 7.4.9. Other Preventions
- 7.5. APAC Disease Prevention Market Analysis, Opportunity and Forecast, By End-User, 2016-2032
- 7.5.1. APAC Disease Prevention Market Analysis by End-User: Introduction
- 7.5.2. Market Size Absolute $ Opportunity Analysis and Forecast, By End-User, 2016-2032
- 7.5.3. Hospitals
- 7.5.4. Clinics
- 7.5.5. Diagnostic Centers
- 7.5.6. Other End-Users
- 7.6. APAC Disease Prevention Market Analysis, Opportunity and Forecast, By Country , 2016-2032
- 7.6.1. APAC Disease Prevention Market Analysis by Country : Introduction
- 7.6.2. Market Size Absolute $ Opportunity Analysis and Forecast, Country , 2016-2032
- 7.6.2.1. China
- 7.6.2.2. Japan
- 7.6.2.3. South Korea
- 7.6.2.4. India
- 7.6.2.5. Australia & New Zeland
- 7.6.2.6. Indonesia
- 7.6.2.7. Malaysia
- 7.6.2.8. Philippines
- 7.6.2.9. Singapore
- 7.6.2.10. Thailand
- 7.6.2.11. Vietnam
- 7.6.2.12. Rest of APAC
- 8. Latin America Disease Prevention Market Analysis, Opportunity and Forecast, 2016-2032
- 8.1. Latin America Disease Prevention Market Analysis, 2016-2021
- 8.2. Latin America Disease Prevention Market Opportunity and Forecast, 2023-2032
- 8.3. Latin America Disease Prevention Market Analysis, Opportunity and Forecast, By Stage, 2016-2032
- 8.3.1. Latin America Disease Prevention Market Analysis by Stage: Introduction
- 8.3.2. Market Size Absolute $ Opportunity Analysis and Forecast, By Stage, 2016-2032
- 8.3.3. Primary Stage
- 8.3.4. Secondary Stage
- 8.3.5. Tertiary Stage
- 8.4. Latin America Disease Prevention Market Analysis, Opportunity and Forecast, By Prevention, 2016-2032
- 8.4.1. Latin America Disease Prevention Market Analysis by Prevention: Introduction
- 8.4.2. Market Size Absolute $ Opportunity Analysis and Forecast, By Prevention, 2016-2032
- 8.4.3. Obesity Prevention
- 8.4.4. Sexually Transmitted Diseases
- 8.4.5. Chronic Diseases Prevention
- 8.4.6. Cancer Prevention
- 8.4.7. Thrombosis Prevention
- 8.4.8. Vaccination
- 8.4.9. Other Preventions
- 8.5. Latin America Disease Prevention Market Analysis, Opportunity and Forecast, By End-User, 2016-2032
- 8.5.1. Latin America Disease Prevention Market Analysis by End-User: Introduction
- 8.5.2. Market Size Absolute $ Opportunity Analysis and Forecast, By End-User, 2016-2032
- 8.5.3. Hospitals
- 8.5.4. Clinics
- 8.5.5. Diagnostic Centers
- 8.5.6. Other End-Users
- 8.6. Latin America Disease Prevention Market Analysis, Opportunity and Forecast, By Country , 2016-2032
- 8.6.1. Latin America Disease Prevention Market Analysis by Country : Introduction
- 8.6.2. Market Size Absolute $ Opportunity Analysis and Forecast, Country , 2016-2032
- 8.6.2.1. Brazil
- 8.6.2.2. Colombia
- 8.6.2.3. Chile
- 8.6.2.4. Argentina
- 8.6.2.5. Costa Rica
- 8.6.2.6. Rest of Latin America
- 9. Middle East & Africa Disease Prevention Market Analysis, Opportunity and Forecast, 2016-2032
- 9.1. Middle East & Africa Disease Prevention Market Analysis, 2016-2021
- 9.2. Middle East & Africa Disease Prevention Market Opportunity and Forecast, 2023-2032
- 9.3. Middle East & Africa Disease Prevention Market Analysis, Opportunity and Forecast, By Stage, 2016-2032
- 9.3.1. Middle East & Africa Disease Prevention Market Analysis by Stage: Introduction
- 9.3.2. Market Size Absolute $ Opportunity Analysis and Forecast, By Stage, 2016-2032
- 9.3.3. Primary Stage
- 9.3.4. Secondary Stage
- 9.3.5. Tertiary Stage
- 9.4. Middle East & Africa Disease Prevention Market Analysis, Opportunity and Forecast, By Prevention, 2016-2032
- 9.4.1. Middle East & Africa Disease Prevention Market Analysis by Prevention: Introduction
- 9.4.2. Market Size Absolute $ Opportunity Analysis and Forecast, By Prevention, 2016-2032
- 9.4.3. Obesity Prevention
- 9.4.4. Sexually Transmitted Diseases
- 9.4.5. Chronic Diseases Prevention
- 9.4.6. Cancer Prevention
- 9.4.7. Thrombosis Prevention
- 9.4.8. Vaccination
- 9.4.9. Other Preventions
- 9.5. Middle East & Africa Disease Prevention Market Analysis, Opportunity and Forecast, By End-User, 2016-2032
- 9.5.1. Middle East & Africa Disease Prevention Market Analysis by End-User: Introduction
- 9.5.2. Market Size Absolute $ Opportunity Analysis and Forecast, By End-User, 2016-2032
- 9.5.3. Hospitals
- 9.5.4. Clinics
- 9.5.5. Diagnostic Centers
- 9.5.6. Other End-Users
- 9.6. Middle East & Africa Disease Prevention Market Analysis, Opportunity and Forecast, By Country , 2016-2032
- 9.6.1. Middle East & Africa Disease Prevention Market Analysis by Country : Introduction
- 9.6.2. Market Size Absolute $ Opportunity Analysis and Forecast, Country , 2016-2032
- 9.6.2.1. Algeria
- 9.6.2.2. Egypt
- 9.6.2.3. Israel
- 9.6.2.4. Kuwait
- 9.6.2.5. Nigeria
- 9.6.2.6. Saudi Arabia
- 9.6.2.7. South Africa
- 9.6.2.8. Turkey
- 9.6.2.9. The UAE
- 9.6.2.10. Rest of MEA
- 10. Global Disease Prevention Market Analysis, Opportunity and Forecast, By Region , 2016-2032
- 10.1. Global Disease Prevention Market Analysis by Region : Introduction
- 10.2. Market Size Absolute $ Opportunity Analysis and Forecast, By Region , 2016-2032
- 10.2.1. North America
- 10.2.2. Western Europe
- 10.2.3. Eastern Europe
- 10.2.4. APAC
- 10.2.5. Latin America
- 10.2.6. Middle East & Africa
- 11. Global Disease Prevention Market Competitive Landscape, Market Share Analysis, and Company Profiles
- 11.1. Market Share Analysis
- 11.2. Company Profiles
- 11.3. Novartis AG
- 11.3.1. Company Overview
- 11.3.2. Financial Highlights
- 11.3.3. Product Portfolio
- 11.3.4. SWOT Analysis
- 11.3.5. Key Strategies and Developments
- 11.4. Edwards Lifesciences Corporation
- 11.4.1. Company Overview
- 11.4.2. Financial Highlights
- 11.4.3. Product Portfolio
- 11.4.4. SWOT Analysis
- 11.4.5. Key Strategies and Developments
- 11.5. Access Healthcare
- 11.5.1. Company Overview
- 11.5.2. Financial Highlights
- 11.5.3. Product Portfolio
- 11.5.4. SWOT Analysis
- 11.5.5. Key Strategies and Developments
- 11.6. Jazz Pharmaceuticals plc
- 11.6.1. Company Overview
- 11.6.2. Financial Highlights
- 11.6.3. Product Portfolio
- 11.6.4. SWOT Analysis
- 11.6.5. Key Strategies and Developments
- 11.7. Horizon Therapeutics Public Ltd Co.
- 11.7.1. Company Overview
- 11.7.2. Financial Highlights
- 11.7.3. Product Portfolio
- 11.7.4. SWOT Analysis
- 11.7.5. Key Strategies and Developments
- 11.8. Penumbra, Inc.
- 11.8.1. Company Overview
- 11.8.2. Financial Highlights
- 11.8.3. Product Portfolio
- 11.8.4. SWOT Analysis
- 11.8.5. Key Strategies and Developments
- 11.9. Carbon Health Inc.
- 11.9.1. Company Overview
- 11.9.2. Financial Highlights
- 11.9.3. Product Portfolio
- 11.9.4. SWOT Analysis
- 11.9.5. Key Strategies and Developments
- 11.10. Accelerate Diagnostics, Inc.
- 11.10.1. Company Overview
- 11.10.2. Financial Highlights
- 11.10.3. Product Portfolio
- 11.10.4. SWOT Analysis
- 11.10.5. Key Strategies and Developments
- 11.11. Medtronic
- 11.11.1. Company Overview
- 11.11.2. Financial Highlights
- 11.11.3. Product Portfolio
- 11.11.4. SWOT Analysis
- 11.11.5. Key Strategies and Developments
- 11.12. Other Key Players
- 11.12.1. Company Overview
- 11.12.2. Financial Highlights
- 11.12.3. Product Portfolio
- 11.12.4. SWOT Analysis
- 11.12.5. Key Strategies and Developments
- 12. Assumptions and Acronyms
- 13. Research Methodology
- 14. Contact
- List of Figures
- Figure 1: Global Disease Prevention Market Revenue (US$ Mn) Market Share by Stage in 2022
- Figure 2: Global Disease Prevention Market Attractiveness Analysis by Stage, 2016-2032
- Figure 3: Global Disease Prevention Market Revenue (US$ Mn) Market Share by Preventionin 2022
- Figure 4: Global Disease Prevention Market Attractiveness Analysis by Prevention, 2016-2032
- Figure 5: Global Disease Prevention Market Revenue (US$ Mn) Market Share by End-Userin 2022
- Figure 6: Global Disease Prevention Market Attractiveness Analysis by End-User, 2016-2032
- Figure 7: Global Disease Prevention Market Revenue (US$ Mn) Market Share by Region in 2022
- Figure 8: Global Disease Prevention Market Attractiveness Analysis by Region, 2016-2032
- Figure 9: Global Disease Prevention Market Revenue (US$ Mn) (2016-2032)
- Figure 10: Global Disease Prevention Market Revenue (US$ Mn) Comparison by Region (2016-2032)
- Figure 11: Global Disease Prevention Market Revenue (US$ Mn) Comparison by Stage (2016-2032)
- Figure 12: Global Disease Prevention Market Revenue (US$ Mn) Comparison by Prevention (2016-2032)
- Figure 13: Global Disease Prevention Market Revenue (US$ Mn) Comparison by End-User (2016-2032)
- Figure 14: Global Disease Prevention Market Y-o-Y Growth Rate Comparison by Region (2016-2032)
- Figure 15: Global Disease Prevention Market Y-o-Y Growth Rate Comparison by Stage (2016-2032)
- Figure 16: Global Disease Prevention Market Y-o-Y Growth Rate Comparison by Prevention (2016-2032)
- Figure 17: Global Disease Prevention Market Y-o-Y Growth Rate Comparison by End-User (2016-2032)
- Figure 18: Global Disease Prevention Market Share Comparison by Region (2016-2032)
- Figure 19: Global Disease Prevention Market Share Comparison by Stage (2016-2032)
- Figure 20: Global Disease Prevention Market Share Comparison by Prevention (2016-2032)
- Figure 21: Global Disease Prevention Market Share Comparison by End-User (2016-2032)
- Figure 22: North America Disease Prevention Market Revenue (US$ Mn) Market Share by Stagein 2022
- Figure 23: North America Disease Prevention Market Attractiveness Analysis by Stage, 2016-2032
- Figure 24: North America Disease Prevention Market Revenue (US$ Mn) Market Share by Preventionin 2022
- Figure 25: North America Disease Prevention Market Attractiveness Analysis by Prevention, 2016-2032
- Figure 26: North America Disease Prevention Market Revenue (US$ Mn) Market Share by End-Userin 2022
- Figure 27: North America Disease Prevention Market Attractiveness Analysis by End-User, 2016-2032
- Figure 28: North America Disease Prevention Market Revenue (US$ Mn) Market Share by Country in 2022
- Figure 29: North America Disease Prevention Market Attractiveness Analysis by Country, 2016-2032
- Figure 30: North America Disease Prevention Market Revenue (US$ Mn) (2016-2032)
- Figure 31: North America Disease Prevention Market Revenue (US$ Mn) Comparison by Country (2016-2032)
- Figure 32: North America Disease Prevention Market Revenue (US$ Mn) Comparison by Stage (2016-2032)
- Figure 33: North America Disease Prevention Market Revenue (US$ Mn) Comparison by Prevention (2016-2032)
- Figure 34: North America Disease Prevention Market Revenue (US$ Mn) Comparison by End-User (2016-2032)
- Figure 35: North America Disease Prevention Market Y-o-Y Growth Rate Comparison by Country (2016-2032)
- Figure 36: North America Disease Prevention Market Y-o-Y Growth Rate Comparison by Stage (2016-2032)
- Figure 37: North America Disease Prevention Market Y-o-Y Growth Rate Comparison by Prevention (2016-2032)
- Figure 38: North America Disease Prevention Market Y-o-Y Growth Rate Comparison by End-User (2016-2032)
- Figure 39: North America Disease Prevention Market Share Comparison by Country (2016-2032)
- Figure 40: North America Disease Prevention Market Share Comparison by Stage (2016-2032)
- Figure 41: North America Disease Prevention Market Share Comparison by Prevention (2016-2032)
- Figure 42: North America Disease Prevention Market Share Comparison by End-User (2016-2032)
- Figure 43: Western Europe Disease Prevention Market Revenue (US$ Mn) Market Share by Stagein 2022
- Figure 44: Western Europe Disease Prevention Market Attractiveness Analysis by Stage, 2016-2032
- Figure 45: Western Europe Disease Prevention Market Revenue (US$ Mn) Market Share by Preventionin 2022
- Figure 46: Western Europe Disease Prevention Market Attractiveness Analysis by Prevention, 2016-2032
- Figure 47: Western Europe Disease Prevention Market Revenue (US$ Mn) Market Share by End-Userin 2022
- Figure 48: Western Europe Disease Prevention Market Attractiveness Analysis by End-User, 2016-2032
- Figure 49: Western Europe Disease Prevention Market Revenue (US$ Mn) Market Share by Country in 2022
- Figure 50: Western Europe Disease Prevention Market Attractiveness Analysis by Country, 2016-2032
- Figure 51: Western Europe Disease Prevention Market Revenue (US$ Mn) (2016-2032)
- Figure 52: Western Europe Disease Prevention Market Revenue (US$ Mn) Comparison by Country (2016-2032)
- Figure 53: Western Europe Disease Prevention Market Revenue (US$ Mn) Comparison by Stage (2016-2032)
- Figure 54: Western Europe Disease Prevention Market Revenue (US$ Mn) Comparison by Prevention (2016-2032)
- Figure 55: Western Europe Disease Prevention Market Revenue (US$ Mn) Comparison by End-User (2016-2032)
- Figure 56: Western Europe Disease Prevention Market Y-o-Y Growth Rate Comparison by Country (2016-2032)
- Figure 57: Western Europe Disease Prevention Market Y-o-Y Growth Rate Comparison by Stage (2016-2032)
- Figure 58: Western Europe Disease Prevention Market Y-o-Y Growth Rate Comparison by Prevention (2016-2032)
- Figure 59: Western Europe Disease Prevention Market Y-o-Y Growth Rate Comparison by End-User (2016-2032)
- Figure 60: Western Europe Disease Prevention Market Share Comparison by Country (2016-2032)
- Figure 61: Western Europe Disease Prevention Market Share Comparison by Stage (2016-2032)
- Figure 62: Western Europe Disease Prevention Market Share Comparison by Prevention (2016-2032)
- Figure 63: Western Europe Disease Prevention Market Share Comparison by End-User (2016-2032)
- Figure 64: Eastern Europe Disease Prevention Market Revenue (US$ Mn) Market Share by Stagein 2022
- Figure 65: Eastern Europe Disease Prevention Market Attractiveness Analysis by Stage, 2016-2032
- Figure 66: Eastern Europe Disease Prevention Market Revenue (US$ Mn) Market Share by Preventionin 2022
- Figure 67: Eastern Europe Disease Prevention Market Attractiveness Analysis by Prevention, 2016-2032
- Figure 68: Eastern Europe Disease Prevention Market Revenue (US$ Mn) Market Share by End-Userin 2022
- Figure 69: Eastern Europe Disease Prevention Market Attractiveness Analysis by End-User, 2016-2032
- Figure 70: Eastern Europe Disease Prevention Market Revenue (US$ Mn) Market Share by Country in 2022
- Figure 71: Eastern Europe Disease Prevention Market Attractiveness Analysis by Country, 2016-2032
- Figure 72: Eastern Europe Disease Prevention Market Revenue (US$ Mn) (2016-2032)
- Figure 73: Eastern Europe Disease Prevention Market Revenue (US$ Mn) Comparison by Country (2016-2032)
- Figure 74: Eastern Europe Disease Prevention Market Revenue (US$ Mn) Comparison by Stage (2016-2032)
- Figure 75: Eastern Europe Disease Prevention Market Revenue (US$ Mn) Comparison by Prevention (2016-2032)
- Figure 76: Eastern Europe Disease Prevention Market Revenue (US$ Mn) Comparison by End-User (2016-2032)
- Figure 77: Eastern Europe Disease Prevention Market Y-o-Y Growth Rate Comparison by Country (2016-2032)
- Figure 78: Eastern Europe Disease Prevention Market Y-o-Y Growth Rate Comparison by Stage (2016-2032)
- Figure 79: Eastern Europe Disease Prevention Market Y-o-Y Growth Rate Comparison by Prevention (2016-2032)
- Figure 80: Eastern Europe Disease Prevention Market Y-o-Y Growth Rate Comparison by End-User (2016-2032)
- Figure 81: Eastern Europe Disease Prevention Market Share Comparison by Country (2016-2032)
- Figure 82: Eastern Europe Disease Prevention Market Share Comparison by Stage (2016-2032)
- Figure 83: Eastern Europe Disease Prevention Market Share Comparison by Prevention (2016-2032)
- Figure 84: Eastern Europe Disease Prevention Market Share Comparison by End-User (2016-2032)
- Figure 85: APAC Disease Prevention Market Revenue (US$ Mn) Market Share by Stagein 2022
- Figure 86: APAC Disease Prevention Market Attractiveness Analysis by Stage, 2016-2032
- Figure 87: APAC Disease Prevention Market Revenue (US$ Mn) Market Share by Preventionin 2022
- Figure 88: APAC Disease Prevention Market Attractiveness Analysis by Prevention, 2016-2032
- Figure 89: APAC Disease Prevention Market Revenue (US$ Mn) Market Share by End-Userin 2022
- Figure 90: APAC Disease Prevention Market Attractiveness Analysis by End-User, 2016-2032
- Figure 91: APAC Disease Prevention Market Revenue (US$ Mn) Market Share by Country in 2022
- Figure 92: APAC Disease Prevention Market Attractiveness Analysis by Country, 2016-2032
- Figure 93: APAC Disease Prevention Market Revenue (US$ Mn) (2016-2032)
- Figure 94: APAC Disease Prevention Market Revenue (US$ Mn) Comparison by Country (2016-2032)
- Figure 95: APAC Disease Prevention Market Revenue (US$ Mn) Comparison by Stage (2016-2032)
- Figure 96: APAC Disease Prevention Market Revenue (US$ Mn) Comparison by Prevention (2016-2032)
- Figure 97: APAC Disease Prevention Market Revenue (US$ Mn) Comparison by End-User (2016-2032)
- Figure 98: APAC Disease Prevention Market Y-o-Y Growth Rate Comparison by Country (2016-2032)
- Figure 99: APAC Disease Prevention Market Y-o-Y Growth Rate Comparison by Stage (2016-2032)
- Figure 100: APAC Disease Prevention Market Y-o-Y Growth Rate Comparison by Prevention (2016-2032)
- Figure 101: APAC Disease Prevention Market Y-o-Y Growth Rate Comparison by End-User (2016-2032)
- Figure 102: APAC Disease Prevention Market Share Comparison by Country (2016-2032)
- Figure 103: APAC Disease Prevention Market Share Comparison by Stage (2016-2032)
- Figure 104: APAC Disease Prevention Market Share Comparison by Prevention (2016-2032)
- Figure 105: APAC Disease Prevention Market Share Comparison by End-User (2016-2032)
- Figure 106: Latin America Disease Prevention Market Revenue (US$ Mn) Market Share by Stagein 2022
- Figure 107: Latin America Disease Prevention Market Attractiveness Analysis by Stage, 2016-2032
- Figure 108: Latin America Disease Prevention Market Revenue (US$ Mn) Market Share by Preventionin 2022
- Figure 109: Latin America Disease Prevention Market Attractiveness Analysis by Prevention, 2016-2032
- Figure 110: Latin America Disease Prevention Market Revenue (US$ Mn) Market Share by End-Userin 2022
- Figure 111: Latin America Disease Prevention Market Attractiveness Analysis by End-User, 2016-2032
- Figure 112: Latin America Disease Prevention Market Revenue (US$ Mn) Market Share by Country in 2022
- Figure 113: Latin America Disease Prevention Market Attractiveness Analysis by Country, 2016-2032
- Figure 114: Latin America Disease Prevention Market Revenue (US$ Mn) (2016-2032)
- Figure 115: Latin America Disease Prevention Market Revenue (US$ Mn) Comparison by Country (2016-2032)
- Figure 116: Latin America Disease Prevention Market Revenue (US$ Mn) Comparison by Stage (2016-2032)
- Figure 117: Latin America Disease Prevention Market Revenue (US$ Mn) Comparison by Prevention (2016-2032)
- Figure 118: Latin America Disease Prevention Market Revenue (US$ Mn) Comparison by End-User (2016-2032)
- Figure 119: Latin America Disease Prevention Market Y-o-Y Growth Rate Comparison by Country (2016-2032)
- Figure 120: Latin America Disease Prevention Market Y-o-Y Growth Rate Comparison by Stage (2016-2032)
- Figure 121: Latin America Disease Prevention Market Y-o-Y Growth Rate Comparison by Prevention (2016-2032)
- Figure 122: Latin America Disease Prevention Market Y-o-Y Growth Rate Comparison by End-User (2016-2032)
- Figure 123: Latin America Disease Prevention Market Share Comparison by Country (2016-2032)
- Figure 124: Latin America Disease Prevention Market Share Comparison by Stage (2016-2032)
- Figure 125: Latin America Disease Prevention Market Share Comparison by Prevention (2016-2032)
- Figure 126: Latin America Disease Prevention Market Share Comparison by End-User (2016-2032)
- Figure 127: Middle East & Africa Disease Prevention Market Revenue (US$ Mn) Market Share by Stagein 2022
- Figure 128: Middle East & Africa Disease Prevention Market Attractiveness Analysis by Stage, 2016-2032
- Figure 129: Middle East & Africa Disease Prevention Market Revenue (US$ Mn) Market Share by Preventionin 2022
- Figure 130: Middle East & Africa Disease Prevention Market Attractiveness Analysis by Prevention, 2016-2032
- Figure 131: Middle East & Africa Disease Prevention Market Revenue (US$ Mn) Market Share by End-Userin 2022
- Figure 132: Middle East & Africa Disease Prevention Market Attractiveness Analysis by End-User, 2016-2032
- Figure 133: Middle East & Africa Disease Prevention Market Revenue (US$ Mn) Market Share by Country in 2022
- Figure 134: Middle East & Africa Disease Prevention Market Attractiveness Analysis by Country, 2016-2032
- Figure 135: Middle East & Africa Disease Prevention Market Revenue (US$ Mn) (2016-2032)
- Figure 136: Middle East & Africa Disease Prevention Market Revenue (US$ Mn) Comparison by Country (2016-2032)
- Figure 137: Middle East & Africa Disease Prevention Market Revenue (US$ Mn) Comparison by Stage (2016-2032)
- Figure 138: Middle East & Africa Disease Prevention Market Revenue (US$ Mn) Comparison by Prevention (2016-2032)
- Figure 139: Middle East & Africa Disease Prevention Market Revenue (US$ Mn) Comparison by End-User (2016-2032)
- Figure 140: Middle East & Africa Disease Prevention Market Y-o-Y Growth Rate Comparison by Country (2016-2032)
- Figure 141: Middle East & Africa Disease Prevention Market Y-o-Y Growth Rate Comparison by Stage (2016-2032)
- Figure 142: Middle East & Africa Disease Prevention Market Y-o-Y Growth Rate Comparison by Prevention (2016-2032)
- Figure 143: Middle East & Africa Disease Prevention Market Y-o-Y Growth Rate Comparison by End-User (2016-2032)
- Figure 144: Middle East & Africa Disease Prevention Market Share Comparison by Country (2016-2032)
- Figure 145: Middle East & Africa Disease Prevention Market Share Comparison by Stage (2016-2032)
- Figure 146: Middle East & Africa Disease Prevention Market Share Comparison by Prevention (2016-2032)
- Figure 147: Middle East & Africa Disease Prevention Market Share Comparison by End-User (2016-2032)
- List of Tables
- Table 1: Global Disease Prevention Market Comparison by Stage (2016-2032)
- Table 2: Global Disease Prevention Market Comparison by Prevention (2016-2032)
- Table 3: Global Disease Prevention Market Comparison by End-User (2016-2032)
- Table 4: Global Disease Prevention Market Revenue (US$ Mn) Comparison by Region (2016-2032)
- Table 5: Global Disease Prevention Market Revenue (US$ Mn) (2016-2032)
- Table 6: Global Disease Prevention Market Revenue (US$ Mn) Comparison by Region (2016-2032)
- Table 7: Global Disease Prevention Market Revenue (US$ Mn) Comparison by Stage (2016-2032)
- Table 8: Global Disease Prevention Market Revenue (US$ Mn) Comparison by Prevention (2016-2032)
- Table 9: Global Disease Prevention Market Revenue (US$ Mn) Comparison by End-User (2016-2032)
- Table 10: Global Disease Prevention Market Y-o-Y Growth Rate Comparison by Region (2016-2032)
- Table 11: Global Disease Prevention Market Y-o-Y Growth Rate Comparison by Stage (2016-2032)
- Table 12: Global Disease Prevention Market Y-o-Y Growth Rate Comparison by Prevention (2016-2032)
- Table 13: Global Disease Prevention Market Y-o-Y Growth Rate Comparison by End-User (2016-2032)
- Table 14: Global Disease Prevention Market Share Comparison by Region (2016-2032)
- Table 15: Global Disease Prevention Market Share Comparison by Stage (2016-2032)
- Table 16: Global Disease Prevention Market Share Comparison by Prevention (2016-2032)
- Table 17: Global Disease Prevention Market Share Comparison by End-User (2016-2032)
- Table 18: North America Disease Prevention Market Comparison by Prevention (2016-2032)
- Table 19: North America Disease Prevention Market Comparison by End-User (2016-2032)
- Table 20: North America Disease Prevention Market Revenue (US$ Mn) Comparison by Country (2016-2032)
- Table 21: North America Disease Prevention Market Revenue (US$ Mn) (2016-2032)
- Table 22: North America Disease Prevention Market Revenue (US$ Mn) Comparison by Country (2016-2032)
- Table 23: North America Disease Prevention Market Revenue (US$ Mn) Comparison by Stage (2016-2032)
- Table 24: North America Disease Prevention Market Revenue (US$ Mn) Comparison by Prevention (2016-2032)
- Table 25: North America Disease Prevention Market Revenue (US$ Mn) Comparison by End-User (2016-2032)
- Table 26: North America Disease Prevention Market Y-o-Y Growth Rate Comparison by Country (2016-2032)
- Table 27: North America Disease Prevention Market Y-o-Y Growth Rate Comparison by Stage (2016-2032)
- Table 28: North America Disease Prevention Market Y-o-Y Growth Rate Comparison by Prevention (2016-2032)
- Table 29: North America Disease Prevention Market Y-o-Y Growth Rate Comparison by End-User (2016-2032)
- Table 30: North America Disease Prevention Market Share Comparison by Country (2016-2032)
- Table 31: North America Disease Prevention Market Share Comparison by Stage (2016-2032)
- Table 32: North America Disease Prevention Market Share Comparison by Prevention (2016-2032)
- Table 33: North America Disease Prevention Market Share Comparison by End-User (2016-2032)
- Table 34: Western Europe Disease Prevention Market Comparison by Stage (2016-2032)
- Table 35: Western Europe Disease Prevention Market Comparison by Prevention (2016-2032)
- Table 36: Western Europe Disease Prevention Market Comparison by End-User (2016-2032)
- Table 37: Western Europe Disease Prevention Market Revenue (US$ Mn) Comparison by Country (2016-2032)
- Table 38: Western Europe Disease Prevention Market Revenue (US$ Mn) (2016-2032)
- Table 39: Western Europe Disease Prevention Market Revenue (US$ Mn) Comparison by Country (2016-2032)
- Table 40: Western Europe Disease Prevention Market Revenue (US$ Mn) Comparison by Stage (2016-2032)
- Table 41: Western Europe Disease Prevention Market Revenue (US$ Mn) Comparison by Prevention (2016-2032)
- Table 42: Western Europe Disease Prevention Market Revenue (US$ Mn) Comparison by End-User (2016-2032)
- Table 43: Western Europe Disease Prevention Market Y-o-Y Growth Rate Comparison by Country (2016-2032)
- Table 44: Western Europe Disease Prevention Market Y-o-Y Growth Rate Comparison by Stage (2016-2032)
- Table 45: Western Europe Disease Prevention Market Y-o-Y Growth Rate Comparison by Prevention (2016-2032)
- Table 46: Western Europe Disease Prevention Market Y-o-Y Growth Rate Comparison by End-User (2016-2032)
- Table 47: Western Europe Disease Prevention Market Share Comparison by Country (2016-2032)
- Table 48: Western Europe Disease Prevention Market Share Comparison by Stage (2016-2032)
- Table 49: Western Europe Disease Prevention Market Share Comparison by Prevention (2016-2032)
- Table 50: Western Europe Disease Prevention Market Share Comparison by End-User (2016-2032)
- Table 51: Eastern Europe Disease Prevention Market Comparison by Stage (2016-2032)
- Table 52: Eastern Europe Disease Prevention Market Comparison by Prevention (2016-2032)
- Table 53: Eastern Europe Disease Prevention Market Comparison by End-User (2016-2032)
- Table 54: Eastern Europe Disease Prevention Market Revenue (US$ Mn) Comparison by Country (2016-2032)
- Table 55: Eastern Europe Disease Prevention Market Revenue (US$ Mn) (2016-2032)
- Table 56: Eastern Europe Disease Prevention Market Revenue (US$ Mn) Comparison by Country (2016-2032)
- Table 57: Eastern Europe Disease Prevention Market Revenue (US$ Mn) Comparison by Stage (2016-2032)
- Table 58: Eastern Europe Disease Prevention Market Revenue (US$ Mn) Comparison by Prevention (2016-2032)
- Table 59: Eastern Europe Disease Prevention Market Revenue (US$ Mn) Comparison by End-User (2016-2032)
- Table 60: Eastern Europe Disease Prevention Market Y-o-Y Growth Rate Comparison by Country (2016-2032)
- Table 61: Eastern Europe Disease Prevention Market Y-o-Y Growth Rate Comparison by Stage (2016-2032)
- Table 62: Eastern Europe Disease Prevention Market Y-o-Y Growth Rate Comparison by Prevention (2016-2032)
- Table 63: Eastern Europe Disease Prevention Market Y-o-Y Growth Rate Comparison by End-User (2016-2032)
- Table 64: Eastern Europe Disease Prevention Market Share Comparison by Country (2016-2032)
- Table 65: Eastern Europe Disease Prevention Market Share Comparison by Stage (2016-2032)
- Table 66: Eastern Europe Disease Prevention Market Share Comparison by Prevention (2016-2032)
- Table 67: Eastern Europe Disease Prevention Market Share Comparison by End-User (2016-2032)
- Table 68: APAC Disease Prevention Market Comparison by Stage (2016-2032)
- Table 69: APAC Disease Prevention Market Comparison by Prevention (2016-2032)
- Table 70: APAC Disease Prevention Market Comparison by End-User (2016-2032)
- Table 71: APAC Disease Prevention Market Revenue (US$ Mn) Comparison by Country (2016-2032)
- Table 72: APAC Disease Prevention Market Revenue (US$ Mn) (2016-2032)
- Table 73: APAC Disease Prevention Market Revenue (US$ Mn) Comparison by Country (2016-2032)
- Table 74: APAC Disease Prevention Market Revenue (US$ Mn) Comparison by Stage (2016-2032)
- Table 75: APAC Disease Prevention Market Revenue (US$ Mn) Comparison by Prevention (2016-2032)
- Table 76: APAC Disease Prevention Market Revenue (US$ Mn) Comparison by End-User (2016-2032)
- Table 77: APAC Disease Prevention Market Y-o-Y Growth Rate Comparison by Country (2016-2032)
- Table 78: APAC Disease Prevention Market Y-o-Y Growth Rate Comparison by Stage (2016-2032)
- Table 79: APAC Disease Prevention Market Y-o-Y Growth Rate Comparison by Prevention (2016-2032)
- Table 80: APAC Disease Prevention Market Y-o-Y Growth Rate Comparison by End-User (2016-2032)
- Table 81: APAC Disease Prevention Market Share Comparison by Country (2016-2032)
- Table 82: APAC Disease Prevention Market Share Comparison by Stage (2016-2032)
- Table 83: APAC Disease Prevention Market Share Comparison by Prevention (2016-2032)
- Table 84: APAC Disease Prevention Market Share Comparison by End-User (2016-2032)
- Table 85: Latin America Disease Prevention Market Comparison by Stage (2016-2032)
- Table 86: Latin America Disease Prevention Market Comparison by Prevention (2016-2032)
- Table 87: Latin America Disease Prevention Market Comparison by End-User (2016-2032)
- Table 88: Latin America Disease Prevention Market Revenue (US$ Mn) Comparison by Country (2016-2032)
- Table 89: Latin America Disease Prevention Market Revenue (US$ Mn) (2016-2032)
- Table 90: Latin America Disease Prevention Market Revenue (US$ Mn) Comparison by Country (2016-2032)
- Table 91: Latin America Disease Prevention Market Revenue (US$ Mn) Comparison by Stage (2016-2032)
- Table 92: Latin America Disease Prevention Market Revenue (US$ Mn) Comparison by Prevention (2016-2032)
- Table 93: Latin America Disease Prevention Market Revenue (US$ Mn) Comparison by End-User (2016-2032)
- Table 94: Latin America Disease Prevention Market Y-o-Y Growth Rate Comparison by Country (2016-2032)
- Table 95: Latin America Disease Prevention Market Y-o-Y Growth Rate Comparison by Stage (2016-2032)
- Table 96: Latin America Disease Prevention Market Y-o-Y Growth Rate Comparison by Prevention (2016-2032)
- Table 97: Latin America Disease Prevention Market Y-o-Y Growth Rate Comparison by End-User (2016-2032)
- Table 98: Latin America Disease Prevention Market Share Comparison by Country (2016-2032)
- Table 99: Latin America Disease Prevention Market Share Comparison by Stage (2016-2032)
- Table 100: Latin America Disease Prevention Market Share Comparison by Prevention (2016-2032)
- Table 101: Latin America Disease Prevention Market Share Comparison by End-User (2016-2032)
- Table 102: Middle East & Africa Disease Prevention Market Comparison by Stage (2016-2032)
- Table 103: Middle East & Africa Disease Prevention Market Comparison by Prevention (2016-2032)
- Table 104: Middle East & Africa Disease Prevention Market Comparison by End-User (2016-2032)
- Table 105: Middle East & Africa Disease Prevention Market Revenue (US$ Mn) Comparison by Country (2016-2032)
- Table 106: Middle East & Africa Disease Prevention Market Revenue (US$ Mn) (2016-2032)
- Table 107: Middle East & Africa Disease Prevention Market Revenue (US$ Mn) Comparison by Country (2016-2032)
- Table 108: Middle East & Africa Disease Prevention Market Revenue (US$ Mn) Comparison by Stage (2016-2032)
- Table 109: Middle East & Africa Disease Prevention Market Revenue (US$ Mn) Comparison by Prevention (2016-2032)
- Table 110: Middle East & Africa Disease Prevention Market Revenue (US$ Mn) Comparison by End-User (2016-2032)
- Table 111: Middle East & Africa Disease Prevention Market Y-o-Y Growth Rate Comparison by Country (2016-2032)
- Table 112: Middle East & Africa Disease Prevention Market Y-o-Y Growth Rate Comparison by Stage (2016-2032)
- Table 113: Middle East & Africa Disease Prevention Market Y-o-Y Growth Rate Comparison by Prevention (2016-2032)
- Table 114: Middle East & Africa Disease Prevention Market Y-o-Y Growth Rate Comparison by End-User (2016-2032)
- Table 115: Middle East & Africa Disease Prevention Market Share Comparison by Country (2016-2032)
- Table 116: Middle East & Africa Disease Prevention Market Share Comparison by Stage (2016-2032)
- Table 117: Middle East & Africa Disease Prevention Market Share Comparison by Prevention (2016-2032)
- Table 118: Middle East & Africa Disease Prevention Market Share Comparison by End-User (2016-2032)
- 1. Executive Summary
-
- Novartis AG
- Serum Institute of India Pvt. Ltd.
- Edwards Lifesciences Corporation
- Access Healthcare
- Jazz Pharmaceuticals plc
- Horizon Therapeutics Public Ltd Co.
- Penumbra, Inc.
- Carbon Health Inc.
- Accelerate Diagnostics, Inc.
- Medtronic Plc.
- Other Key Players
Our Clients


View Our Licence Options
