
Digital Twins Market By Type (Product Digital Twin, Process Digital Twin, System Digital Twin), By Technology (IoT and IIoT, Blockchain, Artificial Intelligence and Machine Learning, Augmented Reality, Virtual Reality, and Mixed Reality, Big Data Analytics, 5G), By End-User (Aerospace and Defense, Automotive & Transportation, Healthcare, Energy & Utilities, Oil and Gas, Agriculture, Other End-Users), By Region And Companies - Industry Segment Outlook, Market Assessment, Competition Scenario, Trends, And Forecast 2024-2033
-
50972
-
September 2024
-
300
-


-
This report was compiled by Vishwa Gaul Vishwa is an experienced market research and consulting professional with over 8 years of expertise in the ICT industry, contributing to over 700 reports across telecommunications, software, hardware, and digital solutions. Correspondence Team Lead- ICT Linkedin | Detailed Market research Methodology Our methodology involves a mix of primary research, including interviews with leading mental health experts, and secondary research from reputable medical journals and databases. View Detailed Methodology Page
-
Quick Navigation
Report Overview
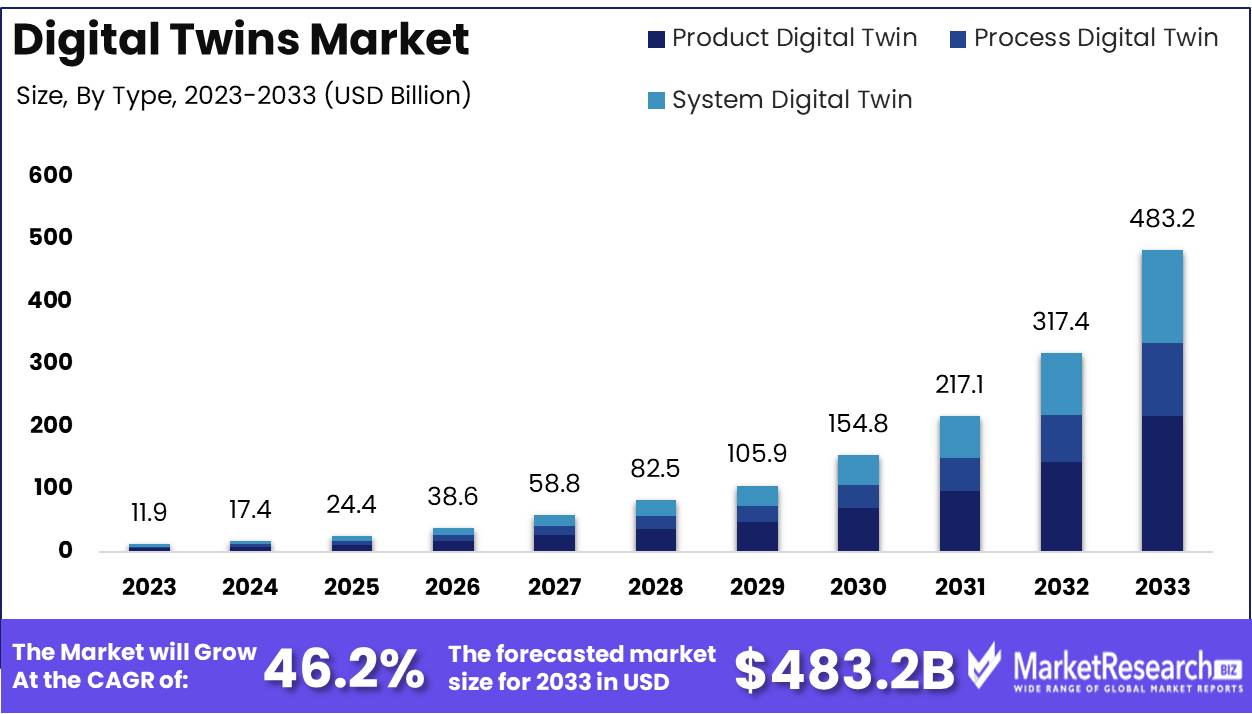
The Digital Twins Market was valued at USD 11.9 billion in 2023. It is expected to reach USD 483.2 billion by 2033, with a CAGR of 46.2% during the forecast period from 2024 to 2033.
The Digital Twins Market refers to the growing adoption of virtual replicas of physical assets, processes, or systems that enable real-time monitoring, simulation, and optimization. This market is driven by advancements in IoT, artificial intelligence, and data analytics, enabling businesses to enhance decision-making, reduce operational costs, and improve product lifecycle management. Digital twins are increasingly utilized across industries such as manufacturing, healthcare, and smart cities to predict performance, prevent downtime, and enhance efficiency.
The digital twins market is poised for significant growth, driven primarily by the increasing integration of IoT and AI technologies across industries. Digital twins, which create virtual replicas of physical systems, are becoming essential tools for organizations seeking real-time data analytics and predictive maintenance. This growth is particularly evident in sectors like smart manufacturing and Industry 4.0, where digital twins enhance operational efficiency, optimize production processes, and reduce downtime. The convergence of AI and IoT is accelerating the adoption of these technologies, as they enable enhanced data processing capabilities, fostering more accurate simulations and predictive analytics.
However, the market faces certain challenges, notably the high initial investment required for implementing digital twin solutions. The complexity and cost of integrating these systems into existing infrastructures remain key barriers, particularly for smaller enterprises. Despite these challenges, the healthcare and medical device industries are emerging as key growth areas. In these sectors, digital twins simulate patient outcomes, optimize medical device performance, and personalize treatment plans. This growing application in healthcare, coupled with advancements in AI and IoT, is expected to drive substantial demand for digital twin solutions. As industries continue to embrace digital transformation, the digital twins market is expected to experience robust growth. However, careful consideration of cost and infrastructure requirements will be necessary for widespread adoption.
Key Takeaways
- Market Growth: The Digital Twins Market was valued at USD 11.9 billion in 2023. It is expected to reach USD 483.2 billion by 2033, with a CAGR of 46.2% during the forecast period from 2024 to 2033.
- By Type: Product Digital Twin dominated the growing Digital Twins market.
- By Technology: IoT and IIoT dominated the Digital Twins Market technology.
- By End-User: Aerospace and Defense dominated the Digital Twins market segment.
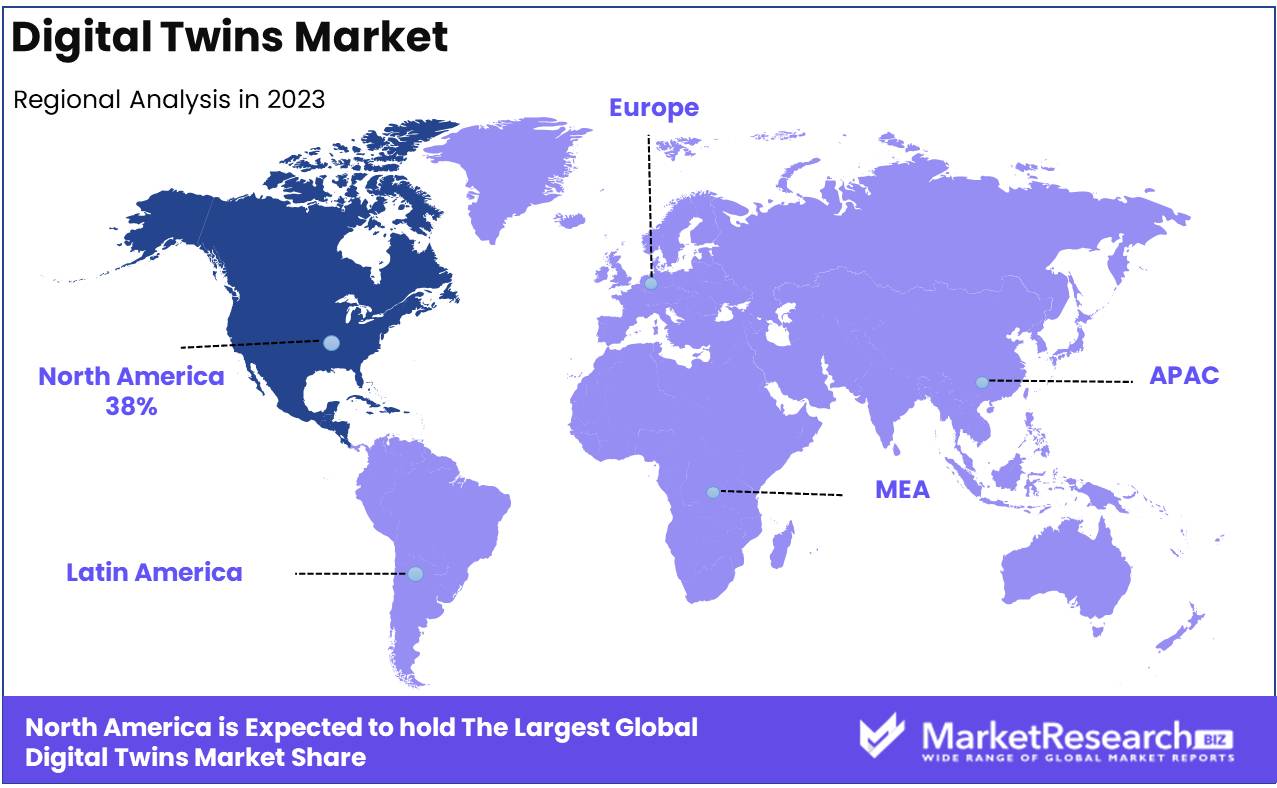
- Regional Dominance: North America dominates the global Digital Twins market with a 38% largest share.
- Growth Opportunity: The global digital twins market is poised for significant growth, driven by IoT integration and expanding healthcare applications, offering transformative solutions across various industries.
Driving factors
Advancements in IoT and AI Technologies: Key Enablers of Digital Twins Market Growth
The rapid evolution of IoT (Internet of Things) and AI (Artificial Intelligence) technologies has significantly fueled the growth of the Digital Twins market. IoT devices generate vast amounts of real-time data, which is critical for creating accurate digital replicas of physical assets, processes, or systems. The growing network of connected devices allows for continuous monitoring, data collection, and remote control, making digital twins more precise and dynamic in their operations.
AI, on the other hand, enhances the analytical capabilities of digital twins by processing the complex datasets collected by IoT devices. Machine learning algorithms enable predictive analytics, allowing digital twins to forecast outcomes, optimize performance, and identify potential failures before they occur. According to industry research, the global IoT market size is expected to reach $1.6 trillion by 2025, with AI becoming an integral component in enabling the scalability and functionality of digital twins. The symbiotic relationship between IoT and AI technologies creates a foundation for digital twins, accelerating their adoption across industries like manufacturing, healthcare, and smart cities.
Increasing Demand for Predictive Maintenance: Driving Operational Efficiency
The rising need for predictive maintenance is a major factor contributing to the growth of the digital twins market. Industries are increasingly seeking advanced solutions to reduce unplanned downtime and maintenance costs. Digital twins offer real-time insights into the condition and performance of machinery and equipment, enabling businesses to predict failures before they occur and schedule maintenance accordingly.
In industries such as manufacturing, automotive, and aerospace, predictive maintenance through digital twins can reduce maintenance costs by up to 30%, lower downtime by 45%, and extend the lifespan of equipment by 20%. This reduction in operational inefficiencies is a compelling incentive for companies to invest in digital twins. As predictive maintenance gains prominence, the market for digital twins is expected to grow, as these solutions provide a tangible return on investment by enhancing operational efficiency and asset longevity.
Need for Enhanced Simulation and Design Capabilities: Empowering Innovation and Reducing Time-to-Market
The growing demand for advanced simulation and design capabilities is another driving force behind the expansion of the digital twins market. As products and systems become more complex, there is a pressing need for tools that can simulate different scenarios, test various design configurations, and optimize performance before actual deployment. Digital twins allow engineers and designers to create virtual models of assets, run simulations, and make iterative adjustments in a risk-free environment, thereby improving product design, reducing development costs, and accelerating time-to-market.
This capability is particularly valuable in sectors such as automotive, aerospace, and healthcare, where precision and innovation are paramount. By integrating real-world data from IoT sensors, digital twins provide a realistic and dynamic simulation environment. According to industry estimates, companies utilizing digital twin technologies can reduce product development time by up to 50%, leading to faster innovation cycles and competitive advantage. This growing need for enhanced simulation capabilities directly contributes to the expansion of the digital twins market, as more industries recognize the value of virtual modeling in driving innovation and efficiency.
Restraining Factors
Accuracy and Reliability Issues: Hindering the Full Potential of Digital Twins
The growth of the Digital Twins market is significantly influenced by concerns surrounding the accuracy and reliability of digital twin models. Digital twins are sophisticated virtual representations that mirror physical assets, processes, or systems, and their ability to function optimally depends on the accuracy of the data inputs. In many cases, inaccuracies in data modeling, sensor malfunction, or incomplete data capture can lead to unreliable predictions and insights, diminishing the confidence of end-users in the technology.
For instance, industries such as aerospace, automotive, and healthcare rely on precise digital twin simulations to optimize performance and reduce operational risks. However, if digital twin models cannot consistently deliver accurate insights, the return on investment (ROI) for these industries may be negatively impacted, thus slowing their adoption. The limitations in model accuracy directly affect the predictive capabilities, which are critical for use cases such as predictive maintenance, system optimization, and lifecycle management.
This issue is compounded by the fact that digital twins often need to replicate complex and highly dynamic systems, meaning that the margin for error is minimal. Without the assurance of reliability, companies are hesitant to fully integrate digital twins into their core operations, preferring to wait until the technology matures. As a result, the overall market growth for digital twins is restrained, as businesses may delay investments or scale deployments.
Data Security Concerns: Inhibiting Widespread Adoption of Digital Twins
Data security is another critical factor restraining the growth of the Digital Twins market. The implementation of digital twins relies heavily on real-time data exchange between physical and digital environments, which inherently exposes sensitive operational data to cyber risks. Industries such as energy, manufacturing, and defense handle highly confidential data, and any breach or cyberattack could have severe consequences, ranging from financial loss to compromised safety.
In recent years, there has been a rise in cybersecurity threats targeting industrial operations, with sophisticated malware designed to exploit vulnerabilities in connected systems. According to industry reports, cybersecurity threats in industrial sectors have risen by 30% year over year, which has heightened concerns about the safety of digital twin implementations. The fear of potential cyberattacks, data manipulation, or unauthorized access to proprietary data has led to hesitancy among companies to fully embrace digital twins.
By Type Analysis
In 2023, Product Digital Twin dominated the growing Digital Twins market.
In 2023, The Product Digital Twin segment held a dominant position in the Digital Twins Market by type. Product digital twins, which offer virtual representations of physical assets, allow companies to simulate, analyze, and optimize the performance of individual products throughout their lifecycle. This segment's leadership is driven by increasing demand for predictive maintenance, product optimization, and performance analysis across industries such as manufacturing, automotive, and aerospace.
The Process Digital Twin segment also experienced significant growth. These twins replicate operational processes, allowing organizations to streamline workflows, reduce downtime, and enhance efficiency in sectors like energy, oil and gas, and industrial automation. The increasing focus on operational efficiency and process optimization has propelled demand in this segment.
Meanwhile, the System Digital Twin segment plays a vital role in integrating multiple products and processes to simulate entire systems, such as smart cities and complex industrial ecosystems. This comprehensive approach is gaining traction in large-scale infrastructure and smart manufacturing initiatives, further contributing to the expansion of the Digital Twins market across multiple verticals.
By Technology Analysis
In 2023, IoT and IIoT dominated the Digital Twins Market technology.
In 2023, IoT and IIoT held a dominant market position in the By Technology segment of the Digital Twins Market, driven by their integral role in connecting physical assets with their digital counterparts. IoT facilitates real-time data collection, which is crucial for creating accurate digital replicas of physical objects, while IIoT enhances industrial processes by enabling predictive maintenance and optimizing operational efficiency. These technologies are particularly prominent in industries like manufacturing, healthcare, and automotive.
Blockchain offers a secure, decentralized solution for verifying and tracking digital twin data, ensuring data integrity, and reducing cyber threats. This technology is especially relevant in supply chain management and financial sectors.
Artificial Intelligence (AI) and Machine Learning (ML) contribute to the evolution of digital twins by enabling advanced data analytics, predictive insights, and decision-making processes.
Augmented Reality (AR), Virtual Reality (VR), and Mixed Reality (MR) enhance the visualization of digital twins, providing immersive environments for monitoring, simulation, and training.
Big Data Analytics plays a crucial role in processing vast amounts of data from IoT devices, turning it into actionable insights for digital twin applications.
Finally, 5G enables faster data transmission, reducing latency and enabling real-time updates for digital twins in sectors like smart cities and autonomous vehicles.
By End-User Analysis
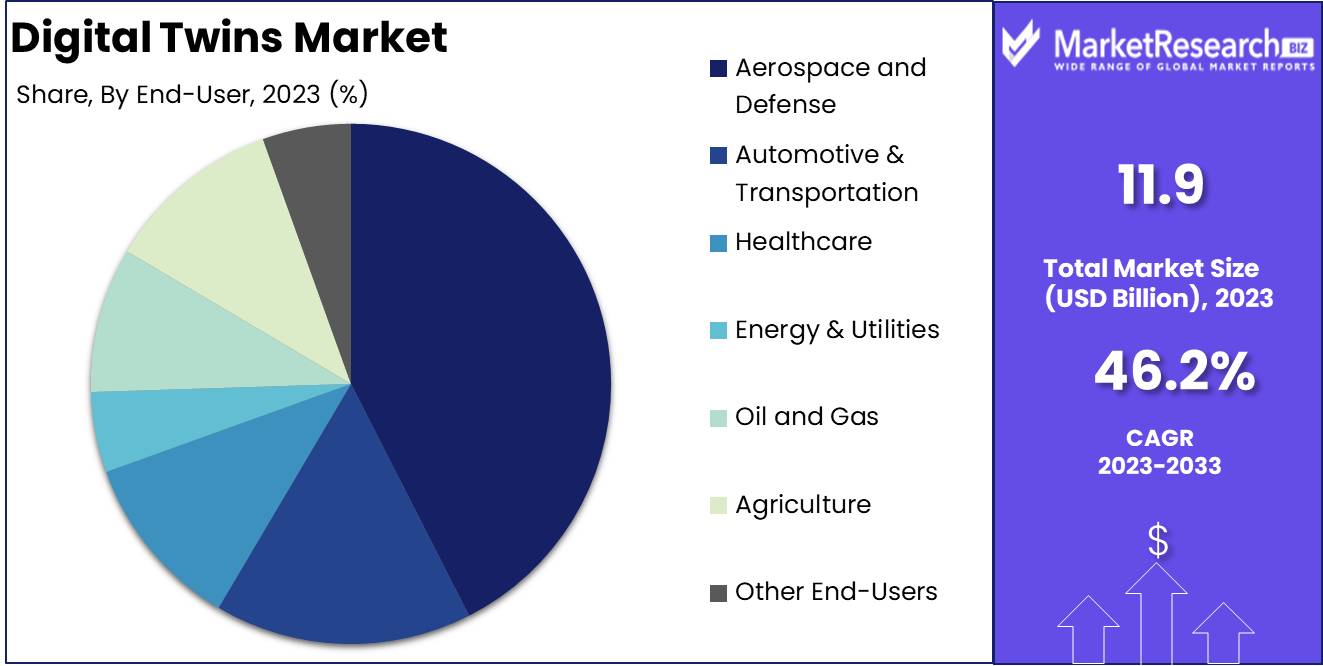
In 2023, Aerospace and Defense dominated the Digital Twins market segment.
In 2023, The Aerospace and Defense segment held a dominant market position in the Digital Twins market, driven by the sector's need for advanced simulation and modeling technologies. Aerospace and Defense applications leverage digital twins to enhance the design, testing, and maintenance of complex systems, including aircraft and defense equipment. This segment benefits from the ability to perform real-time simulations, optimize performance, and reduce costs associated with physical prototyping. The integration of digital twins in Aerospace and Defense has facilitated more accurate forecasting and preventive maintenance, which are critical for mission-critical applications.
Automotive & Transportation also exhibited significant market prominence, with digital twins enhancing vehicle design, manufacturing, and operational efficiency. This segment's growth is attributed to the increasing demand for autonomous vehicles and smart transportation systems, where digital twins enable real-time monitoring and predictive analytics.
Healthcare has emerged as a rapidly growing segment, utilizing digital twins for personalized medicine, patient monitoring, and surgical planning. The ability to create patient-specific models has been pivotal in improving treatment outcomes and operational efficiency.
The Energy & Utilities sector employs digital twins to optimize asset management, predict equipment failures, and improve operational efficiency. Similarly, the Oil and Gas industry benefits from digital twins by enhancing exploration, drilling operations, and safety protocols.
In Agriculture, digital twins facilitate precision farming and resource management, improving crop yields and operational efficiency.
The "Other End-Users" category includes a diverse range of industries benefiting from digital twin technology, including manufacturing and smart cities, which contribute to the overall growth of the market.
Key Market Segments
By Type
- Product Digital Twin
- Process Digital Twin
- System Digital Twin
By Technology
- IoT and IIoT
- Blockchain
- Artificial Intelligence and Machine Learning
- Augmented Reality, Virtual Reality, and Mixed Reality
- Big Data Analytics
- 5G
By End-User
- Aerospace and Defense
- Automotive & Transportation
- Healthcare
- Energy & Utilities
- Oil and Gas
- Agriculture
- Other End-Users
Growth Opportunity
IoT Integration Driving Market Growth
The integration of the Internet of Things (IoT) with digital twins is set to be a major driver of market growth. As IoT devices proliferate across industries, they generate massive amounts of data that can be leveraged to create real-time digital replicas of physical assets. The ability of digital twins to simulate, monitor, and optimize these assets enhances operational efficiency, predictive maintenance, and risk management. With IoT device deployments projected to reach 29 billion by 2030, the opportunities for digital twins to become integral to asset management are substantial. Companies in sectors such as manufacturing, energy, and smart cities are anticipated to invest heavily in digital twin technologies to maximize IoT data utilization.
Expanding Healthcare Applications
In healthcare, digital twins present significant opportunities for growth. Digital replicas of human organs, body systems, and even full patients enable personalized medicine, predictive diagnostics, and improved treatment outcomes. The global digital health market is expected to grow by 15.2% CAGR through 2030, with digital twins playing a critical role in enhancing patient care. From simulating surgical procedures to optimizing medical devices, digital twins offer a wide range of applications. This growing adoption of digital twins in healthcare, along with the increasing integration of IoT-enabled medical devices, presents an immense growth opportunity in the market.
Latest Trends
Cloud-Based Data Connectivity
The rise of cloud-based solutions is revolutionizing the Digital Twins landscape. The increased cloud adoption will enable seamless data connectivity, allowing organizations to gather and process large volumes of data in real time. Cloud infrastructure is becoming the backbone for Digital Twin platforms, facilitating integration with IoT devices and other data sources. This trend not only enhances the scalability of Digital Twins but also reduces costs associated with on-premise data storage and processing. As businesses continue to prioritize cloud transformation strategies, the Digital Twins market will witness accelerated adoption, particularly in sectors like manufacturing, healthcare, and automotive.
Adoption in Smart Cities
Another prominent trend is the growing application of Digital Twins in smart cities. Governments and urban planners are increasingly adopting these solutions to enhance city management and optimize resource utilization. Digital Twins enable real-time simulation of city infrastructures, such as transportation systems, energy grids, and water management, improving decision-making processes. This technology allows for predictive maintenance, traffic management, and energy efficiency, contributing to sustainable urban development. As global investments in smart cities rise, Digital Twins are expected to become integral to urban planning, driving significant market growth.
Regional Analysis
North America dominates the global Digital Twins market with a 38% largest share.
The global Digital Twins market is experiencing significant growth across various regions, with North America leading the market. In 2023, North America dominated the market, accounting for approximately 38% of the global share, driven by the increasing adoption of IoT, AI, and machine learning technologies across sectors such as manufacturing, automotive, and healthcare. The presence of major technology players and advanced infrastructure further propels the market in the region. Europe follows closely, holding a substantial market share of around 30%, bolstered by the rising demand for digital transformation in industrial operations, particularly in Germany, the UK, and France.
In the Asia-Pacific region, the market is expanding at a rapid pace, primarily due to the increasing industrialization and urbanization in countries like China, Japan, and India. The region is expected to witness a high CAGR of over 15% during the forecast period, supported by government initiatives for smart city projects and the integration of digital twins in the manufacturing and construction industries.
The Middle East & Africa and Latin America collectively hold a smaller share of the market, contributing around 10% and 7%, respectively. However, these regions are showing increasing interest in digital twins, particularly in the oil and gas, construction, and energy sectors, which are expected to drive future growth.
Key Regions and Countries
North America
- The US
- Canada
- Rest of North America
Europe
- Germany
- France
- The UK
- Spain
- Netherlands
- Russia
- Italy
- Rest of Europe
Asia-Pacific
- China
- Japan
- Singapore
- Thailand
- South Korea
- Vietnam
- India
- New Zealand
- Rest of Asia Pacific
Latin America
- Mexico
- Brazil
- Rest of Latin America
Middle East & Africa
- Saudi Arabia
- South Africa
- UAE
- Rest of the Middle East & Africa
Key Players Analysis
The global digital twins market is projected to experience significant growth, driven by advancements in IoT, AI, and cloud computing. Key players are positioned to leverage these technologies, with companies like General Electric Co. and Siemens AG leading through their industrial expertise and integrated solutions in sectors such as manufacturing and energy. Microsoft Corporation and Amazon Web Services, Inc. are expected to expand their influence by utilizing their cloud platforms to provide scalable digital twin solutions, enhancing predictive maintenance and operational efficiencies for their clients.
Dassault Systèmes SE and Autodesk, Inc. will likely continue to dominate in the design and engineering fields, where digital twins are increasingly used for simulation and product lifecycle management. SAP SE and IBM Corporation are expected to focus on integrating digital twin technology into enterprise resource planning (ERP) and business intelligence systems, facilitating data-driven decision-making.
Hitachi, Ltd. and ABB Ltd. are well-positioned to capture market share in the infrastructure and utilities sectors by offering specialized digital twin applications that optimize asset management and grid operations. PTC Inc. and Ansys, Inc. will continue to drive innovation in the simulation and industrial IoT spaces.
Finally, Hexagon AB and AVEVA Group plc are set to expand their digital twin portfolios, particularly in the fields of smart cities and industrial automation, where precision and real-time data are critical. Collectively, these key players are expected to shape the competitive landscape and drive the market forward.
Market Key Players
- General Electric Co.
- Microsoft Corporation
- Hitachi, Ltd.
- Dassault Systèmes SE
- Amazon Web Services, Inc.
- Autodesk, Inc.
- SAP SE
- Siemens AG
- Ansys, Inc.
- PTC Inc.
- IBM Corporation
- ABB Ltd.
- Hexagon AB
- AVEVA Group plc
- Other Key Players
Recent Development
- In March 2024, Microsoft announced new partnerships in the healthcare sector to integrate digital twin technology for personalized medicine and predictive diagnostics. These collaborations leverage AI and IoT to create detailed digital representations of patient conditions, optimizing treatment plans.
- In February 2024, Ericsson demonstrated its live digital twin of a 6G network at the Mobile World Congress 2024 in Barcelona. This initiative highlights the role of digital twins in telecommunications, focusing on improving network planning and management through real-time data insights and simulations of network systems.
- In January 2024, Dassault Systèmes introduced its cloud-based digital twin solutions, aimed at improving end-to-end business operations. By transferring its digital twin technology to the cloud, the company enhances data-driven decision-making processes for various industries.
Report Scope
Report Features Description Market Value (2023) USD 11.9 Billion Forecast Revenue (2033) USD 483.2 Billion CAGR (2024-2032) 46.2% Base Year for Estimation 2023 Historic Period 2016-2023 Forecast Period 2024-2033 Report Coverage Revenue Forecast, Market Dynamics, COVID-19 Impact, Competitive Landscape, Recent Developments Segments Covered By Type (Product Digital Twin, Process Digital Twin, System Digital Twin), By Technology (IoT and IIoT, Blockchain, Artificial Intelligence and Machine Learning, Augmented Reality, Virtual Reality, and Mixed Reality, Big Data Analytics, 5G), By End-User (Aerospace and Defense, Automotive & Transportation, Healthcare, Energy & Utilities, Oil and Gas, Agriculture, Other End-Users) Regional Analysis North America - The US, Canada, Rest of North America, Europe - Germany, France, The UK, Spain, Italy, Russia, Netherlands, Rest of Europe, Asia-Pacific - China, Japan, South Korea, India, New Zealand, Singapore, Thailand, Vietnam, Rest of Asia Pacific, Latin America - Brazil, Mexico, Rest of Latin America, Middle East & Africa - South Africa, Saudi Arabia, UAE, Rest of Middle East & Africa Competitive Landscape General Electric Co., Microsoft Corporation, Hitachi, Ltd., Dassault Systèmes SE, Amazon Web Services, Inc., Autodesk, Inc., SAP SE, Siemens AG, Ansys, Inc., PTC Inc., IBM Corporation, ABB Ltd., Hexagon AB, AVEVA Group plc, Other Key Players Customization Scope Customization for segments, region/country-level will be provided. Moreover, additional customization can be done based on the requirements. Purchase Options We have three licenses to opt for Single User License, Multi-User License (Up to 5 Users), Corporate Use License (Unlimited User and Printable PDF) -
- 1. Executive Summary
- 1.1. Definition
- 1.2. Taxonomy
- 1.3. Research Scope
- 1.4. Key Analysis
- 1.5. Key Findings by Major Segments
- 1.6. Top strategies by Major Players
- 2. Global Digital Twins Market Overview
- 2.1. Digital Twins Market Dynamics
- 2.1.1. Drivers
- 2.1.2. Opportunities
- 2.1.3. Restraints
- 2.1.4. Challenges
- 2.2. Macro-economic Factors
- 2.3. Regulatory Framework
- 2.4. Market Investment Feasibility Index
- 2.5. PEST Analysis
- 2.6. PORTER’S Five Force Analysis
- 2.7. Drivers & Restraints Impact Analysis
- 2.8. Industry Chain Analysis
- 2.9. Cost Structure Analysis
- 2.10. Marketing Strategy
- 2.11. Russia-Ukraine War Impact Analysis
- 2.12. Opportunity Map Analysis
- 2.13. Market Competition Scenario Analysis
- 2.14. Product Life Cycle Analysis
- 2.15. Opportunity Orbits
- 2.16. Manufacturer Intensity Map
- 2.17. Major Companies sales by Value & Volume
- 2.1. Digital Twins Market Dynamics
- 3. Global Digital Twins Market Analysis, Opportunity and Forecast, 2016-2032
- 3.1. Global Digital Twins Market Analysis, 2016-2021
- 3.2. Global Digital Twins Market Opportunity and Forecast, 2023-2032
- 3.3. Global Digital Twins Market Analysis, Opportunity and Forecast, By Type, 2016-2032
- 3.3.1. Global Digital Twins Market Analysis by Type: Introduction
- 3.3.2. Market Size Absolute $ Opportunity Analysis and Forecast, By Type, 2016-2032
- 3.3.3. Product Digital Twin
- 3.3.4. Process Digital Twin
- 3.3.5. System Digital Twin
- 3.4. Global Digital Twins Market Analysis, Opportunity and Forecast, By Technology, 2016-2032
- 3.4.1. Global Digital Twins Market Analysis by Technology: Introduction
- 3.4.2. Market Size Absolute $ Opportunity Analysis and Forecast, By Technology, 2016-2032
- 3.4.3. IoT and IIoT
- 3.4.4. Blockchain
- 3.4.5. Artificial Intelligence and Machine Learning
- 3.4.6. Augmented Reality, Virtual Reality, and Mixed Reality
- 3.4.7. Big Data Analytics
- 3.4.8. 5G
- 3.5. Global Digital Twins Market Analysis, Opportunity and Forecast, By End-User, 2016-2032
- 3.5.1. Global Digital Twins Market Analysis by End-User: Introduction
- 3.5.2. Market Size Absolute $ Opportunity Analysis and Forecast, By End-User, 2016-2032
- 3.5.3. Aerospace and Defense
- 3.5.4. Automotive & Transportation
- 3.5.5. Healthcare
- 3.5.6. Energy & Utilities
- 3.5.7. Oil and Gas
- 3.5.8. Agriculture
- 3.5.9. Other End-Users
- 4. North America Digital Twins Market Analysis, Opportunity and Forecast, 2016-2032
- 4.1. North America Digital Twins Market Analysis, 2016-2021
- 4.2. North America Digital Twins Market Opportunity and Forecast, 2023-2032
- 4.3. North America Digital Twins Market Analysis, Opportunity and Forecast, By Type, 2016-2032
- 4.3.1. North America Digital Twins Market Analysis by Type: Introduction
- 4.3.2. Market Size Absolute $ Opportunity Analysis and Forecast, By Type, 2016-2032
- 4.3.3. Product Digital Twin
- 4.3.4. Process Digital Twin
- 4.3.5. System Digital Twin
- 4.4. North America Digital Twins Market Analysis, Opportunity and Forecast, By Technology, 2016-2032
- 4.4.1. North America Digital Twins Market Analysis by Technology: Introduction
- 4.4.2. Market Size Absolute $ Opportunity Analysis and Forecast, By Technology, 2016-2032
- 4.4.3. IoT and IIoT
- 4.4.4. Blockchain
- 4.4.5. Artificial Intelligence and Machine Learning
- 4.4.6. Augmented Reality, Virtual Reality, and Mixed Reality
- 4.4.7. Big Data Analytics
- 4.4.8. 5G
- 4.5. North America Digital Twins Market Analysis, Opportunity and Forecast, By End-User, 2016-2032
- 4.5.1. North America Digital Twins Market Analysis by End-User: Introduction
- 4.5.2. Market Size Absolute $ Opportunity Analysis and Forecast, By End-User, 2016-2032
- 4.5.3. Aerospace and Defense
- 4.5.4. Automotive & Transportation
- 4.5.5. Healthcare
- 4.5.6. Energy & Utilities
- 4.5.7. Oil and Gas
- 4.5.8. Agriculture
- 4.5.9. Other End-Users
- 4.6. North America Digital Twins Market Analysis, Opportunity and Forecast, By Country , 2016-2032
- 4.6.1. North America Digital Twins Market Analysis by Country : Introduction
- 4.6.2. Market Size Absolute $ Opportunity Analysis and Forecast, Country , 2016-2032
- 4.6.2.1. The US
- 4.6.2.2. Canada
- 4.6.2.3. Mexico
- 5. Western Europe Digital Twins Market Analysis, Opportunity and Forecast, 2016-2032
- 5.1. Western Europe Digital Twins Market Analysis, 2016-2021
- 5.2. Western Europe Digital Twins Market Opportunity and Forecast, 2023-2032
- 5.3. Western Europe Digital Twins Market Analysis, Opportunity and Forecast, By Type, 2016-2032
- 5.3.1. Western Europe Digital Twins Market Analysis by Type: Introduction
- 5.3.2. Market Size Absolute $ Opportunity Analysis and Forecast, By Type, 2016-2032
- 5.3.3. Product Digital Twin
- 5.3.4. Process Digital Twin
- 5.3.5. System Digital Twin
- 5.4. Western Europe Digital Twins Market Analysis, Opportunity and Forecast, By Technology, 2016-2032
- 5.4.1. Western Europe Digital Twins Market Analysis by Technology: Introduction
- 5.4.2. Market Size Absolute $ Opportunity Analysis and Forecast, By Technology, 2016-2032
- 5.4.3. IoT and IIoT
- 5.4.4. Blockchain
- 5.4.5. Artificial Intelligence and Machine Learning
- 5.4.6. Augmented Reality, Virtual Reality, and Mixed Reality
- 5.4.7. Big Data Analytics
- 5.4.8. 5G
- 5.5. Western Europe Digital Twins Market Analysis, Opportunity and Forecast, By End-User, 2016-2032
- 5.5.1. Western Europe Digital Twins Market Analysis by End-User: Introduction
- 5.5.2. Market Size Absolute $ Opportunity Analysis and Forecast, By End-User, 2016-2032
- 5.5.3. Aerospace and Defense
- 5.5.4. Automotive & Transportation
- 5.5.5. Healthcare
- 5.5.6. Energy & Utilities
- 5.5.7. Oil and Gas
- 5.5.8. Agriculture
- 5.5.9. Other End-Users
- 5.6. Western Europe Digital Twins Market Analysis, Opportunity and Forecast, By Country , 2016-2032
- 5.6.1. Western Europe Digital Twins Market Analysis by Country : Introduction
- 5.6.2. Market Size Absolute $ Opportunity Analysis and Forecast, Country , 2016-2032
- 5.6.2.1. Germany
- 5.6.2.2. France
- 5.6.2.3. The UK
- 5.6.2.4. Spain
- 5.6.2.5. Italy
- 5.6.2.6. Portugal
- 5.6.2.7. Ireland
- 5.6.2.8. Austria
- 5.6.2.9. Switzerland
- 5.6.2.10. Benelux
- 5.6.2.11. Nordic
- 5.6.2.12. Rest of Western Europe
- 6. Eastern Europe Digital Twins Market Analysis, Opportunity and Forecast, 2016-2032
- 6.1. Eastern Europe Digital Twins Market Analysis, 2016-2021
- 6.2. Eastern Europe Digital Twins Market Opportunity and Forecast, 2023-2032
- 6.3. Eastern Europe Digital Twins Market Analysis, Opportunity and Forecast, By Type, 2016-2032
- 6.3.1. Eastern Europe Digital Twins Market Analysis by Type: Introduction
- 6.3.2. Market Size Absolute $ Opportunity Analysis and Forecast, By Type, 2016-2032
- 6.3.3. Product Digital Twin
- 6.3.4. Process Digital Twin
- 6.3.5. System Digital Twin
- 6.4. Eastern Europe Digital Twins Market Analysis, Opportunity and Forecast, By Technology, 2016-2032
- 6.4.1. Eastern Europe Digital Twins Market Analysis by Technology: Introduction
- 6.4.2. Market Size Absolute $ Opportunity Analysis and Forecast, By Technology, 2016-2032
- 6.4.3. IoT and IIoT
- 6.4.4. Blockchain
- 6.4.5. Artificial Intelligence and Machine Learning
- 6.4.6. Augmented Reality, Virtual Reality, and Mixed Reality
- 6.4.7. Big Data Analytics
- 6.4.8. 5G
- 6.5. Eastern Europe Digital Twins Market Analysis, Opportunity and Forecast, By End-User, 2016-2032
- 6.5.1. Eastern Europe Digital Twins Market Analysis by End-User: Introduction
- 6.5.2. Market Size Absolute $ Opportunity Analysis and Forecast, By End-User, 2016-2032
- 6.5.3. Aerospace and Defense
- 6.5.4. Automotive & Transportation
- 6.5.5. Healthcare
- 6.5.6. Energy & Utilities
- 6.5.7. Oil and Gas
- 6.5.8. Agriculture
- 6.5.9. Other End-Users
- 6.6. Eastern Europe Digital Twins Market Analysis, Opportunity and Forecast, By Country , 2016-2032
- 6.6.1. Eastern Europe Digital Twins Market Analysis by Country : Introduction
- 6.6.2. Market Size Absolute $ Opportunity Analysis and Forecast, Country , 2016-2032
- 6.6.2.1. Russia
- 6.6.2.2. Poland
- 6.6.2.3. The Czech Republic
- 6.6.2.4. Greece
- 6.6.2.5. Rest of Eastern Europe
- 7. APAC Digital Twins Market Analysis, Opportunity and Forecast, 2016-2032
- 7.1. APAC Digital Twins Market Analysis, 2016-2021
- 7.2. APAC Digital Twins Market Opportunity and Forecast, 2023-2032
- 7.3. APAC Digital Twins Market Analysis, Opportunity and Forecast, By Type, 2016-2032
- 7.3.1. APAC Digital Twins Market Analysis by Type: Introduction
- 7.3.2. Market Size Absolute $ Opportunity Analysis and Forecast, By Type, 2016-2032
- 7.3.3. Product Digital Twin
- 7.3.4. Process Digital Twin
- 7.3.5. System Digital Twin
- 7.4. APAC Digital Twins Market Analysis, Opportunity and Forecast, By Technology, 2016-2032
- 7.4.1. APAC Digital Twins Market Analysis by Technology: Introduction
- 7.4.2. Market Size Absolute $ Opportunity Analysis and Forecast, By Technology, 2016-2032
- 7.4.3. IoT and IIoT
- 7.4.4. Blockchain
- 7.4.5. Artificial Intelligence and Machine Learning
- 7.4.6. Augmented Reality, Virtual Reality, and Mixed Reality
- 7.4.7. Big Data Analytics
- 7.4.8. 5G
- 7.5. APAC Digital Twins Market Analysis, Opportunity and Forecast, By End-User, 2016-2032
- 7.5.1. APAC Digital Twins Market Analysis by End-User: Introduction
- 7.5.2. Market Size Absolute $ Opportunity Analysis and Forecast, By End-User, 2016-2032
- 7.5.3. Aerospace and Defense
- 7.5.4. Automotive & Transportation
- 7.5.5. Healthcare
- 7.5.6. Energy & Utilities
- 7.5.7. Oil and Gas
- 7.5.8. Agriculture
- 7.5.9. Other End-Users
- 7.6. APAC Digital Twins Market Analysis, Opportunity and Forecast, By Country , 2016-2032
- 7.6.1. APAC Digital Twins Market Analysis by Country : Introduction
- 7.6.2. Market Size Absolute $ Opportunity Analysis and Forecast, Country , 2016-2032
- 7.6.2.1. China
- 7.6.2.2. Japan
- 7.6.2.3. South Korea
- 7.6.2.4. India
- 7.6.2.5. Australia & New Zeland
- 7.6.2.6. Indonesia
- 7.6.2.7. Malaysia
- 7.6.2.8. Philippines
- 7.6.2.9. Singapore
- 7.6.2.10. Thailand
- 7.6.2.11. Vietnam
- 7.6.2.12. Rest of APAC
- 8. Latin America Digital Twins Market Analysis, Opportunity and Forecast, 2016-2032
- 8.1. Latin America Digital Twins Market Analysis, 2016-2021
- 8.2. Latin America Digital Twins Market Opportunity and Forecast, 2023-2032
- 8.3. Latin America Digital Twins Market Analysis, Opportunity and Forecast, By Type, 2016-2032
- 8.3.1. Latin America Digital Twins Market Analysis by Type: Introduction
- 8.3.2. Market Size Absolute $ Opportunity Analysis and Forecast, By Type, 2016-2032
- 8.3.3. Product Digital Twin
- 8.3.4. Process Digital Twin
- 8.3.5. System Digital Twin
- 8.4. Latin America Digital Twins Market Analysis, Opportunity and Forecast, By Technology, 2016-2032
- 8.4.1. Latin America Digital Twins Market Analysis by Technology: Introduction
- 8.4.2. Market Size Absolute $ Opportunity Analysis and Forecast, By Technology, 2016-2032
- 8.4.3. IoT and IIoT
- 8.4.4. Blockchain
- 8.4.5. Artificial Intelligence and Machine Learning
- 8.4.6. Augmented Reality, Virtual Reality, and Mixed Reality
- 8.4.7. Big Data Analytics
- 8.4.8. 5G
- 8.5. Latin America Digital Twins Market Analysis, Opportunity and Forecast, By End-User, 2016-2032
- 8.5.1. Latin America Digital Twins Market Analysis by End-User: Introduction
- 8.5.2. Market Size Absolute $ Opportunity Analysis and Forecast, By End-User, 2016-2032
- 8.5.3. Aerospace and Defense
- 8.5.4. Automotive & Transportation
- 8.5.5. Healthcare
- 8.5.6. Energy & Utilities
- 8.5.7. Oil and Gas
- 8.5.8. Agriculture
- 8.5.9. Other End-Users
- 8.6. Latin America Digital Twins Market Analysis, Opportunity and Forecast, By Country , 2016-2032
- 8.6.1. Latin America Digital Twins Market Analysis by Country : Introduction
- 8.6.2. Market Size Absolute $ Opportunity Analysis and Forecast, Country , 2016-2032
- 8.6.2.1. Brazil
- 8.6.2.2. Colombia
- 8.6.2.3. Chile
- 8.6.2.4. Argentina
- 8.6.2.5. Costa Rica
- 8.6.2.6. Rest of Latin America
- 9. Middle East & Africa Digital Twins Market Analysis, Opportunity and Forecast, 2016-2032
- 9.1. Middle East & Africa Digital Twins Market Analysis, 2016-2021
- 9.2. Middle East & Africa Digital Twins Market Opportunity and Forecast, 2023-2032
- 9.3. Middle East & Africa Digital Twins Market Analysis, Opportunity and Forecast, By Type, 2016-2032
- 9.3.1. Middle East & Africa Digital Twins Market Analysis by Type: Introduction
- 9.3.2. Market Size Absolute $ Opportunity Analysis and Forecast, By Type, 2016-2032
- 9.3.3. Product Digital Twin
- 9.3.4. Process Digital Twin
- 9.3.5. System Digital Twin
- 9.4. Middle East & Africa Digital Twins Market Analysis, Opportunity and Forecast, By Technology, 2016-2032
- 9.4.1. Middle East & Africa Digital Twins Market Analysis by Technology: Introduction
- 9.4.2. Market Size Absolute $ Opportunity Analysis and Forecast, By Technology, 2016-2032
- 9.4.3. IoT and IIoT
- 9.4.4. Blockchain
- 9.4.5. Artificial Intelligence and Machine Learning
- 9.4.6. Augmented Reality, Virtual Reality, and Mixed Reality
- 9.4.7. Big Data Analytics
- 9.4.8. 5G
- 9.5. Middle East & Africa Digital Twins Market Analysis, Opportunity and Forecast, By End-User, 2016-2032
- 9.5.1. Middle East & Africa Digital Twins Market Analysis by End-User: Introduction
- 9.5.2. Market Size Absolute $ Opportunity Analysis and Forecast, By End-User, 2016-2032
- 9.5.3. Aerospace and Defense
- 9.5.4. Automotive & Transportation
- 9.5.5. Healthcare
- 9.5.6. Energy & Utilities
- 9.5.7. Oil and Gas
- 9.5.8. Agriculture
- 9.5.9. Other End-Users
- 9.6. Middle East & Africa Digital Twins Market Analysis, Opportunity and Forecast, By Country , 2016-2032
- 9.6.1. Middle East & Africa Digital Twins Market Analysis by Country : Introduction
- 9.6.2. Market Size Absolute $ Opportunity Analysis and Forecast, Country , 2016-2032
- 9.6.2.1. Algeria
- 9.6.2.2. Egypt
- 9.6.2.3. Israel
- 9.6.2.4. Kuwait
- 9.6.2.5. Nigeria
- 9.6.2.6. Saudi Arabia
- 9.6.2.7. South Africa
- 9.6.2.8. Turkey
- 9.6.2.9. The UAE
- 9.6.2.10. Rest of MEA
- 10. Global Digital Twins Market Analysis, Opportunity and Forecast, By Region , 2016-2032
- 10.1. Global Digital Twins Market Analysis by Region : Introduction
- 10.2. Market Size Absolute $ Opportunity Analysis and Forecast, By Region , 2016-2032
- 10.2.1. North America
- 10.2.2. Western Europe
- 10.2.3. Eastern Europe
- 10.2.4. APAC
- 10.2.5. Latin America
- 10.2.6. Middle East & Africa
- 11. Global Digital Twins Market Competitive Landscape, Market Share Analysis, and Company Profiles
- 11.1. Market Share Analysis
- 11.2. Company Profiles
- 11.3. General Electric Co.
- 11.3.1. Company Overview
- 11.3.2. Financial Highlights
- 11.3.3. Product Portfolio
- 11.3.4. SWOT Analysis
- 11.3.5. Key Strategies and Developments
- 11.4. Microsoft Corporation
- 11.4.1. Company Overview
- 11.4.2. Financial Highlights
- 11.4.3. Product Portfolio
- 11.4.4. SWOT Analysis
- 11.4.5. Key Strategies and Developments
- 11.5. Hitachi, Ltd.
- 11.5.1. Company Overview
- 11.5.2. Financial Highlights
- 11.5.3. Product Portfolio
- 11.5.4. SWOT Analysis
- 11.5.5. Key Strategies and Developments
- 11.6. Dassault Systèmes SE
- 11.6.1. Company Overview
- 11.6.2. Financial Highlights
- 11.6.3. Product Portfolio
- 11.6.4. SWOT Analysis
- 11.6.5. Key Strategies and Developments
- 11.7. Amazon Web Services, Inc.
- 11.7.1. Company Overview
- 11.7.2. Financial Highlights
- 11.7.3. Product Portfolio
- 11.7.4. SWOT Analysis
- 11.7.5. Key Strategies and Developments
- 11.8. Autodesk, Inc.
- 11.8.1. Company Overview
- 11.8.2. Financial Highlights
- 11.8.3. Product Portfolio
- 11.8.4. SWOT Analysis
- 11.8.5. Key Strategies and Developments
- 11.9. SAP SE
- 11.9.1. Company Overview
- 11.9.2. Financial Highlights
- 11.9.3. Product Portfolio
- 11.9.4. SWOT Analysis
- 11.9.5. Key Strategies and Developments
- 11.10. Siemens AG
- 11.10.1. Company Overview
- 11.10.2. Financial Highlights
- 11.10.3. Product Portfolio
- 11.10.4. SWOT Analysis
- 11.10.5. Key Strategies and Developments
- 11.11. Ansys, Inc.
- 11.11.1. Company Overview
- 11.11.2. Financial Highlights
- 11.11.3. Product Portfolio
- 11.11.4. SWOT Analysis
- 11.11.5. Key Strategies and Developments
- 11.12. PTC Inc.
- 11.12.1. Company Overview
- 11.12.2. Financial Highlights
- 11.12.3. Product Portfolio
- 11.12.4. SWOT Analysis
- 11.12.5. Key Strategies and Developments
- 11.13.1. Company Overview
- 11.13.2. Financial Highlights
- 11.13.3. Product Portfolio
- 11.13.4. SWOT Analysis
- 11.13.5. Key Strategies and Developments
- 11.14. IBM Corporation
- 11.14.1. Company Overview
- 11.14.2. Financial Highlights
- 11.14.3. Product Portfolio
- 11.14.4. SWOT Analysis
- 11.14.5. Key Strategies and Developments
- 11.15. Hexagon AB
- 11.15.1. Company Overview
- 11.15.2. Financial Highlights
- 11.15.3. Product Portfolio
- 11.15.4. SWOT Analysis
- 11.15.5. Key Strategies and Developments
- 11.16. AVEVA Group plc
- 11.16.1. Company Overview
- 11.16.2. Financial Highlights
- 11.16.3. Product Portfolio
- 11.16.4. SWOT Analysis
- 11.16.5. Key Strategies and Developments
- 11.17. Other Key Players
- 11.17.1. Company Overview
- 11.17.2. Financial Highlights
- 11.17.3. Product Portfolio
- 11.17.4. SWOT Analysis
- 11.17.5. Key Strategies and Developments
- 12. Assumptions and Acronyms
- 13. Research Methodology
- 14. Contact
"
- List of Figures
- "
- Figure 1: Global Digital Twins Market Revenue (US$ Mn) Market Share by Type in 2022
- Figure 2: Global Digital Twins Market Market Attractiveness Analysis by Type, 2016-2032
- Figure 3: Global Digital Twins Market Revenue (US$ Mn) Market Share by Technologyin 2022
- Figure 4: Global Digital Twins Market Market Attractiveness Analysis by Technology, 2016-2032
- Figure 5: Global Digital Twins Market Revenue (US$ Mn) Market Share by End-Userin 2022
- Figure 6: Global Digital Twins Market Market Attractiveness Analysis by End-User, 2016-2032
- Figure 7: Global Digital Twins Market Revenue (US$ Mn) Market Share by Region in 2022
- Figure 8: Global Digital Twins Market Market Attractiveness Analysis by Region, 2016-2032
- Figure 9: Global Digital Twins Market Market Revenue (US$ Mn) (2016-2032)
- Figure 10: Global Digital Twins Market Market Revenue (US$ Mn) Comparison by Region (2016-2032)
- Figure 11: Global Digital Twins Market Market Revenue (US$ Mn) Comparison by Type (2016-2032)
- Figure 12: Global Digital Twins Market Market Revenue (US$ Mn) Comparison by Technology (2016-2032)
- Figure 13: Global Digital Twins Market Market Revenue (US$ Mn) Comparison by End-User (2016-2032)
- Figure 14: Global Digital Twins Market Market Y-o-Y Growth Rate Comparison by Region (2016-2032)
- Figure 15: Global Digital Twins Market Market Y-o-Y Growth Rate Comparison by Type (2016-2032)
- Figure 16: Global Digital Twins Market Market Y-o-Y Growth Rate Comparison by Technology (2016-2032)
- Figure 17: Global Digital Twins Market Market Y-o-Y Growth Rate Comparison by End-User (2016-2032)
- Figure 18: Global Digital Twins Market Market Share Comparison by Region (2016-2032)
- Figure 19: Global Digital Twins Market Market Share Comparison by Type (2016-2032)
- Figure 20: Global Digital Twins Market Market Share Comparison by Technology (2016-2032)
- Figure 21: Global Digital Twins Market Market Share Comparison by End-User (2016-2032)
- Figure 22: North America Digital Twins Market Revenue (US$ Mn) Market Share by Typein 2022
- Figure 23: North America Digital Twins Market Market Attractiveness Analysis by Type, 2016-2032
- Figure 24: North America Digital Twins Market Revenue (US$ Mn) Market Share by Technologyin 2022
- Figure 25: North America Digital Twins Market Market Attractiveness Analysis by Technology, 2016-2032
- Figure 26: North America Digital Twins Market Revenue (US$ Mn) Market Share by End-Userin 2022
- Figure 27: North America Digital Twins Market Market Attractiveness Analysis by End-User, 2016-2032
- Figure 28: North America Digital Twins Market Revenue (US$ Mn) Market Share by Country in 2022
- Figure 29: North America Digital Twins Market Market Attractiveness Analysis by Country, 2016-2032
- Figure 30: North America Digital Twins Market Market Revenue (US$ Mn) (2016-2032)
- Figure 31: North America Digital Twins Market Market Revenue (US$ Mn) Comparison by Country (2016-2032)
- Figure 32: North America Digital Twins Market Market Revenue (US$ Mn) Comparison by Type (2016-2032)
- Figure 33: North America Digital Twins Market Market Revenue (US$ Mn) Comparison by Technology (2016-2032)
- Figure 34: North America Digital Twins Market Market Revenue (US$ Mn) Comparison by End-User (2016-2032)
- Figure 35: North America Digital Twins Market Market Y-o-Y Growth Rate Comparison by Country (2016-2032)
- Figure 36: North America Digital Twins Market Market Y-o-Y Growth Rate Comparison by Type (2016-2032)
- Figure 37: North America Digital Twins Market Market Y-o-Y Growth Rate Comparison by Technology (2016-2032)
- Figure 38: North America Digital Twins Market Market Y-o-Y Growth Rate Comparison by End-User (2016-2032)
- Figure 39: North America Digital Twins Market Market Share Comparison by Country (2016-2032)
- Figure 40: North America Digital Twins Market Market Share Comparison by Type (2016-2032)
- Figure 41: North America Digital Twins Market Market Share Comparison by Technology (2016-2032)
- Figure 42: North America Digital Twins Market Market Share Comparison by End-User (2016-2032)
- Figure 43: Western Europe Digital Twins Market Revenue (US$ Mn) Market Share by Typein 2022
- Figure 44: Western Europe Digital Twins Market Market Attractiveness Analysis by Type, 2016-2032
- Figure 45: Western Europe Digital Twins Market Revenue (US$ Mn) Market Share by Technologyin 2022
- Figure 46: Western Europe Digital Twins Market Market Attractiveness Analysis by Technology, 2016-2032
- Figure 47: Western Europe Digital Twins Market Revenue (US$ Mn) Market Share by End-Userin 2022
- Figure 48: Western Europe Digital Twins Market Market Attractiveness Analysis by End-User, 2016-2032
- Figure 49: Western Europe Digital Twins Market Revenue (US$ Mn) Market Share by Country in 2022
- Figure 50: Western Europe Digital Twins Market Market Attractiveness Analysis by Country, 2016-2032
- Figure 51: Western Europe Digital Twins Market Market Revenue (US$ Mn) (2016-2032)
- Figure 52: Western Europe Digital Twins Market Market Revenue (US$ Mn) Comparison by Country (2016-2032)
- Figure 53: Western Europe Digital Twins Market Market Revenue (US$ Mn) Comparison by Type (2016-2032)
- Figure 54: Western Europe Digital Twins Market Market Revenue (US$ Mn) Comparison by Technology (2016-2032)
- Figure 55: Western Europe Digital Twins Market Market Revenue (US$ Mn) Comparison by End-User (2016-2032)
- Figure 56: Western Europe Digital Twins Market Market Y-o-Y Growth Rate Comparison by Country (2016-2032)
- Figure 57: Western Europe Digital Twins Market Market Y-o-Y Growth Rate Comparison by Type (2016-2032)
- Figure 58: Western Europe Digital Twins Market Market Y-o-Y Growth Rate Comparison by Technology (2016-2032)
- Figure 59: Western Europe Digital Twins Market Market Y-o-Y Growth Rate Comparison by End-User (2016-2032)
- Figure 60: Western Europe Digital Twins Market Market Share Comparison by Country (2016-2032)
- Figure 61: Western Europe Digital Twins Market Market Share Comparison by Type (2016-2032)
- Figure 62: Western Europe Digital Twins Market Market Share Comparison by Technology (2016-2032)
- Figure 63: Western Europe Digital Twins Market Market Share Comparison by End-User (2016-2032)
- Figure 64: Eastern Europe Digital Twins Market Revenue (US$ Mn) Market Share by Typein 2022
- Figure 65: Eastern Europe Digital Twins Market Market Attractiveness Analysis by Type, 2016-2032
- Figure 66: Eastern Europe Digital Twins Market Revenue (US$ Mn) Market Share by Technologyin 2022
- Figure 67: Eastern Europe Digital Twins Market Market Attractiveness Analysis by Technology, 2016-2032
- Figure 68: Eastern Europe Digital Twins Market Revenue (US$ Mn) Market Share by End-Userin 2022
- Figure 69: Eastern Europe Digital Twins Market Market Attractiveness Analysis by End-User, 2016-2032
- Figure 70: Eastern Europe Digital Twins Market Revenue (US$ Mn) Market Share by Country in 2022
- Figure 71: Eastern Europe Digital Twins Market Market Attractiveness Analysis by Country, 2016-2032
- Figure 72: Eastern Europe Digital Twins Market Market Revenue (US$ Mn) (2016-2032)
- Figure 73: Eastern Europe Digital Twins Market Market Revenue (US$ Mn) Comparison by Country (2016-2032)
- Figure 74: Eastern Europe Digital Twins Market Market Revenue (US$ Mn) Comparison by Type (2016-2032)
- Figure 75: Eastern Europe Digital Twins Market Market Revenue (US$ Mn) Comparison by Technology (2016-2032)
- Figure 76: Eastern Europe Digital Twins Market Market Revenue (US$ Mn) Comparison by End-User (2016-2032)
- Figure 77: Eastern Europe Digital Twins Market Market Y-o-Y Growth Rate Comparison by Country (2016-2032)
- Figure 78: Eastern Europe Digital Twins Market Market Y-o-Y Growth Rate Comparison by Type (2016-2032)
- Figure 79: Eastern Europe Digital Twins Market Market Y-o-Y Growth Rate Comparison by Technology (2016-2032)
- Figure 80: Eastern Europe Digital Twins Market Market Y-o-Y Growth Rate Comparison by End-User (2016-2032)
- Figure 81: Eastern Europe Digital Twins Market Market Share Comparison by Country (2016-2032)
- Figure 82: Eastern Europe Digital Twins Market Market Share Comparison by Type (2016-2032)
- Figure 83: Eastern Europe Digital Twins Market Market Share Comparison by Technology (2016-2032)
- Figure 84: Eastern Europe Digital Twins Market Market Share Comparison by End-User (2016-2032)
- Figure 85: APAC Digital Twins Market Revenue (US$ Mn) Market Share by Typein 2022
- Figure 86: APAC Digital Twins Market Market Attractiveness Analysis by Type, 2016-2032
- Figure 87: APAC Digital Twins Market Revenue (US$ Mn) Market Share by Technologyin 2022
- Figure 88: APAC Digital Twins Market Market Attractiveness Analysis by Technology, 2016-2032
- Figure 89: APAC Digital Twins Market Revenue (US$ Mn) Market Share by End-Userin 2022
- Figure 90: APAC Digital Twins Market Market Attractiveness Analysis by End-User, 2016-2032
- Figure 91: APAC Digital Twins Market Revenue (US$ Mn) Market Share by Country in 2022
- Figure 92: APAC Digital Twins Market Market Attractiveness Analysis by Country, 2016-2032
- Figure 93: APAC Digital Twins Market Market Revenue (US$ Mn) (2016-2032)
- Figure 94: APAC Digital Twins Market Market Revenue (US$ Mn) Comparison by Country (2016-2032)
- Figure 95: APAC Digital Twins Market Market Revenue (US$ Mn) Comparison by Type (2016-2032)
- Figure 96: APAC Digital Twins Market Market Revenue (US$ Mn) Comparison by Technology (2016-2032)
- Figure 97: APAC Digital Twins Market Market Revenue (US$ Mn) Comparison by End-User (2016-2032)
- Figure 98: APAC Digital Twins Market Market Y-o-Y Growth Rate Comparison by Country (2016-2032)
- Figure 99: APAC Digital Twins Market Market Y-o-Y Growth Rate Comparison by Type (2016-2032)
- Figure 100: APAC Digital Twins Market Market Y-o-Y Growth Rate Comparison by Technology (2016-2032)
- Figure 101: APAC Digital Twins Market Market Y-o-Y Growth Rate Comparison by End-User (2016-2032)
- Figure 102: APAC Digital Twins Market Market Share Comparison by Country (2016-2032)
- Figure 103: APAC Digital Twins Market Market Share Comparison by Type (2016-2032)
- Figure 104: APAC Digital Twins Market Market Share Comparison by Technology (2016-2032)
- Figure 105: APAC Digital Twins Market Market Share Comparison by End-User (2016-2032)
- Figure 106: Latin America Digital Twins Market Revenue (US$ Mn) Market Share by Typein 2022
- Figure 107: Latin America Digital Twins Market Market Attractiveness Analysis by Type, 2016-2032
- Figure 108: Latin America Digital Twins Market Revenue (US$ Mn) Market Share by Technologyin 2022
- Figure 109: Latin America Digital Twins Market Market Attractiveness Analysis by Technology, 2016-2032
- Figure 110: Latin America Digital Twins Market Revenue (US$ Mn) Market Share by End-Userin 2022
- Figure 111: Latin America Digital Twins Market Market Attractiveness Analysis by End-User, 2016-2032
- Figure 112: Latin America Digital Twins Market Revenue (US$ Mn) Market Share by Country in 2022
- Figure 113: Latin America Digital Twins Market Market Attractiveness Analysis by Country, 2016-2032
- Figure 114: Latin America Digital Twins Market Market Revenue (US$ Mn) (2016-2032)
- Figure 115: Latin America Digital Twins Market Market Revenue (US$ Mn) Comparison by Country (2016-2032)
- Figure 116: Latin America Digital Twins Market Market Revenue (US$ Mn) Comparison by Type (2016-2032)
- Figure 117: Latin America Digital Twins Market Market Revenue (US$ Mn) Comparison by Technology (2016-2032)
- Figure 118: Latin America Digital Twins Market Market Revenue (US$ Mn) Comparison by End-User (2016-2032)
- Figure 119: Latin America Digital Twins Market Market Y-o-Y Growth Rate Comparison by Country (2016-2032)
- Figure 120: Latin America Digital Twins Market Market Y-o-Y Growth Rate Comparison by Type (2016-2032)
- Figure 121: Latin America Digital Twins Market Market Y-o-Y Growth Rate Comparison by Technology (2016-2032)
- Figure 122: Latin America Digital Twins Market Market Y-o-Y Growth Rate Comparison by End-User (2016-2032)
- Figure 123: Latin America Digital Twins Market Market Share Comparison by Country (2016-2032)
- Figure 124: Latin America Digital Twins Market Market Share Comparison by Type (2016-2032)
- Figure 125: Latin America Digital Twins Market Market Share Comparison by Technology (2016-2032)
- Figure 126: Latin America Digital Twins Market Market Share Comparison by End-User (2016-2032)
- Figure 127: Middle East & Africa Digital Twins Market Revenue (US$ Mn) Market Share by Typein 2022
- Figure 128: Middle East & Africa Digital Twins Market Market Attractiveness Analysis by Type, 2016-2032
- Figure 129: Middle East & Africa Digital Twins Market Revenue (US$ Mn) Market Share by Technologyin 2022
- Figure 130: Middle East & Africa Digital Twins Market Market Attractiveness Analysis by Technology, 2016-2032
- Figure 131: Middle East & Africa Digital Twins Market Revenue (US$ Mn) Market Share by End-Userin 2022
- Figure 132: Middle East & Africa Digital Twins Market Market Attractiveness Analysis by End-User, 2016-2032
- Figure 133: Middle East & Africa Digital Twins Market Revenue (US$ Mn) Market Share by Country in 2022
- Figure 134: Middle East & Africa Digital Twins Market Market Attractiveness Analysis by Country, 2016-2032
- Figure 135: Middle East & Africa Digital Twins Market Market Revenue (US$ Mn) (2016-2032)
- Figure 136: Middle East & Africa Digital Twins Market Market Revenue (US$ Mn) Comparison by Country (2016-2032)
- Figure 137: Middle East & Africa Digital Twins Market Market Revenue (US$ Mn) Comparison by Type (2016-2032)
- Figure 138: Middle East & Africa Digital Twins Market Market Revenue (US$ Mn) Comparison by Technology (2016-2032)
- Figure 139: Middle East & Africa Digital Twins Market Market Revenue (US$ Mn) Comparison by End-User (2016-2032)
- Figure 140: Middle East & Africa Digital Twins Market Market Y-o-Y Growth Rate Comparison by Country (2016-2032)
- Figure 141: Middle East & Africa Digital Twins Market Market Y-o-Y Growth Rate Comparison by Type (2016-2032)
- Figure 142: Middle East & Africa Digital Twins Market Market Y-o-Y Growth Rate Comparison by Technology (2016-2032)
- Figure 143: Middle East & Africa Digital Twins Market Market Y-o-Y Growth Rate Comparison by End-User (2016-2032)
- Figure 144: Middle East & Africa Digital Twins Market Market Share Comparison by Country (2016-2032)
- Figure 145: Middle East & Africa Digital Twins Market Market Share Comparison by Type (2016-2032)
- Figure 146: Middle East & Africa Digital Twins Market Market Share Comparison by Technology (2016-2032)
- Figure 147: Middle East & Africa Digital Twins Market Market Share Comparison by End-User (2016-2032)
"
- List of Tables
- "
- Table 1: Global Digital Twins Market Market Comparison by Type (2016-2032)
- Table 2: Global Digital Twins Market Market Comparison by Technology (2016-2032)
- Table 3: Global Digital Twins Market Market Comparison by End-User (2016-2032)
- Table 4: Global Digital Twins Market Revenue (US$ Mn) Comparison by Region (2016-2032)
- Table 5: Global Digital Twins Market Market Revenue (US$ Mn) (2016-2032)
- Table 6: Global Digital Twins Market Market Revenue (US$ Mn) Comparison by Region (2016-2032)
- Table 7: Global Digital Twins Market Market Revenue (US$ Mn) Comparison by Type (2016-2032)
- Table 8: Global Digital Twins Market Market Revenue (US$ Mn) Comparison by Technology (2016-2032)
- Table 9: Global Digital Twins Market Market Revenue (US$ Mn) Comparison by End-User (2016-2032)
- Table 10: Global Digital Twins Market Market Y-o-Y Growth Rate Comparison by Region (2016-2032)
- Table 11: Global Digital Twins Market Market Y-o-Y Growth Rate Comparison by Type (2016-2032)
- Table 12: Global Digital Twins Market Market Y-o-Y Growth Rate Comparison by Technology (2016-2032)
- Table 13: Global Digital Twins Market Market Y-o-Y Growth Rate Comparison by End-User (2016-2032)
- Table 14: Global Digital Twins Market Market Share Comparison by Region (2016-2032)
- Table 15: Global Digital Twins Market Market Share Comparison by Type (2016-2032)
- Table 16: Global Digital Twins Market Market Share Comparison by Technology (2016-2032)
- Table 17: Global Digital Twins Market Market Share Comparison by End-User (2016-2032)
- Table 18: North America Digital Twins Market Market Comparison by Technology (2016-2032)
- Table 19: North America Digital Twins Market Market Comparison by End-User (2016-2032)
- Table 20: North America Digital Twins Market Revenue (US$ Mn) Comparison by Country (2016-2032)
- Table 21: North America Digital Twins Market Market Revenue (US$ Mn) (2016-2032)
- Table 22: North America Digital Twins Market Market Revenue (US$ Mn) Comparison by Country (2016-2032)
- Table 23: North America Digital Twins Market Market Revenue (US$ Mn) Comparison by Type (2016-2032)
- Table 24: North America Digital Twins Market Market Revenue (US$ Mn) Comparison by Technology (2016-2032)
- Table 25: North America Digital Twins Market Market Revenue (US$ Mn) Comparison by End-User (2016-2032)
- Table 26: North America Digital Twins Market Market Y-o-Y Growth Rate Comparison by Country (2016-2032)
- Table 27: North America Digital Twins Market Market Y-o-Y Growth Rate Comparison by Type (2016-2032)
- Table 28: North America Digital Twins Market Market Y-o-Y Growth Rate Comparison by Technology (2016-2032)
- Table 29: North America Digital Twins Market Market Y-o-Y Growth Rate Comparison by End-User (2016-2032)
- Table 30: North America Digital Twins Market Market Share Comparison by Country (2016-2032)
- Table 31: North America Digital Twins Market Market Share Comparison by Type (2016-2032)
- Table 32: North America Digital Twins Market Market Share Comparison by Technology (2016-2032)
- Table 33: North America Digital Twins Market Market Share Comparison by End-User (2016-2032)
- Table 34: Western Europe Digital Twins Market Market Comparison by Type (2016-2032)
- Table 35: Western Europe Digital Twins Market Market Comparison by Technology (2016-2032)
- Table 36: Western Europe Digital Twins Market Market Comparison by End-User (2016-2032)
- Table 37: Western Europe Digital Twins Market Revenue (US$ Mn) Comparison by Country (2016-2032)
- Table 38: Western Europe Digital Twins Market Market Revenue (US$ Mn) (2016-2032)
- Table 39: Western Europe Digital Twins Market Market Revenue (US$ Mn) Comparison by Country (2016-2032)
- Table 40: Western Europe Digital Twins Market Market Revenue (US$ Mn) Comparison by Type (2016-2032)
- Table 41: Western Europe Digital Twins Market Market Revenue (US$ Mn) Comparison by Technology (2016-2032)
- Table 42: Western Europe Digital Twins Market Market Revenue (US$ Mn) Comparison by End-User (2016-2032)
- Table 43: Western Europe Digital Twins Market Market Y-o-Y Growth Rate Comparison by Country (2016-2032)
- Table 44: Western Europe Digital Twins Market Market Y-o-Y Growth Rate Comparison by Type (2016-2032)
- Table 45: Western Europe Digital Twins Market Market Y-o-Y Growth Rate Comparison by Technology (2016-2032)
- Table 46: Western Europe Digital Twins Market Market Y-o-Y Growth Rate Comparison by End-User (2016-2032)
- Table 47: Western Europe Digital Twins Market Market Share Comparison by Country (2016-2032)
- Table 48: Western Europe Digital Twins Market Market Share Comparison by Type (2016-2032)
- Table 49: Western Europe Digital Twins Market Market Share Comparison by Technology (2016-2032)
- Table 50: Western Europe Digital Twins Market Market Share Comparison by End-User (2016-2032)
- Table 51: Eastern Europe Digital Twins Market Market Comparison by Type (2016-2032)
- Table 52: Eastern Europe Digital Twins Market Market Comparison by Technology (2016-2032)
- Table 53: Eastern Europe Digital Twins Market Market Comparison by End-User (2016-2032)
- Table 54: Eastern Europe Digital Twins Market Revenue (US$ Mn) Comparison by Country (2016-2032)
- Table 55: Eastern Europe Digital Twins Market Market Revenue (US$ Mn) (2016-2032)
- Table 56: Eastern Europe Digital Twins Market Market Revenue (US$ Mn) Comparison by Country (2016-2032)
- Table 57: Eastern Europe Digital Twins Market Market Revenue (US$ Mn) Comparison by Type (2016-2032)
- Table 58: Eastern Europe Digital Twins Market Market Revenue (US$ Mn) Comparison by Technology (2016-2032)
- Table 59: Eastern Europe Digital Twins Market Market Revenue (US$ Mn) Comparison by End-User (2016-2032)
- Table 60: Eastern Europe Digital Twins Market Market Y-o-Y Growth Rate Comparison by Country (2016-2032)
- Table 61: Eastern Europe Digital Twins Market Market Y-o-Y Growth Rate Comparison by Type (2016-2032)
- Table 62: Eastern Europe Digital Twins Market Market Y-o-Y Growth Rate Comparison by Technology (2016-2032)
- Table 63: Eastern Europe Digital Twins Market Market Y-o-Y Growth Rate Comparison by End-User (2016-2032)
- Table 64: Eastern Europe Digital Twins Market Market Share Comparison by Country (2016-2032)
- Table 65: Eastern Europe Digital Twins Market Market Share Comparison by Type (2016-2032)
- Table 66: Eastern Europe Digital Twins Market Market Share Comparison by Technology (2016-2032)
- Table 67: Eastern Europe Digital Twins Market Market Share Comparison by End-User (2016-2032)
- Table 68: APAC Digital Twins Market Market Comparison by Type (2016-2032)
- Table 69: APAC Digital Twins Market Market Comparison by Technology (2016-2032)
- Table 70: APAC Digital Twins Market Market Comparison by End-User (2016-2032)
- Table 71: APAC Digital Twins Market Revenue (US$ Mn) Comparison by Country (2016-2032)
- Table 72: APAC Digital Twins Market Market Revenue (US$ Mn) (2016-2032)
- Table 73: APAC Digital Twins Market Market Revenue (US$ Mn) Comparison by Country (2016-2032)
- Table 74: APAC Digital Twins Market Market Revenue (US$ Mn) Comparison by Type (2016-2032)
- Table 75: APAC Digital Twins Market Market Revenue (US$ Mn) Comparison by Technology (2016-2032)
- Table 76: APAC Digital Twins Market Market Revenue (US$ Mn) Comparison by End-User (2016-2032)
- Table 77: APAC Digital Twins Market Market Y-o-Y Growth Rate Comparison by Country (2016-2032)
- Table 78: APAC Digital Twins Market Market Y-o-Y Growth Rate Comparison by Type (2016-2032)
- Table 79: APAC Digital Twins Market Market Y-o-Y Growth Rate Comparison by Technology (2016-2032)
- Table 80: APAC Digital Twins Market Market Y-o-Y Growth Rate Comparison by End-User (2016-2032)
- Table 81: APAC Digital Twins Market Market Share Comparison by Country (2016-2032)
- Table 82: APAC Digital Twins Market Market Share Comparison by Type (2016-2032)
- Table 83: APAC Digital Twins Market Market Share Comparison by Technology (2016-2032)
- Table 84: APAC Digital Twins Market Market Share Comparison by End-User (2016-2032)
- Table 85: Latin America Digital Twins Market Market Comparison by Type (2016-2032)
- Table 86: Latin America Digital Twins Market Market Comparison by Technology (2016-2032)
- Table 87: Latin America Digital Twins Market Market Comparison by End-User (2016-2032)
- Table 88: Latin America Digital Twins Market Revenue (US$ Mn) Comparison by Country (2016-2032)
- Table 89: Latin America Digital Twins Market Market Revenue (US$ Mn) (2016-2032)
- Table 90: Latin America Digital Twins Market Market Revenue (US$ Mn) Comparison by Country (2016-2032)
- Table 91: Latin America Digital Twins Market Market Revenue (US$ Mn) Comparison by Type (2016-2032)
- Table 92: Latin America Digital Twins Market Market Revenue (US$ Mn) Comparison by Technology (2016-2032)
- Table 93: Latin America Digital Twins Market Market Revenue (US$ Mn) Comparison by End-User (2016-2032)
- Table 94: Latin America Digital Twins Market Market Y-o-Y Growth Rate Comparison by Country (2016-2032)
- Table 95: Latin America Digital Twins Market Market Y-o-Y Growth Rate Comparison by Type (2016-2032)
- Table 96: Latin America Digital Twins Market Market Y-o-Y Growth Rate Comparison by Technology (2016-2032)
- Table 97: Latin America Digital Twins Market Market Y-o-Y Growth Rate Comparison by End-User (2016-2032)
- Table 98: Latin America Digital Twins Market Market Share Comparison by Country (2016-2032)
- Table 99: Latin America Digital Twins Market Market Share Comparison by Type (2016-2032)
- Table 100: Latin America Digital Twins Market Market Share Comparison by Technology (2016-2032)
- Table 101: Latin America Digital Twins Market Market Share Comparison by End-User (2016-2032)
- Table 102: Middle East & Africa Digital Twins Market Market Comparison by Type (2016-2032)
- Table 103: Middle East & Africa Digital Twins Market Market Comparison by Technology (2016-2032)
- Table 104: Middle East & Africa Digital Twins Market Market Comparison by End-User (2016-2032)
- Table 105: Middle East & Africa Digital Twins Market Revenue (US$ Mn) Comparison by Country (2016-2032)
- Table 106: Middle East & Africa Digital Twins Market Market Revenue (US$ Mn) (2016-2032)
- Table 107: Middle East & Africa Digital Twins Market Market Revenue (US$ Mn) Comparison by Country (2016-2032)
- Table 108: Middle East & Africa Digital Twins Market Market Revenue (US$ Mn) Comparison by Type (2016-2032)
- Table 109: Middle East & Africa Digital Twins Market Market Revenue (US$ Mn) Comparison by Technology (2016-2032)
- Table 110: Middle East & Africa Digital Twins Market Market Revenue (US$ Mn) Comparison by End-User (2016-2032)
- Table 111: Middle East & Africa Digital Twins Market Market Y-o-Y Growth Rate Comparison by Country (2016-2032)
- Table 112: Middle East & Africa Digital Twins Market Market Y-o-Y Growth Rate Comparison by Type (2016-2032)
- Table 113: Middle East & Africa Digital Twins Market Market Y-o-Y Growth Rate Comparison by Technology (2016-2032)
- Table 114: Middle East & Africa Digital Twins Market Market Y-o-Y Growth Rate Comparison by End-User (2016-2032)
- Table 115: Middle East & Africa Digital Twins Market Market Share Comparison by Country (2016-2032)
- Table 116: Middle East & Africa Digital Twins Market Market Share Comparison by Type (2016-2032)
- Table 117: Middle East & Africa Digital Twins Market Market Share Comparison by Technology (2016-2032)
- Table 118: Middle East & Africa Digital Twins Market Market Share Comparison by End-User (2016-2032)
- 1. Executive Summary
-
- General Electric Co.
- Microsoft Corporation
- Hitachi, Ltd.
- Dassault Systèmes SE
- Amazon Web Services, Inc.
- Autodesk, Inc.
- SAP SE
- Siemens AG
- Ansys, Inc.
- PTC Inc.
- IBM Corporation
- ABB Ltd.
- Hexagon AB
- AVEVA Group plc
- Other Key Players
Our Clients


View Our Licence Options
