
Digital Experience Platform Market By Component (Platform, Services), By Deployment Mode (On-Premise, Cloud), By Industry Vertical (BFSI, IT & Telecommunication, Government Sector,and Other ), By Region And Companies - Industry Segment Outlook, Market Assessment, Competition Scenario, Trends, And Forecast 2023-2032
-
39900
-
July 2023
-
179
-


-
This report was compiled by Vishwa Gaul Vishwa is an experienced market research and consulting professional with over 8 years of expertise in the ICT industry, contributing to over 700 reports across telecommunications, software, hardware, and digital solutions. Correspondence Team Lead- ICT Linkedin | Detailed Market research Methodology Our methodology involves a mix of primary research, including interviews with leading mental health experts, and secondary research from reputable medical journals and databases. View Detailed Methodology Page
-
Quick Navigation
Report Overview
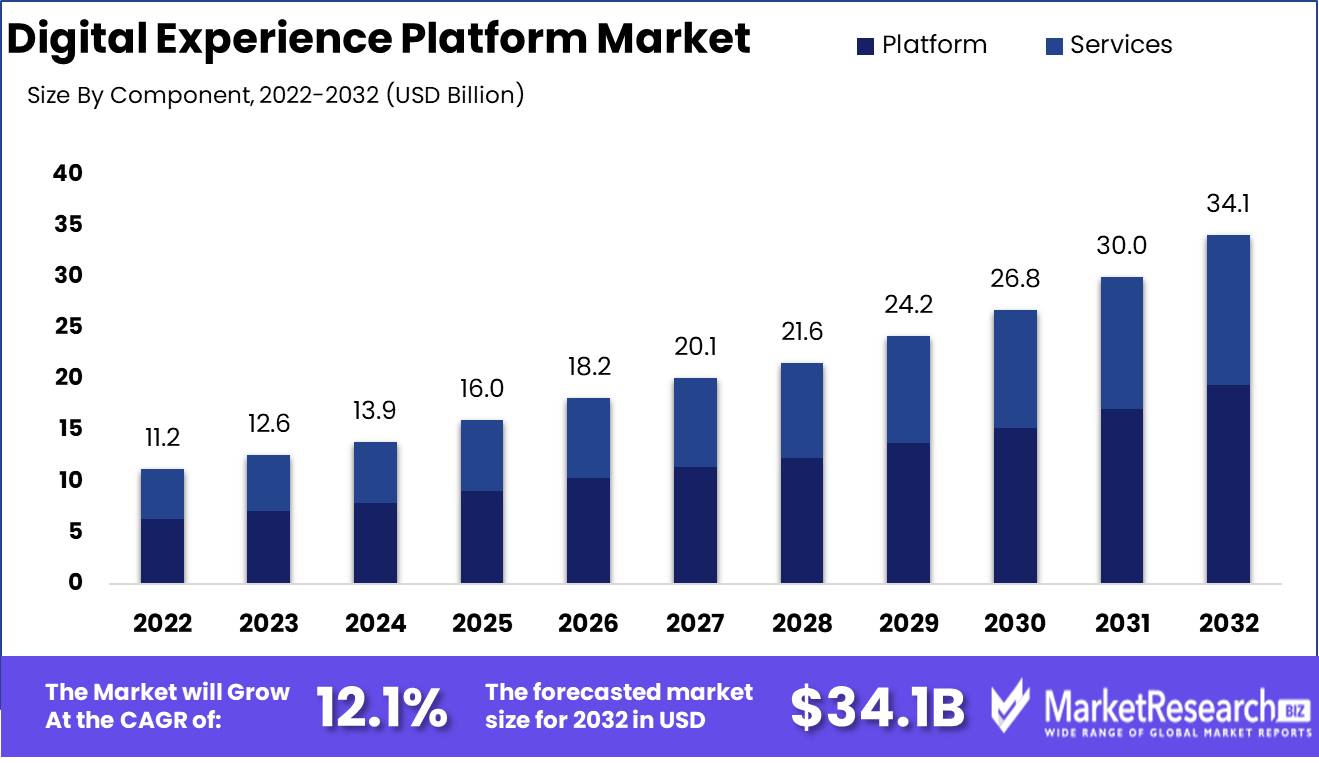
Digital Experience Platform Market size is expected to be worth around USD 34.1 Bn by 2032 from USD 11.2 Bn in 2022, growing at a CAGR of 12.1% during the forecast period from 2023 to 2032.
The digital experience platform market, also known as DXPs, refers to all-encompassing technological solutions that are specifically developed to facilitate businesses in providing integrated and personalized digital experiences across various touchpoints. These touchpoints include websites, mobile applications, social media platforms, and email campaigns. The objective is to enhance the ease of customer experiences, irrespective of the specific channel or device utilized by customers.
The significance of the digital experience platform market is paramount in an era where customers have high expectations for exceptional experiences across all touchpoints. A well-executed digital experience platform enables businesses to augment customer engagement, bolster brand loyalty, and drive revenue growth through the provision of personalized and pertinent content. This facilitates the establishment of significant connections with their intended customers, resulting in heightened satisfaction and improved rates of customer retention.
The primary advantage of digital experience platforms resides in their capacity to consolidate diverse tools and technologies onto a single platform, thereby facilitating the administration of intricate digital experiences for businesses and enhancing operational effectiveness. Moreover, these platforms frequently possess robust analytics and reporting capabilities, which provide valuable insights into customer preferences and behavior.
In recent years, there has been a notable progression in the digital experience platform markets, characterized by the emergence of various vendors offering state-of-the-art solutions. Prominent among these advancements are the incorporation of artificial intelligence (AI) and machine learning (ML) functionalities into these platforms. For instance, chatbots employ AI to engage with customers by offering immediate support or personalized suggestions.
Investment in digital experience platforms has witnessed a surge in funding from both established technology companies and startups, encompassing both well-established entities and emerging ventures. These investments aim to foster the growth and improvement of these platforms in order to maintain a leading position in the realm of customer experience innovation.
Digital experience platforms (DXPs) exhibit versatility and have demonstrated their utility in various industries and sectors, encompassing e-commerce, banking, healthcare, and travel, among others. E-commerce enterprises employ digital experience platforms to customize product recommendations for individual shoppers, streamline checkout processes, and provide post-purchase assistance.
Digital experience platforms offer numerous benefits however, their utilization gives rise to ethical considerations. The collection and processing of customer data give rise to concerns pertaining to privacy, data security, and consent. It is imperative for businesses to give utmost importance to responsible practices when employing digital experience platforms in order to safeguard customer privacy and ensure compliance with pertinent regulations.
Driving factors
Increasing Digitalization and Online Customer Interactions
In today's fast-paced world, businesses are digitalizing. Technology has revolutionized our interactions with brands and businesses. With the internet and cell phones, customers are more connected than ever. The digital experience platform market is crucial. The demand for digital experience platforms has surged as businesses seek to deliver seamless online experiences. These platforms let businesses manage and optimize all their digital touchpoints in one place.
Customer Experience's Rise
Customer experience is a key difference for businesses in today's market. Customers now expect a memorable and enjoyable brand experience. For businesses to stay ahead, they must meet these expectations. The digital experience platform market helps businesses focus on customer experience. These platforms offer many tools and capabilities to create personalized and engaging experiences.
Omnichannel Demand
Customers increasingly expect a seamless digital experience across all online and offline touchpoints as a result of the rapid expansion of digitization. Customers demand consistency in their encounters with a company, whether they are using a website, going to a store, or using a mobile app. The digital experience platform market meets this demand for seamless multichannel experiences.
Personalized, Targeted Marketing
Marketing has embraced personalization for good reason. Customers expect personalized experiences that meet their requirements and interests. Generic, one-size-fits-all marketing is ineffective at attracting customers and converting them. Digital experience platforms enable businesses to deliver personalized and targeted marketing efforts. These platforms help businesses segment their audience and customize content and offerings by collecting and analyzing customer data.
Digital Experience Platform Market AI/ML Advancements
Artificial intelligence and machine learning advancements have revolutionized the digital experience platform market. These technologies allow businesses to turn large amounts of customer contact data into useful information. Digital experience platforms with AI and machine learning can automatically evaluate large amounts of data, find trends, and offer recommendations.
Restraining Factors
Integration Issues
Organizations encounter many hurdles when implementing the digital experience platforms market (DXP) in today's fast-expanding digital ecosystem. DXP integration with existing IT infrastructure is one such difficulty. Businesses acquire several systems, databases, and tools that serve multiple functions and don't always work together. Lack of integration might create bottlenecks, limiting a DXP's usefulness. Compatibility concerns can develop when connecting a DXP with existing IT infrastructure, leading to complexity.
Protecting Data
Organizations must prioritize data privacy and security in the face of rising cyber threats and strict data protection rules. If proper precautions are not taken, implementing a DXP requires the integration and management of enormous amounts of customer data. Data breaches or illegal access to sensitive customer data can damage reputation and legal standing. Data privacy and security need thorough reviews of security mechanisms, data encryption, access controls, and regulatory compliance. DXP adopters must work with trustworthy solution providers that prioritize data security and offer strong encryption.
DXP Complexity
Implementing and managing a DXP takes time, technical knowledge, and change management. Organizations struggle with complexity, leading to delays, cost overruns, and poor performance. The complexity of implementing a DXP comes from aligning corporate processes with its capabilities. Experts are needed for customization, configuration, and integration. Managing a DXP also requires ongoing optimization, content generation, personalization, and performance metrics monitoring.
Organizational Resistance
DXPs often modify processes, roles, and responsibilities in an organization. Employees used to existing methods of working may show resistance to such changes. Due to job instability, lack of understanding, or misconceptions about DXP benefits, employees may resist organizational change. Effective change management needs honest communication, stakeholder involvement, and employee training to overcome resistance. Organizations must explain the benefits of a DXP to employees, customers, and the organization.
DXP vs. Individual Tools
Organizations may compete with separate marketing and engagement tools even though the digital experience platform market provides a full solution for customer involvement. These tools, which specialize in email marketing or social media management, may be embedded in an organization's processes. Organizations must highlight DXP benefits to compete effectively with individual marketing and engagement tools. A DXP consolidates skills and provides a comprehensive view of customer interactions.
Component Analysis
Platform segment dominance in the digital experience platform market is increasing. This segment includes software and tools targeted at enhancing and optimizing users' digital experience. These platforms combine content management, CRM, analytics, and personalization. Businesses are becoming more interested in the Platform Segment since it provides a complete solution to enhance their online presence and communicate with customers.
Economic growth in emerging markets is one of the primary factors driving platform segment adoption. These economies' digital infrastructure and internet penetration are experiencing tremendous growth. Digital experience platforms are in demand as businesses and consumers go digital. These platforms allow businesses to provide seamless, tailored experiences to customers, boosting happiness and loyalty.
Businesses must understand consumer patterns and behavior toward the Platform Segment to match their strategy with changing customer expectations. Consumers want a seamless experience across platforms, including websites, mobile apps, and social media. They demand personalized recommendations, relevant material, and easy navigation. The platform segment helps businesses collect and analyze client data for customized experiences.
Deployment Mode Analysis
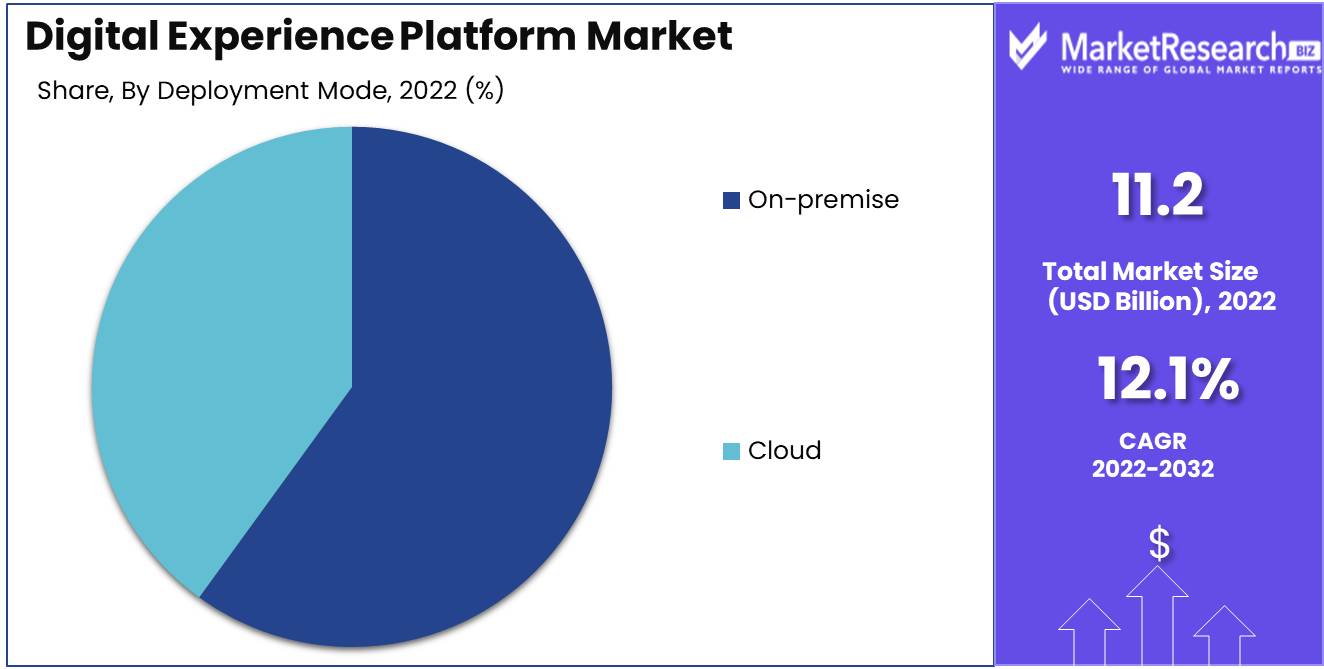
On-premise segment dominance in the digital experience platform market is noteworthy. On-premise deployment installs and runs software and tools in a company's infrastructure. This deployment approach gives businesses full control over their digital experience platforms and permits customized customizations to satisfy unique needs.
Similar to the platform segment, growing economies are driving On-premise Segment adoption. As these economies flourish, businesses need safe, strong digital experience platforms that can be customized. On-premise implementation gives them control and flexibility to manage their digital experiences.
Data security and compliance drive consumer behavior in the On-premise Segment. To comply with rules, many firms, especially in highly regulated areas like finance and healthcare, keep their data on-premise. To control data privacy and security, sensitive client data organizations may choose on-premise deployment.
Industry Vertical Analysis
The retail segment dominates the digital experience platform market in adoption and market share. Businesses that sell to consumers directly fall under this segment. The retail industry has been digitally transformed by the rapid growth of e-commerce and Internet shopping. Retailers are using digital experience platforms to enhance their online presence, engage customers, and boost sales in order to remain competitive.
Economic expansion in emerging economies is driving Retail Segment adoption. These economies experience a spike in consumer spending and disposable incomes, which boosts the retail business. Retailers use digital experience platforms to personalize and engage customers online, increasing conversion rates and revenue.
Retail consumer behavior is shifting toward online shopping and digital interactions. Consumers now choose to shop and buy things online due to the convenience of mobile devices. They want a hassle-free, customized purchasing experience. The Retail Segment of the digital experience platform market helps retailers deliver these experiences, boosting consumer pleasure and loyalty.
Key Market Segments
By Component
- Platform
- Services
By Deployment Mode
- On-premise
- Cloud
By Industry Vertical
- BFSI
- IT & Telecommunication
- Government Sector
- Healthcare
- Retail
- Energy and Utilities
- Other Industry Verticals
Growth Opportunity
Emerging Markets Expansion
The digital experience platform market has significant development potential in emerging markets. Emerging markets offer DXP providers untapped opportunities due to global digitization. These markets have a large customer base hungry for improved digital experiences, making them ideal for expansion. DXP providers can develop a strong presence and capture significant market share by adapting their solutions to these markets' specific demands and preferences.
Industrial DXP Solutions
The development of industry-specific DXP solutions is another potential opportunity for manufacturers in the digital experience platform market. Delivering great digital experiences is different for each industry. Providers can establish themselves as market leaders by creating specialized DXPs that are designed to satisfy the needs of specific industries including healthcare, e-commerce, finance, and more. Industry-specific solutions can provide customized features, integrations, and analytics, enabling enterprises to deliver personalized digital experiences that boost customer satisfaction and loyalty.
Partnerships for Capabilities
Strategic alliances and acquisitions offer digital experience platform providers a huge growth opportunity. DXP suppliers can improve their capabilities, speed product development, and acquire a competitive edge by collaborating with complementary technology providers or purchasing creative companies. DXPs can create cutting-edge solutions that focus on personalization, automation, and customer interaction by partnering with AI, machine learning, and data analytics professionals.
Cloud-based and headless DXPs
The adoption of headless and cloud-based DXPs offers market transformation. Headless DXPs enable tailored experiences across various channels and devices by decoupling the front-end presentation layer from the content management system. This architecture delivers flexibility, scalability, and agility, making it increasingly popular among organizations seeking adaptive digital experience solutions. Cloud-based DXPs allow businesses to remotely access and control their digital experiences, improving productivity, scalability, and cost.
Analyze and Insight Customer Data
DXP providers can develop by leveraging customer data analytics and insights. Organizations can acquire insights into customer habits, preferences, and patterns by using advanced analytics solutions. They can give hyper-personalized digital experiences, targeted marketing strategies, and optimized customer journeys. DXP solutions with strong data analytics capabilities help companies make data-driven decisions and improve customer satisfaction.
Latest Trends
Headless DXPs
The rise of headless and decoupled architecture DXPs is a major trend in the digital experience platform market. Traditional DXP systems are monolithic platforms that strongly couple the CMS and user interface. Decoupled and headless architectures are more versatile. Businesses can develop unified digital experiences across many channels, including websites, mobile apps, IoT devices, and more, by decoupling the front-end and back-end. This allows faster development, easier maintenance, and channel-specific personalized experiences.
AI-Chatbot Integration
AI and chatbot integration is another major trend in the digital experience platform market. Chatbots have improved customer happiness and engagement by giving immediate and personalized responses. Chatbots can now grasp user intent and respond intelligently, emulating human conversations, thanks to NLP and machine learning algorithms. Chatbots in DXPs improve customer service and give businesses personalized experiences.
Omnichannel Personalization and Real-Time Customer Engagement
Businesses that want to succeed in today's digital world must offer personalized experiences across many platforms. Customers want a consistent and smooth brand experience across all channels. Thus, enhanced omnichannel personalized DXPs are gaining popularity. Businesses may increase customer engagement and loyalty by utilizing customer data and behavioral insights to deliver relevant content and experiences in real-time.
API-first DXP growth
API-first DXPs are popular because they interface with other systems and apps. APIs let businesses connect tools and services for data exchange and interoperability. API-first DXPs allow developers to design customized solutions using pre-existing APIs, decreasing development time and cost. This trend encourages modularity, letting businesses use best-of-breed technologies while keeping a consistent digital experience.
Low-Code/No-Code Development Skills
Low-code/no-code development platforms have emerged due to rapid application development. These platforms let citizen developers without coding experience create and customize digital experiences without IT teams.DXPs' low-code/no-code development capabilities let businesses provide digital experiences faster and iteratively improve them based on user input. This trend democratizes development and encourages market responsiveness.
Regional Analysis
North America region dominates the digital experience platform market. Businesses strive to give customers a smooth digital experience in the fast-changing world of technology. The digital experience platform (DXP) market offers many solutions to boost consumer engagement and corporate growth in this digital revolution.
North America dominates the digital experience platform market due to its robust technological environment and commitment to satisfying businesses' and consumers' changing needs. The region's infrastructure and startup culture support digital innovation. Many technology companies and solution providers have emerged to meet the desire for simplified digital experiences.
One of the key reasons North America dominates the DXP market is its strong R&D concentration. North American companies invest extensively in R&D to keep ahead of digital advances and produce cutting-edge solutions for businesses across industries. Their commitment to innovation offers them an edge and makes North America a technological leader.
The North American digital experience platform market is mature and competitive, with many established firms and rising startups competing. Healthy competition spurs innovation and gives businesses a wide range of digital experience solutions. North American businesses can improve their digital presence through content management systems, personalization tools, analytics, and customer path mapping.
North America dominates the digital experience platform market worldwide. North American solution providers' technological skills and advanced digital solutions attract corporations from Europe, Asia, and other countries. Global trust in North American providers strengthens the region's market position.

Key Regions and Countries
North America
- US
- Canada
- Mexico
Western Europe
- Germany
- France
- The UK
- Spain
- Italy
- Portugal
- Ireland
- Austria
- Switzerland
- Benelux
- Nordic
- Rest of Western Europe
Eastern Europe
- Russia
- Poland
- The Czech Republic
- Greece
- Rest of Eastern Europe
APAC
- China
- Japan
- South Korea
- India
- Australia & New Zealand
- Indonesia
- Malaysia
- Philippines
- Singapore
- Thailand
- Vietnam
- Rest of APAC
Latin America
- Brazil
- Colombia
- Chile
- Argentina
- Costa Rica
- Rest of Latin America
Middle East & Africa
- Algeria
- Egypt
- Israel
- Kuwait
- Nigeria
- Saudi Arabia
- South Africa
- Turkey
- United Arab Emirates
- Rest of MEA
Key Players Analysis
Adobe, an American multinational computer software business, leads the digital experience platform market with a complete suite of products. Adobe Experience Cloud blends Adobe Experience Manager (AEM), Adobe Analytics, and Adobe Target to help businesses develop tailored, data-driven, and scalable digital experiences. Enterprises across industries enjoy the platform's powerful content management system and extensive audience segmentation and targeting.
Oracle, a leader in enterprise software, has focused on its Oracle CX Cloud Suite to meet businesses' digital experience platform needs. Oracle seeks intelligent customer engagement across all touchpoints using AI and ML. The suite's comprehensive customer data platform, marketing automation tools, and personalized recommendations engine help businesses deliver smooth, relevant, and contextual digital experiences.
SAP SE's SAP Customer Experience suite has helped the digital experience platform market. SAP provides a complete customer success solution by integrating CRM, e-commerce, marketing automation, and customer support. The suite helps businesses deliver consistent experiences, gather deep customer insights, and optimize their digital strategy using powerful analytics.
IBM's Digital Experience platform lets businesses create smart, cognitive digital experiences. This platform delivers immersive, personalized digital experiences with content management, AI-powered personalization, and integration. IBM helps organizations utilize AI and ML to automate content production, evaluate user activity, and deliver hyper-personalized experiences with Watson Content Hub.
Microsoft's products and services improve digital experiences. Their Microsoft Dynamics 365 CRM/ERP platform streamlines customer journeys. Microsoft Dynamics 365 helps businesses develop lasting customer relationships, optimize operational efficiency, and deliver seamless omnichannel experiences with integrated marketing, sales, customer service, and commerce capabilities.
Top Key Players in the Digital Experience Platform Market
- Adobe (U.S.)
- Oracle (U.S.)
- SAP SE (Germany)
- IBM (U.S.)
- Microsoft (U.S.)
- Salesforce Inc., (U.S.)
- Open Text Corporation. (Canada)
- SWEETYET DEVELOPMENT LIMITED (U.K.)
- Sitecore (U.S.)
- Acquia Inc., (U.S.)
- Jahia Solutions Group SA (Switzerland)
- Optimizely, Inc (U.S.)
- Squiz (Australia)
- Bloomreach, Inc. (U.S.)
- Firelay Liferay Services (U.S.)
- Kentico Software (Czech Republic)
- censhare GmbH(Germany)
Recent Development
- In 2023, California-based Adobe released its highly anticipated Experience Cloud suite.
- In 2022, Salesforce, known for its innovative projects, launched its Customer 360 suite solidifying its position as a DXP market leader.
- In 2021, Oracle launched the Oracle Digital Experience Platform, a major milestone in the DXP market.
- In 2020, SAP, a software company based in Germany, launched its SAP Customer Experience Suite establishing itself as a DXP leader.
- In 2019, The highly anticipated Sitecore Experience Platform was released, boosting the DXP market.
Report Scope:
Report Features Description Market Value (2022) USD 11.2 Bn Forecast Revenue (2032) USD 34.1 Bn CAGR (2023-2032) 12.1% Base Year for Estimation 2022 Historic Period 2016-2022 Forecast Period 2023-2032 Report Coverage Revenue Forecast, Market Dynamics, COVID-19 Impact, Competitive Landscape, Recent Developments Segments Covered By Component (Platform, Services), By Deployment Mode (On-premise, Cloud), By Industry Vertical (BFSI, IT & Telecommunication, Government Sector, Healthcare, Retail, Energy and Utilities, Other Industry Verticals) Regional Analysis North America – The US, Canada, & Mexico; Western Europe – Germany, France, The UK, Spain, Italy, Portugal, Ireland, Austria, Switzerland, Benelux, Nordic, & Rest of Western Europe; Eastern Europe – Russia, Poland, The Czech Republic, Greece, & Rest of Eastern Europe; APAC – China, Japan, South Korea, India, Australia & New Zealand, Indonesia, Malaysia, Philippines, Singapore, Thailand, Vietnam, & Rest of APAC; Latin America – Brazil, Colombia, Chile, Argentina, Costa Rica, & Rest of Latin America; Middle East & Africa – Algeria, Egypt, Israel, Kuwait, Nigeria, Saudi Arabia, South Africa, Turkey, United Arab Emirates, & Rest of MEA Competitive Landscape Adobe (U.S.), Oracle (U.S.), SAP SE (Germany), IBM (U.S.), Microsoft (U.S.), Salesforce Inc., (U.S.), Open Text Corporation. (Canada), SWEETYET DEVELOPMENT LIMITED (U.K.), Sitecore (U.S.), Acquia Inc., (U.S.), Jahia Solutions Group SA (Switzerland), Optimizely, Inc (U.S.), Squiz (Australia), Bloomreach, Inc. (U.S.), Firelay Liferay Services (U.S.), Kentico Software (Czech Republic), censhare GmbH(Germany) Customization Scope Customization for segments, region/country-level will be provided. Moreover, additional customization can be done based on the requirements. Purchase Options We have three licenses to opt for: Single User License, Multi-User License (Up to 5 Users), Corporate Use License (Unlimited User and Printable PDF) -
- 1. Executive Summary
- 1.1. Definition
- 1.2. Taxonomy
- 1.3. Research Scope
- 1.4. Key Analysis
- 1.5. Key Findings by Major Segments
- 1.6. Top strategies by Major Players
- 2. Global Digital Experience Platform Market Overview
- 2.1. Digital Experience Platform Market Dynamics
- 2.1.1. Drivers
- 2.1.2. Opportunities
- 2.1.3. Restraints
- 2.1.4. Challenges
- 2.2. Macro-economic Factors
- 2.3. Regulatory Framework
- 2.4. Market Investment Feasibility Index
- 2.5. PEST Analysis
- 2.6. PORTER’S Five Force Analysis
- 2.7. Drivers & Restraints Impact Analysis
- 2.8. Industry Chain Analysis
- 2.9. Cost Structure Analysis
- 2.10. Marketing Strategy
- 2.11. Russia-Ukraine War Impact Analysis
- 2.12. Opportunity Map Analysis
- 2.13. Market Competition Scenario Analysis
- 2.14. Product Life Cycle Analysis
- 2.15. Opportunity Orbits
- 2.16. Manufacturer Intensity Map
- 2.17. Major Companies sales by Value & Volume
- 2.1. Digital Experience Platform Market Dynamics
- 3. Global Digital Experience Platform Market Analysis, Opportunity and Forecast, 2016-2032
- 3.1. Global Digital Experience Platform Market Analysis, 2016-2021
- 3.2. Global Digital Experience Platform Market Opportunity and Forecast, 2023-2032
- 3.3. Global Digital Experience Platform Market Analysis, Opportunity and Forecast, By By Component, 2016-2032
- 3.3.1. Global Digital Experience Platform Market Analysis by By Component: Introduction
- 3.3.2. Market Size Absolute $ Opportunity Analysis and Forecast, By By Component, 2016-2032
- 3.3.3. Platform
- 3.3.4. Services
- 3.4. Global Digital Experience Platform Market Analysis, Opportunity and Forecast, By By Deployment Mode, 2016-2032
- 3.4.1. Global Digital Experience Platform Market Analysis by By Deployment Mode: Introduction
- 3.4.2. Market Size Absolute $ Opportunity Analysis and Forecast, By By Deployment Mode, 2016-2032
- 3.4.3. On-premise
- 3.4.4. Cloud
- 3.5. Global Digital Experience Platform Market Analysis, Opportunity and Forecast, By By Industry Vertical, 2016-2032
- 3.5.1. Global Digital Experience Platform Market Analysis by By Industry Vertical: Introduction
- 3.5.2. Market Size Absolute $ Opportunity Analysis and Forecast, By By Industry Vertical, 2016-2032
- 3.5.3. BFSI
- 3.5.4. IT & Telecommunication
- 3.5.5. Government Sector
- 3.5.6. Healthcare
- 3.5.7. Retail
- 3.5.8. Energy and Utilities
- 3.5.9. Other Industry Verticals
- 4. North America Digital Experience Platform Market Analysis, Opportunity and Forecast, 2016-2032
- 4.1. North America Digital Experience Platform Market Analysis, 2016-2021
- 4.2. North America Digital Experience Platform Market Opportunity and Forecast, 2023-2032
- 4.3. North America Digital Experience Platform Market Analysis, Opportunity and Forecast, By By Component, 2016-2032
- 4.3.1. North America Digital Experience Platform Market Analysis by By Component: Introduction
- 4.3.2. Market Size Absolute $ Opportunity Analysis and Forecast, By By Component, 2016-2032
- 4.3.3. Platform
- 4.3.4. Services
- 4.4. North America Digital Experience Platform Market Analysis, Opportunity and Forecast, By By Deployment Mode, 2016-2032
- 4.4.1. North America Digital Experience Platform Market Analysis by By Deployment Mode: Introduction
- 4.4.2. Market Size Absolute $ Opportunity Analysis and Forecast, By By Deployment Mode, 2016-2032
- 4.4.3. On-premise
- 4.4.4. Cloud
- 4.5. North America Digital Experience Platform Market Analysis, Opportunity and Forecast, By By Industry Vertical, 2016-2032
- 4.5.1. North America Digital Experience Platform Market Analysis by By Industry Vertical: Introduction
- 4.5.2. Market Size Absolute $ Opportunity Analysis and Forecast, By By Industry Vertical, 2016-2032
- 4.5.3. BFSI
- 4.5.4. IT & Telecommunication
- 4.5.5. Government Sector
- 4.5.6. Healthcare
- 4.5.7. Retail
- 4.5.8. Energy and Utilities
- 4.5.9. Other Industry Verticals
- 4.6. North America Digital Experience Platform Market Analysis, Opportunity and Forecast, By Country , 2016-2032
- 4.6.1. North America Digital Experience Platform Market Analysis by Country : Introduction
- 4.6.2. Market Size Absolute $ Opportunity Analysis and Forecast, Country , 2016-2032
- 4.6.2.1. The US
- 4.6.2.2. Canada
- 4.6.2.3. Mexico
- 5. Western Europe Digital Experience Platform Market Analysis, Opportunity and Forecast, 2016-2032
- 5.1. Western Europe Digital Experience Platform Market Analysis, 2016-2021
- 5.2. Western Europe Digital Experience Platform Market Opportunity and Forecast, 2023-2032
- 5.3. Western Europe Digital Experience Platform Market Analysis, Opportunity and Forecast, By By Component, 2016-2032
- 5.3.1. Western Europe Digital Experience Platform Market Analysis by By Component: Introduction
- 5.3.2. Market Size Absolute $ Opportunity Analysis and Forecast, By By Component, 2016-2032
- 5.3.3. Platform
- 5.3.4. Services
- 5.4. Western Europe Digital Experience Platform Market Analysis, Opportunity and Forecast, By By Deployment Mode, 2016-2032
- 5.4.1. Western Europe Digital Experience Platform Market Analysis by By Deployment Mode: Introduction
- 5.4.2. Market Size Absolute $ Opportunity Analysis and Forecast, By By Deployment Mode, 2016-2032
- 5.4.3. On-premise
- 5.4.4. Cloud
- 5.5. Western Europe Digital Experience Platform Market Analysis, Opportunity and Forecast, By By Industry Vertical, 2016-2032
- 5.5.1. Western Europe Digital Experience Platform Market Analysis by By Industry Vertical: Introduction
- 5.5.2. Market Size Absolute $ Opportunity Analysis and Forecast, By By Industry Vertical, 2016-2032
- 5.5.3. BFSI
- 5.5.4. IT & Telecommunication
- 5.5.5. Government Sector
- 5.5.6. Healthcare
- 5.5.7. Retail
- 5.5.8. Energy and Utilities
- 5.5.9. Other Industry Verticals
- 5.6. Western Europe Digital Experience Platform Market Analysis, Opportunity and Forecast, By Country , 2016-2032
- 5.6.1. Western Europe Digital Experience Platform Market Analysis by Country : Introduction
- 5.6.2. Market Size Absolute $ Opportunity Analysis and Forecast, Country , 2016-2032
- 5.6.2.1. Germany
- 5.6.2.2. France
- 5.6.2.3. The UK
- 5.6.2.4. Spain
- 5.6.2.5. Italy
- 5.6.2.6. Portugal
- 5.6.2.7. Ireland
- 5.6.2.8. Austria
- 5.6.2.9. Switzerland
- 5.6.2.10. Benelux
- 5.6.2.11. Nordic
- 5.6.2.12. Rest of Western Europe
- 6. Eastern Europe Digital Experience Platform Market Analysis, Opportunity and Forecast, 2016-2032
- 6.1. Eastern Europe Digital Experience Platform Market Analysis, 2016-2021
- 6.2. Eastern Europe Digital Experience Platform Market Opportunity and Forecast, 2023-2032
- 6.3. Eastern Europe Digital Experience Platform Market Analysis, Opportunity and Forecast, By By Component, 2016-2032
- 6.3.1. Eastern Europe Digital Experience Platform Market Analysis by By Component: Introduction
- 6.3.2. Market Size Absolute $ Opportunity Analysis and Forecast, By By Component, 2016-2032
- 6.3.3. Platform
- 6.3.4. Services
- 6.4. Eastern Europe Digital Experience Platform Market Analysis, Opportunity and Forecast, By By Deployment Mode, 2016-2032
- 6.4.1. Eastern Europe Digital Experience Platform Market Analysis by By Deployment Mode: Introduction
- 6.4.2. Market Size Absolute $ Opportunity Analysis and Forecast, By By Deployment Mode, 2016-2032
- 6.4.3. On-premise
- 6.4.4. Cloud
- 6.5. Eastern Europe Digital Experience Platform Market Analysis, Opportunity and Forecast, By By Industry Vertical, 2016-2032
- 6.5.1. Eastern Europe Digital Experience Platform Market Analysis by By Industry Vertical: Introduction
- 6.5.2. Market Size Absolute $ Opportunity Analysis and Forecast, By By Industry Vertical, 2016-2032
- 6.5.3. BFSI
- 6.5.4. IT & Telecommunication
- 6.5.5. Government Sector
- 6.5.6. Healthcare
- 6.5.7. Retail
- 6.5.8. Energy and Utilities
- 6.5.9. Other Industry Verticals
- 6.6. Eastern Europe Digital Experience Platform Market Analysis, Opportunity and Forecast, By Country , 2016-2032
- 6.6.1. Eastern Europe Digital Experience Platform Market Analysis by Country : Introduction
- 6.6.2. Market Size Absolute $ Opportunity Analysis and Forecast, Country , 2016-2032
- 6.6.2.1. Russia
- 6.6.2.2. Poland
- 6.6.2.3. The Czech Republic
- 6.6.2.4. Greece
- 6.6.2.5. Rest of Eastern Europe
- 7. APAC Digital Experience Platform Market Analysis, Opportunity and Forecast, 2016-2032
- 7.1. APAC Digital Experience Platform Market Analysis, 2016-2021
- 7.2. APAC Digital Experience Platform Market Opportunity and Forecast, 2023-2032
- 7.3. APAC Digital Experience Platform Market Analysis, Opportunity and Forecast, By By Component, 2016-2032
- 7.3.1. APAC Digital Experience Platform Market Analysis by By Component: Introduction
- 7.3.2. Market Size Absolute $ Opportunity Analysis and Forecast, By By Component, 2016-2032
- 7.3.3. Platform
- 7.3.4. Services
- 7.4. APAC Digital Experience Platform Market Analysis, Opportunity and Forecast, By By Deployment Mode, 2016-2032
- 7.4.1. APAC Digital Experience Platform Market Analysis by By Deployment Mode: Introduction
- 7.4.2. Market Size Absolute $ Opportunity Analysis and Forecast, By By Deployment Mode, 2016-2032
- 7.4.3. On-premise
- 7.4.4. Cloud
- 7.5. APAC Digital Experience Platform Market Analysis, Opportunity and Forecast, By By Industry Vertical, 2016-2032
- 7.5.1. APAC Digital Experience Platform Market Analysis by By Industry Vertical: Introduction
- 7.5.2. Market Size Absolute $ Opportunity Analysis and Forecast, By By Industry Vertical, 2016-2032
- 7.5.3. BFSI
- 7.5.4. IT & Telecommunication
- 7.5.5. Government Sector
- 7.5.6. Healthcare
- 7.5.7. Retail
- 7.5.8. Energy and Utilities
- 7.5.9. Other Industry Verticals
- 7.6. APAC Digital Experience Platform Market Analysis, Opportunity and Forecast, By Country , 2016-2032
- 7.6.1. APAC Digital Experience Platform Market Analysis by Country : Introduction
- 7.6.2. Market Size Absolute $ Opportunity Analysis and Forecast, Country , 2016-2032
- 7.6.2.1. China
- 7.6.2.2. Japan
- 7.6.2.3. South Korea
- 7.6.2.4. India
- 7.6.2.5. Australia & New Zeland
- 7.6.2.6. Indonesia
- 7.6.2.7. Malaysia
- 7.6.2.8. Philippines
- 7.6.2.9. Singapore
- 7.6.2.10. Thailand
- 7.6.2.11. Vietnam
- 7.6.2.12. Rest of APAC
- 8. Latin America Digital Experience Platform Market Analysis, Opportunity and Forecast, 2016-2032
- 8.1. Latin America Digital Experience Platform Market Analysis, 2016-2021
- 8.2. Latin America Digital Experience Platform Market Opportunity and Forecast, 2023-2032
- 8.3. Latin America Digital Experience Platform Market Analysis, Opportunity and Forecast, By By Component, 2016-2032
- 8.3.1. Latin America Digital Experience Platform Market Analysis by By Component: Introduction
- 8.3.2. Market Size Absolute $ Opportunity Analysis and Forecast, By By Component, 2016-2032
- 8.3.3. Platform
- 8.3.4. Services
- 8.4. Latin America Digital Experience Platform Market Analysis, Opportunity and Forecast, By By Deployment Mode, 2016-2032
- 8.4.1. Latin America Digital Experience Platform Market Analysis by By Deployment Mode: Introduction
- 8.4.2. Market Size Absolute $ Opportunity Analysis and Forecast, By By Deployment Mode, 2016-2032
- 8.4.3. On-premise
- 8.4.4. Cloud
- 8.5. Latin America Digital Experience Platform Market Analysis, Opportunity and Forecast, By By Industry Vertical, 2016-2032
- 8.5.1. Latin America Digital Experience Platform Market Analysis by By Industry Vertical: Introduction
- 8.5.2. Market Size Absolute $ Opportunity Analysis and Forecast, By By Industry Vertical, 2016-2032
- 8.5.3. BFSI
- 8.5.4. IT & Telecommunication
- 8.5.5. Government Sector
- 8.5.6. Healthcare
- 8.5.7. Retail
- 8.5.8. Energy and Utilities
- 8.5.9. Other Industry Verticals
- 8.6. Latin America Digital Experience Platform Market Analysis, Opportunity and Forecast, By Country , 2016-2032
- 8.6.1. Latin America Digital Experience Platform Market Analysis by Country : Introduction
- 8.6.2. Market Size Absolute $ Opportunity Analysis and Forecast, Country , 2016-2032
- 8.6.2.1. Brazil
- 8.6.2.2. Colombia
- 8.6.2.3. Chile
- 8.6.2.4. Argentina
- 8.6.2.5. Costa Rica
- 8.6.2.6. Rest of Latin America
- 9. Middle East & Africa Digital Experience Platform Market Analysis, Opportunity and Forecast, 2016-2032
- 9.1. Middle East & Africa Digital Experience Platform Market Analysis, 2016-2021
- 9.2. Middle East & Africa Digital Experience Platform Market Opportunity and Forecast, 2023-2032
- 9.3. Middle East & Africa Digital Experience Platform Market Analysis, Opportunity and Forecast, By By Component, 2016-2032
- 9.3.1. Middle East & Africa Digital Experience Platform Market Analysis by By Component: Introduction
- 9.3.2. Market Size Absolute $ Opportunity Analysis and Forecast, By By Component, 2016-2032
- 9.3.3. Platform
- 9.3.4. Services
- 9.4. Middle East & Africa Digital Experience Platform Market Analysis, Opportunity and Forecast, By By Deployment Mode, 2016-2032
- 9.4.1. Middle East & Africa Digital Experience Platform Market Analysis by By Deployment Mode: Introduction
- 9.4.2. Market Size Absolute $ Opportunity Analysis and Forecast, By By Deployment Mode, 2016-2032
- 9.4.3. On-premise
- 9.4.4. Cloud
- 9.5. Middle East & Africa Digital Experience Platform Market Analysis, Opportunity and Forecast, By By Industry Vertical, 2016-2032
- 9.5.1. Middle East & Africa Digital Experience Platform Market Analysis by By Industry Vertical: Introduction
- 9.5.2. Market Size Absolute $ Opportunity Analysis and Forecast, By By Industry Vertical, 2016-2032
- 9.5.3. BFSI
- 9.5.4. IT & Telecommunication
- 9.5.5. Government Sector
- 9.5.6. Healthcare
- 9.5.7. Retail
- 9.5.8. Energy and Utilities
- 9.5.9. Other Industry Verticals
- 9.6. Middle East & Africa Digital Experience Platform Market Analysis, Opportunity and Forecast, By Country , 2016-2032
- 9.6.1. Middle East & Africa Digital Experience Platform Market Analysis by Country : Introduction
- 9.6.2. Market Size Absolute $ Opportunity Analysis and Forecast, Country , 2016-2032
- 9.6.2.1. Algeria
- 9.6.2.2. Egypt
- 9.6.2.3. Israel
- 9.6.2.4. Kuwait
- 9.6.2.5. Nigeria
- 9.6.2.6. Saudi Arabia
- 9.6.2.7. South Africa
- 9.6.2.8. Turkey
- 9.6.2.9. The UAE
- 9.6.2.10. Rest of MEA
- 10. Global Digital Experience Platform Market Analysis, Opportunity and Forecast, By Region , 2016-2032
- 10.1. Global Digital Experience Platform Market Analysis by Region : Introduction
- 10.2. Market Size Absolute $ Opportunity Analysis and Forecast, By Region , 2016-2032
- 10.2.1. North America
- 10.2.2. Western Europe
- 10.2.3. Eastern Europe
- 10.2.4. APAC
- 10.2.5. Latin America
- 10.2.6. Middle East & Africa
- 11. Global Digital Experience Platform Market Competitive Landscape, Market Share Analysis, and Company Profiles
- 11.1. Market Share Analysis
- 11.2. Company Profiles
- 11.3. Adobe (U.S.)
- 11.3.1. Company Overview
- 11.3.2. Financial Highlights
- 11.3.3. Product Portfolio
- 11.3.4. SWOT Analysis
- 11.3.5. Key Strategies and Developments
- 11.4. Oracle (U.S.)
- 11.4.1. Company Overview
- 11.4.2. Financial Highlights
- 11.4.3. Product Portfolio
- 11.4.4. SWOT Analysis
- 11.4.5. Key Strategies and Developments
- 11.5. SAP SE (Germany)
- 11.5.1. Company Overview
- 11.5.2. Financial Highlights
- 11.5.3. Product Portfolio
- 11.5.4. SWOT Analysis
- 11.5.5. Key Strategies and Developments
- 11.6. IBM (U.S.)
- 11.6.1. Company Overview
- 11.6.2. Financial Highlights
- 11.6.3. Product Portfolio
- 11.6.4. SWOT Analysis
- 11.6.5. Key Strategies and Developments
- 11.7. Microsoft (U.S.)
- 11.7.1. Company Overview
- 11.7.2. Financial Highlights
- 11.7.3. Product Portfolio
- 11.7.4. SWOT Analysis
- 11.7.5. Key Strategies and Developments
- 11.8. Salesforce Inc., (U.S.)
- 11.8.1. Company Overview
- 11.8.2. Financial Highlights
- 11.8.3. Product Portfolio
- 11.8.4. SWOT Analysis
- 11.8.5. Key Strategies and Developments
- 11.9. Open Text Corporation. (Canada)
- 11.9.1. Company Overview
- 11.9.2. Financial Highlights
- 11.9.3. Product Portfolio
- 11.9.4. SWOT Analysis
- 11.9.5. Key Strategies and Developments
- 11.10. SWEETYET DEVELOPMENT LIMITED (U.K.)
- 11.10.1. Company Overview
- 11.10.2. Financial Highlights
- 11.10.3. Product Portfolio
- 11.10.4. SWOT Analysis
- 11.10.5. Key Strategies and Developments
- 11.11. Sitecore (U.S.)
- 11.11.1. Company Overview
- 11.11.2. Financial Highlights
- 11.11.3. Product Portfolio
- 11.11.4. SWOT Analysis
- 11.11.5. Key Strategies and Developments
- 11.12. Acquia Inc., (U.S.)
- 11.12.1. Company Overview
- 11.12.2. Financial Highlights
- 11.12.3. Product Portfolio
- 11.12.4. SWOT Analysis
- 11.12.5. Key Strategies and Developments
- 11.13. Jahia Solutions Group SA (Switzerland)
- 11.13.1. Company Overview
- 11.13.2. Financial Highlights
- 11.13.3. Product Portfolio
- 11.13.4. SWOT Analysis
- 11.13.5. Key Strategies and Developments
- 11.14. Optimizely, Inc (U.S.)
- 11.14.1. Company Overview
- 11.14.2. Financial Highlights
- 11.14.3. Product Portfolio
- 11.14.4. SWOT Analysis
- 11.14.5. Key Strategies and Developments
- 11.15. Squiz (Australia)
- 11.15.1. Company Overview
- 11.15.2. Financial Highlights
- 11.15.3. Product Portfolio
- 11.15.4. SWOT Analysis
- 11.15.5. Key Strategies and Developments
- 11.16. Bloomreach, Inc. (U.S.)
- 11.16.1. Company Overview
- 11.16.2. Financial Highlights
- 11.16.3. Product Portfolio
- 11.16.4. SWOT Analysis
- 11.16.5. Key Strategies and Developments
- 11.17. Firelay Liferay Services (U.S.)
- 11.17.1. Company Overview
- 11.17.2. Financial Highlights
- 11.17.3. Product Portfolio
- 11.17.4. SWOT Analysis
- 11.17.5. Key Strategies and Developments
- 11.18. Kentico Software (Czech Republic)
- 11.18.1. Company Overview
- 11.18.2. Financial Highlights
- 11.18.3. Product Portfolio
- 11.18.4. SWOT Analysis
- 11.18.5. Key Strategies and Developments
- 11.19. censhare GmbH(Germany)
- 11.19.1. Company Overview
- 11.19.2. Financial Highlights
- 11.19.3. Product Portfolio
- 11.19.4. SWOT Analysis
- 11.19.5. Key Strategies and Developments
- 12. Assumptions and Acronyms
- 13. Research Methodology
- 14. Contact
- List of Figures
- Figure 1: Global Digital Experience Platform Market Revenue (US$ Mn) Market Share by By Component in 2022
- Figure 2: Global Digital Experience Platform Market Attractiveness Analysis by By Component, 2016-2032
- Figure 3: Global Digital Experience Platform Market Revenue (US$ Mn) Market Share by By Deployment Modein 2022
- Figure 4: Global Digital Experience Platform Market Attractiveness Analysis by By Deployment Mode, 2016-2032
- Figure 5: Global Digital Experience Platform Market Revenue (US$ Mn) Market Share by By Industry Verticalin 2022
- Figure 6: Global Digital Experience Platform Market Attractiveness Analysis by By Industry Vertical, 2016-2032
- Figure 7: Global Digital Experience Platform Market Revenue (US$ Mn) Market Share by Region in 2022
- Figure 8: Global Digital Experience Platform Market Attractiveness Analysis by Region, 2016-2032
- Figure 9: Global Digital Experience Platform Market Revenue (US$ Mn) (2016-2032)
- Figure 10: Global Digital Experience Platform Market Revenue (US$ Mn) Comparison by Region (2016-2032)
- Figure 11: Global Digital Experience Platform Market Revenue (US$ Mn) Comparison by By Component (2016-2032)
- Figure 12: Global Digital Experience Platform Market Revenue (US$ Mn) Comparison by By Deployment Mode (2016-2032)
- Figure 13: Global Digital Experience Platform Market Revenue (US$ Mn) Comparison by By Industry Vertical (2016-2032)
- Figure 14: Global Digital Experience Platform Market Y-o-Y Growth Rate Comparison by Region (2016-2032)
- Figure 15: Global Digital Experience Platform Market Y-o-Y Growth Rate Comparison by By Component (2016-2032)
- Figure 16: Global Digital Experience Platform Market Y-o-Y Growth Rate Comparison by By Deployment Mode (2016-2032)
- Figure 17: Global Digital Experience Platform Market Y-o-Y Growth Rate Comparison by By Industry Vertical (2016-2032)
- Figure 18: Global Digital Experience Platform Market Share Comparison by Region (2016-2032)
- Figure 19: Global Digital Experience Platform Market Share Comparison by By Component (2016-2032)
- Figure 20: Global Digital Experience Platform Market Share Comparison by By Deployment Mode (2016-2032)
- Figure 21: Global Digital Experience Platform Market Share Comparison by By Industry Vertical (2016-2032)
- Figure 22: North America Digital Experience Platform Market Revenue (US$ Mn) Market Share by By Componentin 2022
- Figure 23: North America Digital Experience Platform Market Attractiveness Analysis by By Component, 2016-2032
- Figure 24: North America Digital Experience Platform Market Revenue (US$ Mn) Market Share by By Deployment Modein 2022
- Figure 25: North America Digital Experience Platform Market Attractiveness Analysis by By Deployment Mode, 2016-2032
- Figure 26: North America Digital Experience Platform Market Revenue (US$ Mn) Market Share by By Industry Verticalin 2022
- Figure 27: North America Digital Experience Platform Market Attractiveness Analysis by By Industry Vertical, 2016-2032
- Figure 28: North America Digital Experience Platform Market Revenue (US$ Mn) Market Share by Country in 2022
- Figure 29: North America Digital Experience Platform Market Attractiveness Analysis by Country, 2016-2032
- Figure 30: North America Digital Experience Platform Market Revenue (US$ Mn) (2016-2032)
- Figure 31: North America Digital Experience Platform Market Revenue (US$ Mn) Comparison by Country (2016-2032)
- Figure 32: North America Digital Experience Platform Market Revenue (US$ Mn) Comparison by By Component (2016-2032)
- Figure 33: North America Digital Experience Platform Market Revenue (US$ Mn) Comparison by By Deployment Mode (2016-2032)
- Figure 34: North America Digital Experience Platform Market Revenue (US$ Mn) Comparison by By Industry Vertical (2016-2032)
- Figure 35: North America Digital Experience Platform Market Y-o-Y Growth Rate Comparison by Country (2016-2032)
- Figure 36: North America Digital Experience Platform Market Y-o-Y Growth Rate Comparison by By Component (2016-2032)
- Figure 37: North America Digital Experience Platform Market Y-o-Y Growth Rate Comparison by By Deployment Mode (2016-2032)
- Figure 38: North America Digital Experience Platform Market Y-o-Y Growth Rate Comparison by By Industry Vertical (2016-2032)
- Figure 39: North America Digital Experience Platform Market Share Comparison by Country (2016-2032)
- Figure 40: North America Digital Experience Platform Market Share Comparison by By Component (2016-2032)
- Figure 41: North America Digital Experience Platform Market Share Comparison by By Deployment Mode (2016-2032)
- Figure 42: North America Digital Experience Platform Market Share Comparison by By Industry Vertical (2016-2032)
- Figure 43: Western Europe Digital Experience Platform Market Revenue (US$ Mn) Market Share by By Componentin 2022
- Figure 44: Western Europe Digital Experience Platform Market Attractiveness Analysis by By Component, 2016-2032
- Figure 45: Western Europe Digital Experience Platform Market Revenue (US$ Mn) Market Share by By Deployment Modein 2022
- Figure 46: Western Europe Digital Experience Platform Market Attractiveness Analysis by By Deployment Mode, 2016-2032
- Figure 47: Western Europe Digital Experience Platform Market Revenue (US$ Mn) Market Share by By Industry Verticalin 2022
- Figure 48: Western Europe Digital Experience Platform Market Attractiveness Analysis by By Industry Vertical, 2016-2032
- Figure 49: Western Europe Digital Experience Platform Market Revenue (US$ Mn) Market Share by Country in 2022
- Figure 50: Western Europe Digital Experience Platform Market Attractiveness Analysis by Country, 2016-2032
- Figure 51: Western Europe Digital Experience Platform Market Revenue (US$ Mn) (2016-2032)
- Figure 52: Western Europe Digital Experience Platform Market Revenue (US$ Mn) Comparison by Country (2016-2032)
- Figure 53: Western Europe Digital Experience Platform Market Revenue (US$ Mn) Comparison by By Component (2016-2032)
- Figure 54: Western Europe Digital Experience Platform Market Revenue (US$ Mn) Comparison by By Deployment Mode (2016-2032)
- Figure 55: Western Europe Digital Experience Platform Market Revenue (US$ Mn) Comparison by By Industry Vertical (2016-2032)
- Figure 56: Western Europe Digital Experience Platform Market Y-o-Y Growth Rate Comparison by Country (2016-2032)
- Figure 57: Western Europe Digital Experience Platform Market Y-o-Y Growth Rate Comparison by By Component (2016-2032)
- Figure 58: Western Europe Digital Experience Platform Market Y-o-Y Growth Rate Comparison by By Deployment Mode (2016-2032)
- Figure 59: Western Europe Digital Experience Platform Market Y-o-Y Growth Rate Comparison by By Industry Vertical (2016-2032)
- Figure 60: Western Europe Digital Experience Platform Market Share Comparison by Country (2016-2032)
- Figure 61: Western Europe Digital Experience Platform Market Share Comparison by By Component (2016-2032)
- Figure 62: Western Europe Digital Experience Platform Market Share Comparison by By Deployment Mode (2016-2032)
- Figure 63: Western Europe Digital Experience Platform Market Share Comparison by By Industry Vertical (2016-2032)
- Figure 64: Eastern Europe Digital Experience Platform Market Revenue (US$ Mn) Market Share by By Componentin 2022
- Figure 65: Eastern Europe Digital Experience Platform Market Attractiveness Analysis by By Component, 2016-2032
- Figure 66: Eastern Europe Digital Experience Platform Market Revenue (US$ Mn) Market Share by By Deployment Modein 2022
- Figure 67: Eastern Europe Digital Experience Platform Market Attractiveness Analysis by By Deployment Mode, 2016-2032
- Figure 68: Eastern Europe Digital Experience Platform Market Revenue (US$ Mn) Market Share by By Industry Verticalin 2022
- Figure 69: Eastern Europe Digital Experience Platform Market Attractiveness Analysis by By Industry Vertical, 2016-2032
- Figure 70: Eastern Europe Digital Experience Platform Market Revenue (US$ Mn) Market Share by Country in 2022
- Figure 71: Eastern Europe Digital Experience Platform Market Attractiveness Analysis by Country, 2016-2032
- Figure 72: Eastern Europe Digital Experience Platform Market Revenue (US$ Mn) (2016-2032)
- Figure 73: Eastern Europe Digital Experience Platform Market Revenue (US$ Mn) Comparison by Country (2016-2032)
- Figure 74: Eastern Europe Digital Experience Platform Market Revenue (US$ Mn) Comparison by By Component (2016-2032)
- Figure 75: Eastern Europe Digital Experience Platform Market Revenue (US$ Mn) Comparison by By Deployment Mode (2016-2032)
- Figure 76: Eastern Europe Digital Experience Platform Market Revenue (US$ Mn) Comparison by By Industry Vertical (2016-2032)
- Figure 77: Eastern Europe Digital Experience Platform Market Y-o-Y Growth Rate Comparison by Country (2016-2032)
- Figure 78: Eastern Europe Digital Experience Platform Market Y-o-Y Growth Rate Comparison by By Component (2016-2032)
- Figure 79: Eastern Europe Digital Experience Platform Market Y-o-Y Growth Rate Comparison by By Deployment Mode (2016-2032)
- Figure 80: Eastern Europe Digital Experience Platform Market Y-o-Y Growth Rate Comparison by By Industry Vertical (2016-2032)
- Figure 81: Eastern Europe Digital Experience Platform Market Share Comparison by Country (2016-2032)
- Figure 82: Eastern Europe Digital Experience Platform Market Share Comparison by By Component (2016-2032)
- Figure 83: Eastern Europe Digital Experience Platform Market Share Comparison by By Deployment Mode (2016-2032)
- Figure 84: Eastern Europe Digital Experience Platform Market Share Comparison by By Industry Vertical (2016-2032)
- Figure 85: APAC Digital Experience Platform Market Revenue (US$ Mn) Market Share by By Componentin 2022
- Figure 86: APAC Digital Experience Platform Market Attractiveness Analysis by By Component, 2016-2032
- Figure 87: APAC Digital Experience Platform Market Revenue (US$ Mn) Market Share by By Deployment Modein 2022
- Figure 88: APAC Digital Experience Platform Market Attractiveness Analysis by By Deployment Mode, 2016-2032
- Figure 89: APAC Digital Experience Platform Market Revenue (US$ Mn) Market Share by By Industry Verticalin 2022
- Figure 90: APAC Digital Experience Platform Market Attractiveness Analysis by By Industry Vertical, 2016-2032
- Figure 91: APAC Digital Experience Platform Market Revenue (US$ Mn) Market Share by Country in 2022
- Figure 92: APAC Digital Experience Platform Market Attractiveness Analysis by Country, 2016-2032
- Figure 93: APAC Digital Experience Platform Market Revenue (US$ Mn) (2016-2032)
- Figure 94: APAC Digital Experience Platform Market Revenue (US$ Mn) Comparison by Country (2016-2032)
- Figure 95: APAC Digital Experience Platform Market Revenue (US$ Mn) Comparison by By Component (2016-2032)
- Figure 96: APAC Digital Experience Platform Market Revenue (US$ Mn) Comparison by By Deployment Mode (2016-2032)
- Figure 97: APAC Digital Experience Platform Market Revenue (US$ Mn) Comparison by By Industry Vertical (2016-2032)
- Figure 98: APAC Digital Experience Platform Market Y-o-Y Growth Rate Comparison by Country (2016-2032)
- Figure 99: APAC Digital Experience Platform Market Y-o-Y Growth Rate Comparison by By Component (2016-2032)
- Figure 100: APAC Digital Experience Platform Market Y-o-Y Growth Rate Comparison by By Deployment Mode (2016-2032)
- Figure 101: APAC Digital Experience Platform Market Y-o-Y Growth Rate Comparison by By Industry Vertical (2016-2032)
- Figure 102: APAC Digital Experience Platform Market Share Comparison by Country (2016-2032)
- Figure 103: APAC Digital Experience Platform Market Share Comparison by By Component (2016-2032)
- Figure 104: APAC Digital Experience Platform Market Share Comparison by By Deployment Mode (2016-2032)
- Figure 105: APAC Digital Experience Platform Market Share Comparison by By Industry Vertical (2016-2032)
- Figure 106: Latin America Digital Experience Platform Market Revenue (US$ Mn) Market Share by By Componentin 2022
- Figure 107: Latin America Digital Experience Platform Market Attractiveness Analysis by By Component, 2016-2032
- Figure 108: Latin America Digital Experience Platform Market Revenue (US$ Mn) Market Share by By Deployment Modein 2022
- Figure 109: Latin America Digital Experience Platform Market Attractiveness Analysis by By Deployment Mode, 2016-2032
- Figure 110: Latin America Digital Experience Platform Market Revenue (US$ Mn) Market Share by By Industry Verticalin 2022
- Figure 111: Latin America Digital Experience Platform Market Attractiveness Analysis by By Industry Vertical, 2016-2032
- Figure 112: Latin America Digital Experience Platform Market Revenue (US$ Mn) Market Share by Country in 2022
- Figure 113: Latin America Digital Experience Platform Market Attractiveness Analysis by Country, 2016-2032
- Figure 114: Latin America Digital Experience Platform Market Revenue (US$ Mn) (2016-2032)
- Figure 115: Latin America Digital Experience Platform Market Revenue (US$ Mn) Comparison by Country (2016-2032)
- Figure 116: Latin America Digital Experience Platform Market Revenue (US$ Mn) Comparison by By Component (2016-2032)
- Figure 117: Latin America Digital Experience Platform Market Revenue (US$ Mn) Comparison by By Deployment Mode (2016-2032)
- Figure 118: Latin America Digital Experience Platform Market Revenue (US$ Mn) Comparison by By Industry Vertical (2016-2032)
- Figure 119: Latin America Digital Experience Platform Market Y-o-Y Growth Rate Comparison by Country (2016-2032)
- Figure 120: Latin America Digital Experience Platform Market Y-o-Y Growth Rate Comparison by By Component (2016-2032)
- Figure 121: Latin America Digital Experience Platform Market Y-o-Y Growth Rate Comparison by By Deployment Mode (2016-2032)
- Figure 122: Latin America Digital Experience Platform Market Y-o-Y Growth Rate Comparison by By Industry Vertical (2016-2032)
- Figure 123: Latin America Digital Experience Platform Market Share Comparison by Country (2016-2032)
- Figure 124: Latin America Digital Experience Platform Market Share Comparison by By Component (2016-2032)
- Figure 125: Latin America Digital Experience Platform Market Share Comparison by By Deployment Mode (2016-2032)
- Figure 126: Latin America Digital Experience Platform Market Share Comparison by By Industry Vertical (2016-2032)
- Figure 127: Middle East & Africa Digital Experience Platform Market Revenue (US$ Mn) Market Share by By Componentin 2022
- Figure 128: Middle East & Africa Digital Experience Platform Market Attractiveness Analysis by By Component, 2016-2032
- Figure 129: Middle East & Africa Digital Experience Platform Market Revenue (US$ Mn) Market Share by By Deployment Modein 2022
- Figure 130: Middle East & Africa Digital Experience Platform Market Attractiveness Analysis by By Deployment Mode, 2016-2032
- Figure 131: Middle East & Africa Digital Experience Platform Market Revenue (US$ Mn) Market Share by By Industry Verticalin 2022
- Figure 132: Middle East & Africa Digital Experience Platform Market Attractiveness Analysis by By Industry Vertical, 2016-2032
- Figure 133: Middle East & Africa Digital Experience Platform Market Revenue (US$ Mn) Market Share by Country in 2022
- Figure 134: Middle East & Africa Digital Experience Platform Market Attractiveness Analysis by Country, 2016-2032
- Figure 135: Middle East & Africa Digital Experience Platform Market Revenue (US$ Mn) (2016-2032)
- Figure 136: Middle East & Africa Digital Experience Platform Market Revenue (US$ Mn) Comparison by Country (2016-2032)
- Figure 137: Middle East & Africa Digital Experience Platform Market Revenue (US$ Mn) Comparison by By Component (2016-2032)
- Figure 138: Middle East & Africa Digital Experience Platform Market Revenue (US$ Mn) Comparison by By Deployment Mode (2016-2032)
- Figure 139: Middle East & Africa Digital Experience Platform Market Revenue (US$ Mn) Comparison by By Industry Vertical (2016-2032)
- Figure 140: Middle East & Africa Digital Experience Platform Market Y-o-Y Growth Rate Comparison by Country (2016-2032)
- Figure 141: Middle East & Africa Digital Experience Platform Market Y-o-Y Growth Rate Comparison by By Component (2016-2032)
- Figure 142: Middle East & Africa Digital Experience Platform Market Y-o-Y Growth Rate Comparison by By Deployment Mode (2016-2032)
- Figure 143: Middle East & Africa Digital Experience Platform Market Y-o-Y Growth Rate Comparison by By Industry Vertical (2016-2032)
- Figure 144: Middle East & Africa Digital Experience Platform Market Share Comparison by Country (2016-2032)
- Figure 145: Middle East & Africa Digital Experience Platform Market Share Comparison by By Component (2016-2032)
- Figure 146: Middle East & Africa Digital Experience Platform Market Share Comparison by By Deployment Mode (2016-2032)
- Figure 147: Middle East & Africa Digital Experience Platform Market Share Comparison by By Industry Vertical (2016-2032)
List of Tables
- Table 1: Global Digital Experience Platform Market Comparison by By Component (2016-2032)
- Table 2: Global Digital Experience Platform Market Comparison by By Deployment Mode (2016-2032)
- Table 3: Global Digital Experience Platform Market Comparison by By Industry Vertical (2016-2032)
- Table 4: Global Digital Experience Platform Market Revenue (US$ Mn) Comparison by Region (2016-2032)
- Table 5: Global Digital Experience Platform Market Revenue (US$ Mn) (2016-2032)
- Table 6: Global Digital Experience Platform Market Revenue (US$ Mn) Comparison by Region (2016-2032)
- Table 7: Global Digital Experience Platform Market Revenue (US$ Mn) Comparison by By Component (2016-2032)
- Table 8: Global Digital Experience Platform Market Revenue (US$ Mn) Comparison by By Deployment Mode (2016-2032)
- Table 9: Global Digital Experience Platform Market Revenue (US$ Mn) Comparison by By Industry Vertical (2016-2032)
- Table 10: Global Digital Experience Platform Market Y-o-Y Growth Rate Comparison by Region (2016-2032)
- Table 11: Global Digital Experience Platform Market Y-o-Y Growth Rate Comparison by By Component (2016-2032)
- Table 12: Global Digital Experience Platform Market Y-o-Y Growth Rate Comparison by By Deployment Mode (2016-2032)
- Table 13: Global Digital Experience Platform Market Y-o-Y Growth Rate Comparison by By Industry Vertical (2016-2032)
- Table 14: Global Digital Experience Platform Market Share Comparison by Region (2016-2032)
- Table 15: Global Digital Experience Platform Market Share Comparison by By Component (2016-2032)
- Table 16: Global Digital Experience Platform Market Share Comparison by By Deployment Mode (2016-2032)
- Table 17: Global Digital Experience Platform Market Share Comparison by By Industry Vertical (2016-2032)
- Table 18: North America Digital Experience Platform Market Comparison by By Deployment Mode (2016-2032)
- Table 19: North America Digital Experience Platform Market Comparison by By Industry Vertical (2016-2032)
- Table 20: North America Digital Experience Platform Market Revenue (US$ Mn) Comparison by Country (2016-2032)
- Table 21: North America Digital Experience Platform Market Revenue (US$ Mn) (2016-2032)
- Table 22: North America Digital Experience Platform Market Revenue (US$ Mn) Comparison by Country (2016-2032)
- Table 23: North America Digital Experience Platform Market Revenue (US$ Mn) Comparison by By Component (2016-2032)
- Table 24: North America Digital Experience Platform Market Revenue (US$ Mn) Comparison by By Deployment Mode (2016-2032)
- Table 25: North America Digital Experience Platform Market Revenue (US$ Mn) Comparison by By Industry Vertical (2016-2032)
- Table 26: North America Digital Experience Platform Market Y-o-Y Growth Rate Comparison by Country (2016-2032)
- Table 27: North America Digital Experience Platform Market Y-o-Y Growth Rate Comparison by By Component (2016-2032)
- Table 28: North America Digital Experience Platform Market Y-o-Y Growth Rate Comparison by By Deployment Mode (2016-2032)
- Table 29: North America Digital Experience Platform Market Y-o-Y Growth Rate Comparison by By Industry Vertical (2016-2032)
- Table 30: North America Digital Experience Platform Market Share Comparison by Country (2016-2032)
- Table 31: North America Digital Experience Platform Market Share Comparison by By Component (2016-2032)
- Table 32: North America Digital Experience Platform Market Share Comparison by By Deployment Mode (2016-2032)
- Table 33: North America Digital Experience Platform Market Share Comparison by By Industry Vertical (2016-2032)
- Table 34: Western Europe Digital Experience Platform Market Comparison by By Component (2016-2032)
- Table 35: Western Europe Digital Experience Platform Market Comparison by By Deployment Mode (2016-2032)
- Table 36: Western Europe Digital Experience Platform Market Comparison by By Industry Vertical (2016-2032)
- Table 37: Western Europe Digital Experience Platform Market Revenue (US$ Mn) Comparison by Country (2016-2032)
- Table 38: Western Europe Digital Experience Platform Market Revenue (US$ Mn) (2016-2032)
- Table 39: Western Europe Digital Experience Platform Market Revenue (US$ Mn) Comparison by Country (2016-2032)
- Table 40: Western Europe Digital Experience Platform Market Revenue (US$ Mn) Comparison by By Component (2016-2032)
- Table 41: Western Europe Digital Experience Platform Market Revenue (US$ Mn) Comparison by By Deployment Mode (2016-2032)
- Table 42: Western Europe Digital Experience Platform Market Revenue (US$ Mn) Comparison by By Industry Vertical (2016-2032)
- Table 43: Western Europe Digital Experience Platform Market Y-o-Y Growth Rate Comparison by Country (2016-2032)
- Table 44: Western Europe Digital Experience Platform Market Y-o-Y Growth Rate Comparison by By Component (2016-2032)
- Table 45: Western Europe Digital Experience Platform Market Y-o-Y Growth Rate Comparison by By Deployment Mode (2016-2032)
- Table 46: Western Europe Digital Experience Platform Market Y-o-Y Growth Rate Comparison by By Industry Vertical (2016-2032)
- Table 47: Western Europe Digital Experience Platform Market Share Comparison by Country (2016-2032)
- Table 48: Western Europe Digital Experience Platform Market Share Comparison by By Component (2016-2032)
- Table 49: Western Europe Digital Experience Platform Market Share Comparison by By Deployment Mode (2016-2032)
- Table 50: Western Europe Digital Experience Platform Market Share Comparison by By Industry Vertical (2016-2032)
- Table 51: Eastern Europe Digital Experience Platform Market Comparison by By Component (2016-2032)
- Table 52: Eastern Europe Digital Experience Platform Market Comparison by By Deployment Mode (2016-2032)
- Table 53: Eastern Europe Digital Experience Platform Market Comparison by By Industry Vertical (2016-2032)
- Table 54: Eastern Europe Digital Experience Platform Market Revenue (US$ Mn) Comparison by Country (2016-2032)
- Table 55: Eastern Europe Digital Experience Platform Market Revenue (US$ Mn) (2016-2032)
- Table 56: Eastern Europe Digital Experience Platform Market Revenue (US$ Mn) Comparison by Country (2016-2032)
- Table 57: Eastern Europe Digital Experience Platform Market Revenue (US$ Mn) Comparison by By Component (2016-2032)
- Table 58: Eastern Europe Digital Experience Platform Market Revenue (US$ Mn) Comparison by By Deployment Mode (2016-2032)
- Table 59: Eastern Europe Digital Experience Platform Market Revenue (US$ Mn) Comparison by By Industry Vertical (2016-2032)
- Table 60: Eastern Europe Digital Experience Platform Market Y-o-Y Growth Rate Comparison by Country (2016-2032)
- Table 61: Eastern Europe Digital Experience Platform Market Y-o-Y Growth Rate Comparison by By Component (2016-2032)
- Table 62: Eastern Europe Digital Experience Platform Market Y-o-Y Growth Rate Comparison by By Deployment Mode (2016-2032)
- Table 63: Eastern Europe Digital Experience Platform Market Y-o-Y Growth Rate Comparison by By Industry Vertical (2016-2032)
- Table 64: Eastern Europe Digital Experience Platform Market Share Comparison by Country (2016-2032)
- Table 65: Eastern Europe Digital Experience Platform Market Share Comparison by By Component (2016-2032)
- Table 66: Eastern Europe Digital Experience Platform Market Share Comparison by By Deployment Mode (2016-2032)
- Table 67: Eastern Europe Digital Experience Platform Market Share Comparison by By Industry Vertical (2016-2032)
- Table 68: APAC Digital Experience Platform Market Comparison by By Component (2016-2032)
- Table 69: APAC Digital Experience Platform Market Comparison by By Deployment Mode (2016-2032)
- Table 70: APAC Digital Experience Platform Market Comparison by By Industry Vertical (2016-2032)
- Table 71: APAC Digital Experience Platform Market Revenue (US$ Mn) Comparison by Country (2016-2032)
- Table 72: APAC Digital Experience Platform Market Revenue (US$ Mn) (2016-2032)
- Table 73: APAC Digital Experience Platform Market Revenue (US$ Mn) Comparison by Country (2016-2032)
- Table 74: APAC Digital Experience Platform Market Revenue (US$ Mn) Comparison by By Component (2016-2032)
- Table 75: APAC Digital Experience Platform Market Revenue (US$ Mn) Comparison by By Deployment Mode (2016-2032)
- Table 76: APAC Digital Experience Platform Market Revenue (US$ Mn) Comparison by By Industry Vertical (2016-2032)
- Table 77: APAC Digital Experience Platform Market Y-o-Y Growth Rate Comparison by Country (2016-2032)
- Table 78: APAC Digital Experience Platform Market Y-o-Y Growth Rate Comparison by By Component (2016-2032)
- Table 79: APAC Digital Experience Platform Market Y-o-Y Growth Rate Comparison by By Deployment Mode (2016-2032)
- Table 80: APAC Digital Experience Platform Market Y-o-Y Growth Rate Comparison by By Industry Vertical (2016-2032)
- Table 81: APAC Digital Experience Platform Market Share Comparison by Country (2016-2032)
- Table 82: APAC Digital Experience Platform Market Share Comparison by By Component (2016-2032)
- Table 83: APAC Digital Experience Platform Market Share Comparison by By Deployment Mode (2016-2032)
- Table 84: APAC Digital Experience Platform Market Share Comparison by By Industry Vertical (2016-2032)
- Table 85: Latin America Digital Experience Platform Market Comparison by By Component (2016-2032)
- Table 86: Latin America Digital Experience Platform Market Comparison by By Deployment Mode (2016-2032)
- Table 87: Latin America Digital Experience Platform Market Comparison by By Industry Vertical (2016-2032)
- Table 88: Latin America Digital Experience Platform Market Revenue (US$ Mn) Comparison by Country (2016-2032)
- Table 89: Latin America Digital Experience Platform Market Revenue (US$ Mn) (2016-2032)
- Table 90: Latin America Digital Experience Platform Market Revenue (US$ Mn) Comparison by Country (2016-2032)
- Table 91: Latin America Digital Experience Platform Market Revenue (US$ Mn) Comparison by By Component (2016-2032)
- Table 92: Latin America Digital Experience Platform Market Revenue (US$ Mn) Comparison by By Deployment Mode (2016-2032)
- Table 93: Latin America Digital Experience Platform Market Revenue (US$ Mn) Comparison by By Industry Vertical (2016-2032)
- Table 94: Latin America Digital Experience Platform Market Y-o-Y Growth Rate Comparison by Country (2016-2032)
- Table 95: Latin America Digital Experience Platform Market Y-o-Y Growth Rate Comparison by By Component (2016-2032)
- Table 96: Latin America Digital Experience Platform Market Y-o-Y Growth Rate Comparison by By Deployment Mode (2016-2032)
- Table 97: Latin America Digital Experience Platform Market Y-o-Y Growth Rate Comparison by By Industry Vertical (2016-2032)
- Table 98: Latin America Digital Experience Platform Market Share Comparison by Country (2016-2032)
- Table 99: Latin America Digital Experience Platform Market Share Comparison by By Component (2016-2032)
- Table 100: Latin America Digital Experience Platform Market Share Comparison by By Deployment Mode (2016-2032)
- Table 101: Latin America Digital Experience Platform Market Share Comparison by By Industry Vertical (2016-2032)
- Table 102: Middle East & Africa Digital Experience Platform Market Comparison by By Component (2016-2032)
- Table 103: Middle East & Africa Digital Experience Platform Market Comparison by By Deployment Mode (2016-2032)
- Table 104: Middle East & Africa Digital Experience Platform Market Comparison by By Industry Vertical (2016-2032)
- Table 105: Middle East & Africa Digital Experience Platform Market Revenue (US$ Mn) Comparison by Country (2016-2032)
- Table 106: Middle East & Africa Digital Experience Platform Market Revenue (US$ Mn) (2016-2032)
- Table 107: Middle East & Africa Digital Experience Platform Market Revenue (US$ Mn) Comparison by Country (2016-2032)
- Table 108: Middle East & Africa Digital Experience Platform Market Revenue (US$ Mn) Comparison by By Component (2016-2032)
- Table 109: Middle East & Africa Digital Experience Platform Market Revenue (US$ Mn) Comparison by By Deployment Mode (2016-2032)
- Table 110: Middle East & Africa Digital Experience Platform Market Revenue (US$ Mn) Comparison by By Industry Vertical (2016-2032)
- Table 111: Middle East & Africa Digital Experience Platform Market Y-o-Y Growth Rate Comparison by Country (2016-2032)
- Table 112: Middle East & Africa Digital Experience Platform Market Y-o-Y Growth Rate Comparison by By Component (2016-2032)
- Table 113: Middle East & Africa Digital Experience Platform Market Y-o-Y Growth Rate Comparison by By Deployment Mode (2016-2032)
- Table 114: Middle East & Africa Digital Experience Platform Market Y-o-Y Growth Rate Comparison by By Industry Vertical (2016-2032)
- Table 115: Middle East & Africa Digital Experience Platform Market Share Comparison by Country (2016-2032)
- Table 116: Middle East & Africa Digital Experience Platform Market Share Comparison by By Component (2016-2032)
- Table 117: Middle East & Africa Digital Experience Platform Market Share Comparison by By Deployment Mode (2016-2032)
- Table 118: Middle East & Africa Digital Experience Platform Market Share Comparison by By Industry Vertical (2016-2032)
- 1. Executive Summary
-
Our Clients


View Our Licence Options
