
Demister Market Type(Wire-mesh Demister ,Baffle-type Demister), Application(Petrochemical, Chemical, Power, Gas Processing) By Region And Companies - Industry Segment Outlook, Market Assessment, Competition Scenario, Trends, And Forecast 2023-2032
-
42476
-
Jan 2022
-
158
-


-
This report was compiled by Shreyas Rokade Shreyas Rokade is a seasoned Research Analyst with CMFE, bringing extensive expertise in market research and consulting, with a strong background in Chemical Engineering. Correspondence Team Lead-CMFE Linkedin | Detailed Market research Methodology Our methodology involves a mix of primary research, including interviews with leading mental health experts, and secondary research from reputable medical journals and databases. View Detailed Methodology Page
-
Quick Navigation
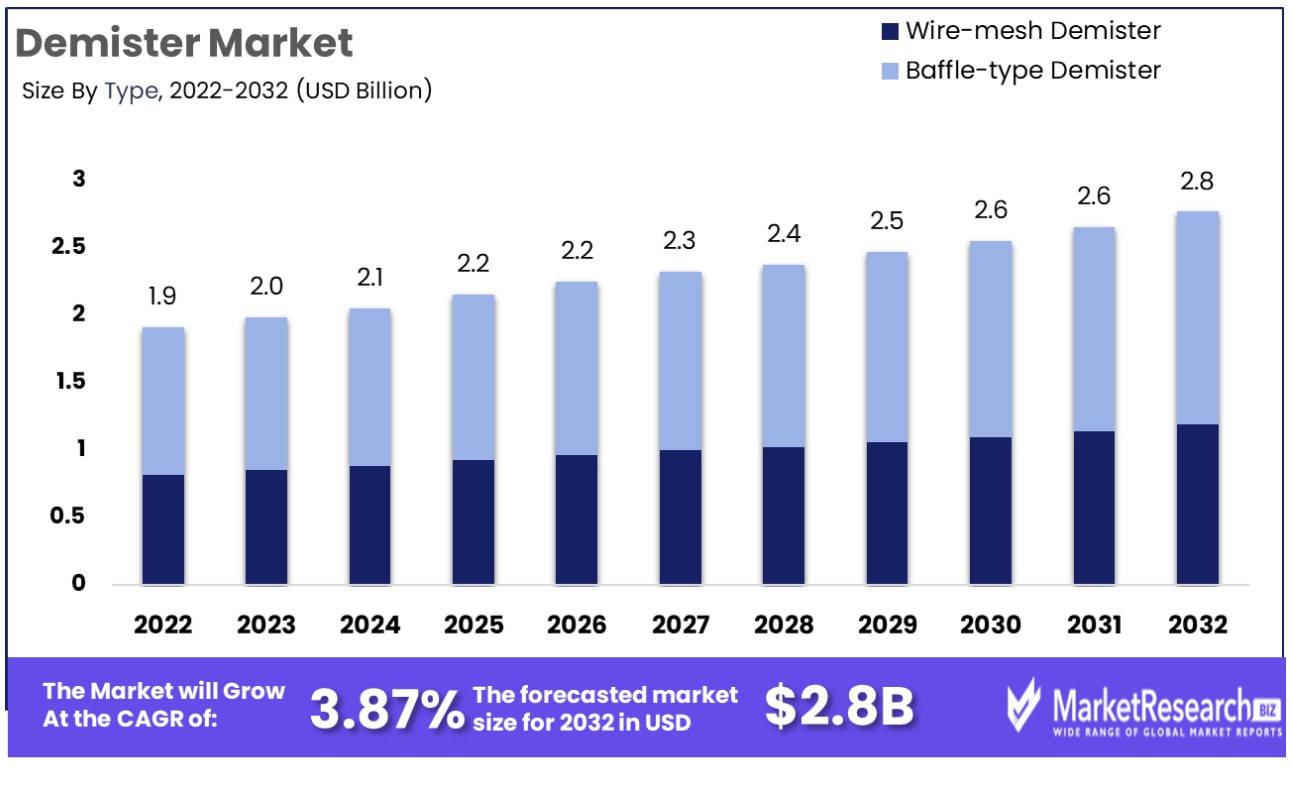
Demister Market size is predicted to reach approximately USD 2.8 Bn by 2032, from a valuation of USD 1.91 Billion in 2022, growing at a CAGR of 3.87% during the forecast period from 2023 to 2032.
A demister, also known as a mist eliminator, is an engineering control device designed to remove liquid droplets, or mist, from vapor streams. Demisters operate on the principles of inertia, diffusion, interception, and impaction to capture entrained liquids within fiber beds or mesh pads.
As vapor passes through the demister, liquid droplets are unable to navigate the convoluted structure and adhere to the media instead. Demisters are commonly installed in vapor lines near vapor-liquid separations to prevent liquid carryover and serve critical roles in protecting downstream equipment, ensuring product purity, and preventing hazardous conditions related to certain mists. Key demister selection factors include pressure drop, liquid loading, and chemical compatibility.
The Demister Market is expected to experience steady growth over the coming years driven by several key factors. One major driver is the increasing demand from various industrial sectors such as oil and gas, power generation, food and beverage, and chemicals. These industries rely on demisters to remove droplets and particles from gas streams to protect equipment, improve efficiency, and meet environmental regulations. For example, demisters are used in gas processing plants and refineries to remove liquid hydrocarbons from natural gas streams.
Another growth driver for the Demister Market is the expansion of HVAC and pollution control systems globally. Demisters play a vital role in these systems by capturing water droplets and pollutant particles.
With construction activity and industrialization on the rise in developing regions, particularly Asia Pacific, the installation rates for HVAC and air filtration systems are climbing, fueling demand for demister components. stringent air quality standards being implemented by governments also compel industries to adopt effective mist elimination solutions into their operations.
Key growth factors for the demister market include rising demand from oil and gas upstream operations, refining capacity additions, increasing nuclear and fossil fuel power generation, and stronger adoption of demisters in HVAC systems and compressed air streams.
The oil and gas sectors contribute substantially to demister market growth as upstream production sites require vapor-liquid separations and gas conditioning systems while refineries utilize demisters to support distillation, cracking, coking, and desalting units. Moreover, major investments planned for natural gas processing and LNG infrastructure should spur the usage of demisters over the next decade.
Demand from the power industry is also projected to expand as mist elimination protects turbine machinery, and HVAC and compressed air demister integrations rise. In summary, increasing capital investment across energy, industrial, and commercial sectors correlates with climbing utilization of separation and purification hardware, which should drive growth opportunities in the global demister market through the forecast period.
Driving Factors
Diverse Industrial Demand Fuels Demister Market Growth
The increasing demand for demisters across various industries, including oil and gas, chemical processing, power generation, pharmaceuticals, and food and beverage, is a significant driver for the demister market. This growth is attributed to the essential role demisters play in ensuring operational efficiency and process integrity.
In industries where gas-liquid separations are crucial, demisters are increasingly being integrated to enhance efficiency, reduce product loss, and maintain quality. This wide-ranging industrial application reflects a market responding to a universal need for efficient separation technologies. The ongoing demand across these diverse sectors suggests a robust and sustained growth trajectory for the demister market, as industries continue to prioritize efficiency and process optimization in their operations.
Environmental Regulations Propel Demister Adoption
Strict environmental regulations are a key factor driving the demand for demisters, as they are instrumental in reducing emissions and improving efficiency in industrial processes. Governments and regulatory bodies worldwide are imposing stringent environmental standards, particularly focusing on emission control and waste reduction.
Demisters play a critical role in meeting these standards by efficiently separating pollutants from gas streams, thus minimizing environmental impact. This regulatory push is compelling industries to adopt demisters, not just for compliance but as part of responsible environmental stewardship. The trend towards tighter environmental controls is expected to continue, reinforcing the importance of demisters in industrial applications and sustaining market growth.
Coal-Fired Power Plants Demand Boosts Demister Market
The rise in demand for coal-fired power plants is likely to drive the growth of the demister market over the forecast period. Despite the global shift towards renewable energy, coal-fired plants remain a significant source of power generation, especially in developing regions. Demisters are critical in these facilities for controlling emissions and improving operational efficiency.
As coal remains a key energy source in certain geographies, the need for efficient and environmentally responsible technologies like demisters in these plants is accentuated. This demand, driven by the ongoing reliance on coal-fired power, suggests a market opportunity for demisters, particularly in regions where coal remains a dominant energy source. The future of the demister market in this context is linked closely to the global energy mix and environmental policies surrounding coal-powered electricity generation.
Restraining Factors
Adoption of Alternative Renewable Energy Sources Restrains Demister Market Growth
The shift towards alternative renewable energy sources significantly restrains the growth of the demister market. Demisters are primarily used in industries like oil and gas for separating liquid droplets from gas streams.
As the global focus intensifies on reducing dependency on fossil fuels and promoting renewable energy, the demand for equipment used in traditional energy sectors, including demisters, is expected to decline. The adoption of cleaner energy sources like wind, solar, and hydroelectric power, which do not require demisting solutions, directly impacts the market's potential for growth in its traditional stronghold sectors.
Advancements in Alternative Separation Technologies Challenge Demister Market Growth
Progress in alternative separation technologies poses a challenge to the demister market. As industries continually seek more efficient and cost-effective solutions for gas-liquid separation, innovative technologies are emerging as competitors to traditional demisters.
These new technologies, which may offer higher efficiency, lower energy consumption, or reduced operational costs, can shift industry preference away from conventional demisters. This trend is particularly pronounced in sectors that are heavily invested in research and development for improving process efficiencies. As a result, the demister market faces the risk of reduced demand if these alternative technologies prove to be more advantageous for industrial applications.
Market Segmentation Analysis
by Type Analysis
Wire-mesh demisters are the leading type in the Demister Market. Their dominance is due to their efficiency in removing liquid droplets from gas or vapor streams, a critical requirement in various industrial processes. Wire mesh demisters operate by coalescing small droplets into larger ones that are heavy enough to be separated from the vapor phase.
Their popularity stems from their cost-effectiveness, low-pressure drop, ease of installation, and adaptability to a wide range of applications. The effectiveness of wire mesh demisters in preventing product loss and protecting downstream equipment from corrosion and fouling makes them a preferred choice in many industries.
Baffle-type demisters, although less common than wire mesh, are used in applications where larger droplets need to be removed. They are typically employed in systems where the gas stream has a higher liquid content.
By Application Analysis
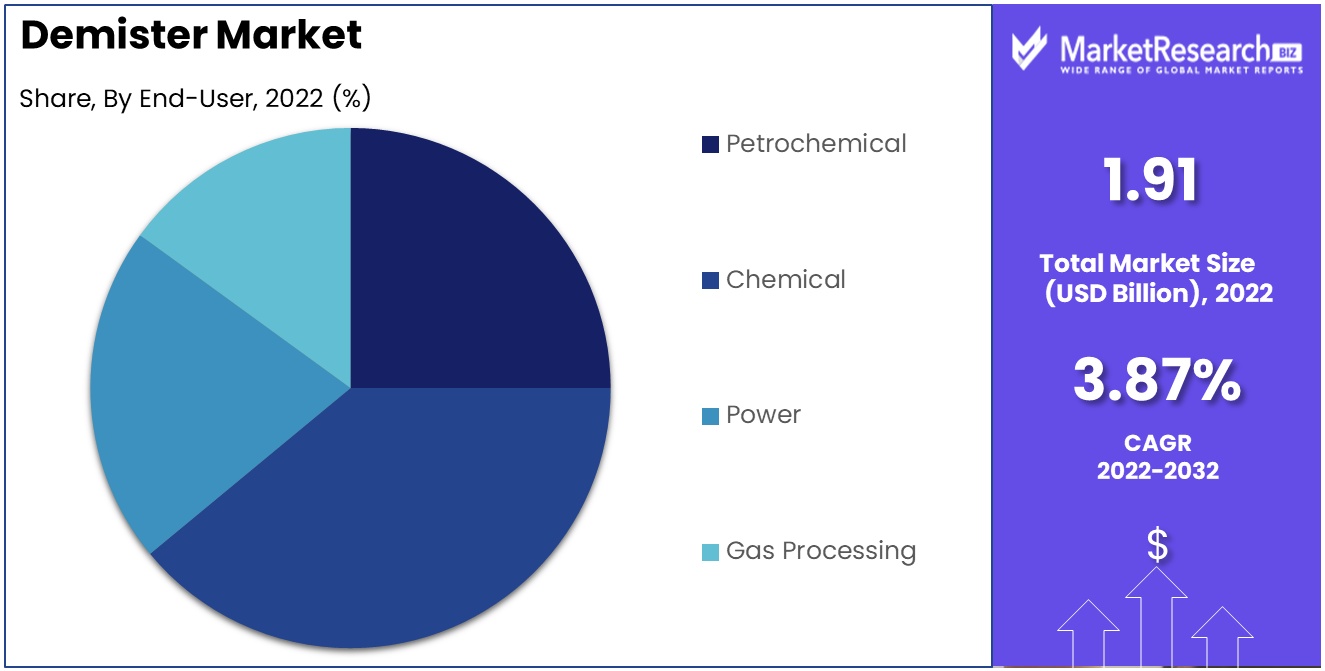
The petrochemical industry is the dominant application segment for demisters. In this sector, demisters are crucial for separating hydrocarbon liquids from gases in refining processes. Their role is essential in protecting downstream equipment, improving product quality, and ensuring operational safety. The demand in this segment is driven by the expansion of the petrochemical industry, the need for more efficient separation technologies, and the tightening of environmental regulations regarding emissions.
In the chemical industry, demisters are used for purifying products and protecting equipment. In power plants, they play a role in steam generation and turbine protection. The gas processing industry utilizes demisters for natural gas purification and to ensure pipeline integrity. Each of these applications contributes to the overall market demand for demisters, with specific requirements based on the nature of the processes involved.
Demister Market Key Segments
Type
- Wire-mesh Demister
- Baffle-type Demister
Application
- Petrochemical
- Chemical
- Power
- Gas Processing
Growth Opportunities
Increasing Industrial Demand Drives Growth in the Demister Market
The growing demand for demisters across various industries, including oil and gas, chemical processing, power generation, pharmaceuticals, and food and beverage, is a significant driver of growth in the demister market. These industries require efficient separation technologies to improve process efficiency, reduce emissions, and ensure product quality.
Demisters play a crucial role in removing entrained liquid droplets from gas streams, enhancing operational effectiveness. The increasing industrial focus on environmental compliance and process optimization is boosting the demand for demisters, indicating a strong expansion potential for the market.
Petrochemical Industry's Dominance Spurs Expansion in Demister Market
The petrochemical industry's dominance in the demister market in 2022, and its expected substantial compound annual growth rate (CAGR), highlight significant expansion opportunities.
Demisters are essential in the petrochemical sector for gas-liquid separation processes, contributing to both environmental compliance and process efficiency. The industry's expansion, coupled with the ongoing need for advanced separation technologies, suggests a sustained demand for demisters. The forecasted growth of this segment implies that the petrochemical industry will continue to be a major driver in the demister market, reinforcing its position and contributing to the overall market growth.
Demister Market Regional Analysis
North America Dominates with 34.20% Market Share
North America's significant 34.20% share in the global Demister Market is largely attributed to the region's robust industrial sector, particularly in oil and gas, chemical processing, and power generation. These industries require efficient demisting solutions to ensure clean emissions and process efficiency, driving the demand for demisters. The region's emphasis on environmental regulations and the need to control air pollution from industrial processes further bolsters the market. Additionally, the presence of leading demister manufacturers in North America, known for their technological innovation and quality products, contributes to the region's market dominance.
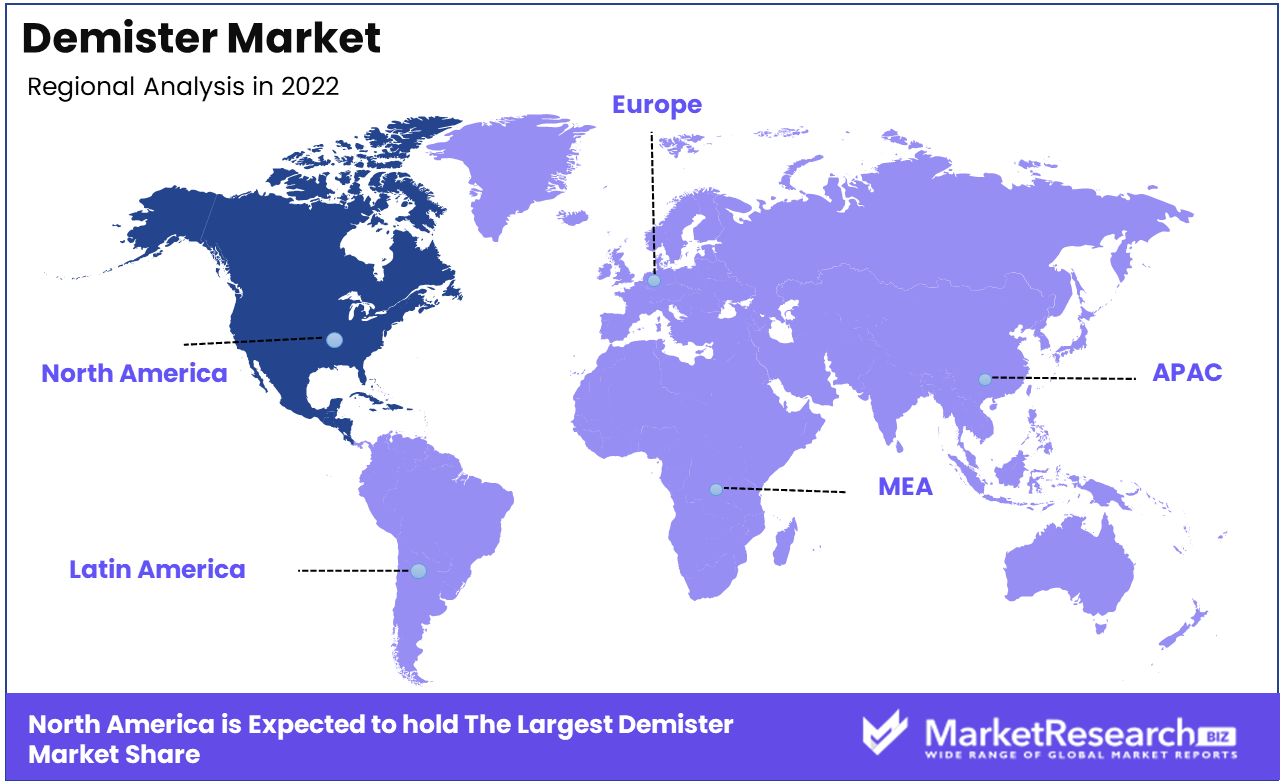
The market dynamics in North America are influenced by ongoing technological advancements in demisting solutions and the rising adoption of eco-friendly and energy-efficient practices in industrial operations. The increase in exploration and production activities in the oil and gas sector also necessitates the use of demisters for gas-liquid separation processes. Furthermore, the region's commitment to improving air quality and reducing greenhouse gas emissions drives the demand for effective demisting systems in various industrial applications.
Europe’s High Standards in Industrial Emissions Control
Europe's demister market is driven by the region's stringent regulations on industrial emissions and a strong focus on environmental protection. European industries prioritize the implementation of efficient gas-liquid separation technologies to comply with environmental standards, supporting the demand for demisters. The region's emphasis on sustainable industrial practices and technological advancements in demisting solutions contribute to the market's growth.
Asia-Pacific’s Rapid Industrial Growth and Environmental Concerns
In Asia-Pacific, the demister market is expanding rapidly, fueled by the region's rapid industrialization and growing environmental concerns. Countries like China, India, and Japan are investing in upgrading their industrial infrastructure, including the adoption of effective emission control technologies. The increasing awareness of air pollution's impact on health and the environment in these densely populated countries drives the demand for demisters, positioning Asia-Pacific as a key emerging market in this sector.
Demister Industry By Region
North America
- The US
- Canada
Europe
- Germany
- France
- The UK
- Spain
- Italy
- Russia
- Netherlands
- Rest of Europe
Asia-Pacific
- China
- Japan
- South Korea
- India
- New Zealand
- Singapore
- Thailand
- Vietnam
- Rest of Asia Pacific
Latin America
- Brazil
- Mexico
- Rest of Latin America
Middle East & Africa
- South Africa
- Saudi Arabia
- UAE
- Rest of the Middle East & Africa
Major Market Players in Demister Market
In the Demister Market, essential for efficient separation processes in various industries, the companies listed contribute uniquely to the sector's growth and technological advancement. Pneumatic Product and Aeroex focus on air quality and filtration solutions, playing critical roles in enhancing the efficiency and effectiveness of demisters, catering to a broad range of industrial applications.
MECS and Koch-Glitsch, with their expertise in mass transfer and separation technologies, are crucial in advancing demister designs and materials, offering solutions that optimize separation processes in chemical and petrochemical industries. Geovent and FABCO-AIR, although smaller in scale, contribute significantly with specialized and custom solutions, demonstrating the industry's diversity and adaptability to various operational requirements.
Met-Pro Environmental Air Solutions and Coastal Technologies, Inc., focus on environmental and air quality solutions, highlighting the market's shift towards sustainable and eco-friendly industrial practices. AMACS and Munters, leveraging their expertise in industrial separation and air treatment, provide key technologies that enhance the operational efficiency of demisters in diverse industrial settings.
Collectively, these companies not only drive the Demister Market's growth but also represent a spectrum of strategies - from focusing on material and design innovation to catering to specific industrial needs - crucial for maintaining operational efficiency and environmental compliance in diverse industrial sectors.
Major Market Players in Demister Market
- Pneumatic Product
- Aeroex
- MECS
- Koch-Glitsch
- Geovent
- FABCO-AIR
- Met-Pro Environmental Air Solutions
- Coastal Technologies, Inc.
- AMACS
- Munters
- Boegger Industrial Limited
- Ningbo T.C.I Co., Ltd
- Industrial Maid
- Champion
- Mikropor
- Sulzer
Recent Developments
- February 2023- Range Rover Velar announced with enhanced interior & technologies. The user can set the sidebar to provide shortcuts to in-car programs, such as Pivi Pro's media and navigation apps, as well as the vehicle cameras and window demisters.+
Report Scope
Report Features Description Market Value (2022) US$ 1.91 Bn Forecast Revenue (2032) US$ 2.8Bn CAGR (2023-2032) 3.87% Base Year for Estimation 2022 Historic Period 2016-2022 Forecast Period 2023-2032 Report Coverage Revenue Forecast, Market Dynamics, COVID-19 Impact, Competitive Landscape, Recent Developments Segments Covered Type(Wire-mesh Demister, Baffle-type Demister), Application(Petrochemical, Chemical, Power, Gas Processing) Regional Analysis North America - The US, Canada, Europe - Germany, France, The UK, Spain, Italy, Russia, Netherlands, Rest of Europe, Asia-Pacific - China, Japan, South Korea, India, New Zealand, Singapore, Thailand, Vietnam, Rest of Asia Pacific, Latin America - Brazil, Mexico, Rest of Latin America, Middle East & Africa - South Africa, Saudi Arabia, UAE, Rest of Middle East & Africa Competitive Landscape Pneumatic Product, Aeroex, MECS, Koch-Glitsch, Geovent, FABCO-AIR, Met-Pro Environmental Air Solutions, Coastal Technologies, Inc., AMACS, Munters, Boegger Industrial Limited, Ningbo T.C.I Co., Ltd, Industrial Maid, Champion, Mikropor, Sulzer Customization Scope Customization for segments, region/country-level will be provided. Moreover, additional customization can be done based on the requirements. Purchase Options We have three licenses to opt for: Single User License, Multi-User License (Up to 5 Users), Corporate Use License (Unlimited User and Printable PDF) -
- 1. Executive Summary
- 1.1. Definition
- 1.2. Taxonomy
- 1.3. Research Scope
- 1.4. Key Analysis
- 1.5. Key Findings by Major Segments
- 1.6. Top strategies by Major Players
- 2. Global Structural Health Monitoring Market Overview
- 2.1. Structural Health Monitoring Market Dynamics
- 2.1.1. Drivers
- 2.1.2. Opportunities
- 2.1.3. Restraints
- 2.1.4. Challenges
- 2.2. Macro-economic Factors
- 2.3. Regulatory Framework
- 2.4. Market Investment Feasibility Index
- 2.5. PEST Analysis
- 2.6. PORTER’S Five Force Analysis
- 2.7. Drivers & Restraints Impact Analysis
- 2.8. Industry Chain Analysis
- 2.9. Cost Structure Analysis
- 2.10. Marketing Strategy
- 2.11. Russia-Ukraine War Impact Analysis
- 2.12. Opportunity Map Analysis
- 2.13. Market Competition Scenario Analysis
- 2.14. Product Life Cycle Analysis
- 2.15. Opportunity Orbits
- 2.16. Manufacturer Intensity Map
- 2.17. Major Companies sales by Value & Volume
- 2.1. Structural Health Monitoring Market Dynamics
- 3. Global Structural Health Monitoring Market Analysis, Opportunity and Forecast, 2016-2032
- 3.1. Global Structural Health Monitoring Market Analysis, 2016-2021
- 3.2. Global Structural Health Monitoring Market Opportunity and Forecast, 2023-2032
- 3.3. Global Structural Health Monitoring Market Analysis, Opportunity and Forecast, By Type, 2016-2032
- 3.3.1. Global Structural Health Monitoring Market Analysis by Type: Introduction
- 3.3.2. Market Size Absolute $ Opportunity Analysis and Forecast, By Type, 2016-2032
- 3.3.3. Wire-mesh Demister
- 3.3.4. Baffle-type Demister
- 3.4. Global Structural Health Monitoring Market Analysis, Opportunity and Forecast, By Application, 2016-2032
- 3.4.1. Global Structural Health Monitoring Market Analysis by Application: Introduction
- 3.4.2. Market Size Absolute $ Opportunity Analysis and Forecast, By Application, 2016-2032
- 3.4.3. Petrochemical
- 3.4.4. Chemical
- 3.4.5. Power
- 3.4.6. Gas Processing
- 4. North America Structural Health Monitoring Market Analysis, Opportunity and Forecast, 2016-2032
- 4.1. North America Structural Health Monitoring Market Analysis, 2016-2021
- 4.2. North America Structural Health Monitoring Market Opportunity and Forecast, 2023-2032
- 4.3. North America Structural Health Monitoring Market Analysis, Opportunity and Forecast, By Type, 2016-2032
- 4.3.1. North America Structural Health Monitoring Market Analysis by Type: Introduction
- 4.3.2. Market Size Absolute $ Opportunity Analysis and Forecast, By Type, 2016-2032
- 4.3.3. Wire-mesh Demister
- 4.3.4. Baffle-type Demister
- 4.4. North America Structural Health Monitoring Market Analysis, Opportunity and Forecast, By Application, 2016-2032
- 4.4.1. North America Structural Health Monitoring Market Analysis by Application: Introduction
- 4.4.2. Market Size Absolute $ Opportunity Analysis and Forecast, By Application, 2016-2032
- 4.4.3. Petrochemical
- 4.4.4. Chemical
- 4.4.5. Power
- 4.4.6. Gas Processing
- 4.5. North America Structural Health Monitoring Market Analysis, Opportunity and Forecast, By Country , 2016-2032
- 4.5.1. North America Structural Health Monitoring Market Analysis by Country : Introduction
- 4.5.2. Market Size Absolute $ Opportunity Analysis and Forecast, Country , 2016-2032
- 4.5.2.1. The US
- 4.5.2.2. Canada
- 4.5.2.3. Mexico
- 5. Western Europe Structural Health Monitoring Market Analysis, Opportunity and Forecast, 2016-2032
- 5.1. Western Europe Structural Health Monitoring Market Analysis, 2016-2021
- 5.2. Western Europe Structural Health Monitoring Market Opportunity and Forecast, 2023-2032
- 5.3. Western Europe Structural Health Monitoring Market Analysis, Opportunity and Forecast, By Type, 2016-2032
- 5.3.1. Western Europe Structural Health Monitoring Market Analysis by Type: Introduction
- 5.3.2. Market Size Absolute $ Opportunity Analysis and Forecast, By Type, 2016-2032
- 5.3.3. Wire-mesh Demister
- 5.3.4. Baffle-type Demister
- 5.4. Western Europe Structural Health Monitoring Market Analysis, Opportunity and Forecast, By Application, 2016-2032
- 5.4.1. Western Europe Structural Health Monitoring Market Analysis by Application: Introduction
- 5.4.2. Market Size Absolute $ Opportunity Analysis and Forecast, By Application, 2016-2032
- 5.4.3. Petrochemical
- 5.4.4. Chemical
- 5.4.5. Power
- 5.4.6. Gas Processing
- 5.5. Western Europe Structural Health Monitoring Market Analysis, Opportunity and Forecast, By Country , 2016-2032
- 5.5.1. Western Europe Structural Health Monitoring Market Analysis by Country : Introduction
- 5.5.2. Market Size Absolute $ Opportunity Analysis and Forecast, Country , 2016-2032
- 5.5.2.1. Germany
- 5.5.2.2. France
- 5.5.2.3. The UK
- 5.5.2.4. Spain
- 5.5.2.5. Italy
- 5.5.2.6. Portugal
- 5.5.2.7. Ireland
- 5.5.2.8. Austria
- 5.5.2.9. Switzerland
- 5.5.2.10. Benelux
- 5.5.2.11. Nordic
- 5.5.2.12. Rest of Western Europe
- 6. Eastern Europe Structural Health Monitoring Market Analysis, Opportunity and Forecast, 2016-2032
- 6.1. Eastern Europe Structural Health Monitoring Market Analysis, 2016-2021
- 6.2. Eastern Europe Structural Health Monitoring Market Opportunity and Forecast, 2023-2032
- 6.3. Eastern Europe Structural Health Monitoring Market Analysis, Opportunity and Forecast, By Type, 2016-2032
- 6.3.1. Eastern Europe Structural Health Monitoring Market Analysis by Type: Introduction
- 6.3.2. Market Size Absolute $ Opportunity Analysis and Forecast, By Type, 2016-2032
- 6.3.3. Wire-mesh Demister
- 6.3.4. Baffle-type Demister
- 6.4. Eastern Europe Structural Health Monitoring Market Analysis, Opportunity and Forecast, By Application, 2016-2032
- 6.4.1. Eastern Europe Structural Health Monitoring Market Analysis by Application: Introduction
- 6.4.2. Market Size Absolute $ Opportunity Analysis and Forecast, By Application, 2016-2032
- 6.4.3. Petrochemical
- 6.4.4. Chemical
- 6.4.5. Power
- 6.4.6. Gas Processing
- 6.5. Eastern Europe Structural Health Monitoring Market Analysis, Opportunity and Forecast, By Country , 2016-2032
- 6.5.1. Eastern Europe Structural Health Monitoring Market Analysis by Country : Introduction
- 6.5.2. Market Size Absolute $ Opportunity Analysis and Forecast, Country , 2016-2032
- 6.5.2.1. Russia
- 6.5.2.2. Poland
- 6.5.2.3. The Czech Republic
- 6.5.2.4. Greece
- 6.5.2.5. Rest of Eastern Europe
- 7. APAC Structural Health Monitoring Market Analysis, Opportunity and Forecast, 2016-2032
- 7.1. APAC Structural Health Monitoring Market Analysis, 2016-2021
- 7.2. APAC Structural Health Monitoring Market Opportunity and Forecast, 2023-2032
- 7.3. APAC Structural Health Monitoring Market Analysis, Opportunity and Forecast, By Type, 2016-2032
- 7.3.1. APAC Structural Health Monitoring Market Analysis by Type: Introduction
- 7.3.2. Market Size Absolute $ Opportunity Analysis and Forecast, By Type, 2016-2032
- 7.3.3. Wire-mesh Demister
- 7.3.4. Baffle-type Demister
- 7.4. APAC Structural Health Monitoring Market Analysis, Opportunity and Forecast, By Application, 2016-2032
- 7.4.1. APAC Structural Health Monitoring Market Analysis by Application: Introduction
- 7.4.2. Market Size Absolute $ Opportunity Analysis and Forecast, By Application, 2016-2032
- 7.4.3. Petrochemical
- 7.4.4. Chemical
- 7.4.5. Power
- 7.4.6. Gas Processing
- 7.5. APAC Structural Health Monitoring Market Analysis, Opportunity and Forecast, By Country , 2016-2032
- 7.5.1. APAC Structural Health Monitoring Market Analysis by Country : Introduction
- 7.5.2. Market Size Absolute $ Opportunity Analysis and Forecast, Country , 2016-2032
- 7.5.2.1. China
- 7.5.2.2. Japan
- 7.5.2.3. South Korea
- 7.5.2.4. India
- 7.5.2.5. Australia & New Zeland
- 7.5.2.6. Indonesia
- 7.5.2.7. Malaysia
- 7.5.2.8. Philippines
- 7.5.2.9. Singapore
- 7.5.2.10. Thailand
- 7.5.2.11. Vietnam
- 7.5.2.12. Rest of APAC
- 8. Latin America Structural Health Monitoring Market Analysis, Opportunity and Forecast, 2016-2032
- 8.1. Latin America Structural Health Monitoring Market Analysis, 2016-2021
- 8.2. Latin America Structural Health Monitoring Market Opportunity and Forecast, 2023-2032
- 8.3. Latin America Structural Health Monitoring Market Analysis, Opportunity and Forecast, By Type, 2016-2032
- 8.3.1. Latin America Structural Health Monitoring Market Analysis by Type: Introduction
- 8.3.2. Market Size Absolute $ Opportunity Analysis and Forecast, By Type, 2016-2032
- 8.3.3. Wire-mesh Demister
- 8.3.4. Baffle-type Demister
- 8.4. Latin America Structural Health Monitoring Market Analysis, Opportunity and Forecast, By Application, 2016-2032
- 8.4.1. Latin America Structural Health Monitoring Market Analysis by Application: Introduction
- 8.4.2. Market Size Absolute $ Opportunity Analysis and Forecast, By Application, 2016-2032
- 8.4.3. Petrochemical
- 8.4.4. Chemical
- 8.4.5. Power
- 8.4.6. Gas Processing
- 8.5. Latin America Structural Health Monitoring Market Analysis, Opportunity and Forecast, By Country , 2016-2032
- 8.5.1. Latin America Structural Health Monitoring Market Analysis by Country : Introduction
- 8.5.2. Market Size Absolute $ Opportunity Analysis and Forecast, Country , 2016-2032
- 8.5.2.1. Brazil
- 8.5.2.2. Colombia
- 8.5.2.3. Chile
- 8.5.2.4. Argentina
- 8.5.2.5. Costa Rica
- 8.5.2.6. Rest of Latin America
- 9. Middle East & Africa Structural Health Monitoring Market Analysis, Opportunity and Forecast, 2016-2032
- 9.1. Middle East & Africa Structural Health Monitoring Market Analysis, 2016-2021
- 9.2. Middle East & Africa Structural Health Monitoring Market Opportunity and Forecast, 2023-2032
- 9.3. Middle East & Africa Structural Health Monitoring Market Analysis, Opportunity and Forecast, By Type, 2016-2032
- 9.3.1. Middle East & Africa Structural Health Monitoring Market Analysis by Type: Introduction
- 9.3.2. Market Size Absolute $ Opportunity Analysis and Forecast, By Type, 2016-2032
- 9.3.3. Wire-mesh Demister
- 9.3.4. Baffle-type Demister
- 9.4. Middle East & Africa Structural Health Monitoring Market Analysis, Opportunity and Forecast, By Application, 2016-2032
- 9.4.1. Middle East & Africa Structural Health Monitoring Market Analysis by Application: Introduction
- 9.4.2. Market Size Absolute $ Opportunity Analysis and Forecast, By Application, 2016-2032
- 9.4.3. Petrochemical
- 9.4.4. Chemical
- 9.4.5. Power
- 9.4.6. Gas Processing
- 9.5. Middle East & Africa Structural Health Monitoring Market Analysis, Opportunity and Forecast, By Country , 2016-2032
- 9.5.1. Middle East & Africa Structural Health Monitoring Market Analysis by Country : Introduction
- 9.5.2. Market Size Absolute $ Opportunity Analysis and Forecast, Country , 2016-2032
- 9.5.2.1. Algeria
- 9.5.2.2. Egypt
- 9.5.2.3. Israel
- 9.5.2.4. Kuwait
- 9.5.2.5. Nigeria
- 9.5.2.6. Saudi Arabia
- 9.5.2.7. South Africa
- 9.5.2.8. Turkey
- 9.5.2.9. The UAE
- 9.5.2.10. Rest of MEA
- 10. Global Structural Health Monitoring Market Analysis, Opportunity and Forecast, By Region , 2016-2032
- 10.1. Global Structural Health Monitoring Market Analysis by Region : Introduction
- 10.2. Market Size Absolute $ Opportunity Analysis and Forecast, By Region , 2016-2032
- 10.2.1. North America
- 10.2.2. Western Europe
- 10.2.3. Eastern Europe
- 10.2.4. APAC
- 10.2.5. Latin America
- 10.2.6. Middle East & Africa
- 11. Global Structural Health Monitoring Market Competitive Landscape, Market Share Analysis, and Company Profiles
- 11.1. Market Share Analysis
- 11.2. Company Profiles
- 11.3. Pneumatic Product
- 11.3.1. Company Overview
- 11.3.2. Financial Highlights
- 11.3.3. Product Portfolio
- 11.3.4. SWOT Analysis
- 11.3.5. Key Strategies and Developments
- 11.4. Aeroex
- 11.4.1. Company Overview
- 11.4.2. Financial Highlights
- 11.4.3. Product Portfolio
- 11.4.4. SWOT Analysis
- 11.4.5. Key Strategies and Developments
- 11.5. MECS
- 11.5.1. Company Overview
- 11.5.2. Financial Highlights
- 11.5.3. Product Portfolio
- 11.5.4. SWOT Analysis
- 11.5.5. Key Strategies and Developments
- 11.6. Koch-Glitsch
- 11.6.1. Company Overview
- 11.6.2. Financial Highlights
- 11.6.3. Product Portfolio
- 11.6.4. SWOT Analysis
- 11.6.5. Key Strategies and Developments
- 11.7. Geovent
- 11.7.1. Company Overview
- 11.7.2. Financial Highlights
- 11.7.3. Product Portfolio
- 11.7.4. SWOT Analysis
- 11.7.5. Key Strategies and Developments
- 11.8. FABCO-AIR
- 11.8.1. Company Overview
- 11.8.2. Financial Highlights
- 11.8.3. Product Portfolio
- 11.8.4. SWOT Analysis
- 11.8.5. Key Strategies and Developments
- 11.9. Met-Pro Environmental Air Solutions
- 11.9.1. Company Overview
- 11.9.2. Financial Highlights
- 11.9.3. Product Portfolio
- 11.9.4. SWOT Analysis
- 11.9.5. Key Strategies and Developments
- 11.10. Coastal Technologies, Inc.
- 11.10.1. Company Overview
- 11.10.2. Financial Highlights
- 11.10.3. Product Portfolio
- 11.10.4. SWOT Analysis
- 11.10.5. Key Strategies and Developments
- 11.11. AMACS
- 11.11.1. Company Overview
- 11.11.2. Financial Highlights
- 11.11.3. Product Portfolio
- 11.11.4. SWOT Analysis
- 11.11.5. Key Strategies and Developments
- 11.12. Munters
- 11.12.1. Company Overview
- 11.12.2. Financial Highlights
- 11.12.3. Product Portfolio
- 11.12.4. SWOT Analysis
- 11.12.5. Key Strategies and Developments
- 11.13.1. Company Overview
- 11.13.2. Financial Highlights
- 11.13.3. Product Portfolio
- 11.13.4. SWOT Analysis
- 11.13.5. Key Strategies and Developments
- 11.14. Boegger Industrial Limited
- 11.14.1. Company Overview
- 11.14.2. Financial Highlights
- 11.14.3. Product Portfolio
- 11.14.4. SWOT Analysis
- 11.14.5. Key Strategies and Developments
- 11.15. Industrial Maid
- 11.15.1. Company Overview
- 11.15.2. Financial Highlights
- 11.15.3. Product Portfolio
- 11.15.4. SWOT Analysis
- 11.15.5. Key Strategies and Developments
- 11.16. Champion
- 11.16.1. Company Overview
- 11.16.2. Financial Highlights
- 11.16.3. Product Portfolio
- 11.16.4. SWOT Analysis
- 11.16.5. Key Strategies and Developments
- 11.17. Mikropor
- 11.17.1. Company Overview
- 11.17.2. Financial Highlights
- 11.17.3. Product Portfolio
- 11.17.4. SWOT Analysis
- 11.17.5. Key Strategies and Developments
- 11.18. Sulzer
- 11.18.1. Company Overview
- 11.18.2. Financial Highlights
- 11.18.3. Product Portfolio
- 11.18.4. SWOT Analysis
- 11.18.5. Key Strategies and Developments
- 12. Assumptions and Acronyms
- 13. Research Methodology
- 14. Contact
"
- List of Figures
- "
- Figure 1: Global Structural Health Monitoring Market Revenue (US$ Mn) Market Share by Type in 2022
- Figure 2: Global Structural Health Monitoring Market Market Attractiveness Analysis by Type, 2016-2032
- Figure 3: Global Structural Health Monitoring Market Revenue (US$ Mn) Market Share by Applicationin 2022
- Figure 4: Global Structural Health Monitoring Market Market Attractiveness Analysis by Application, 2016-2032
- Figure 5: Global Structural Health Monitoring Market Revenue (US$ Mn) Market Share by Region in 2022
- Figure 6: Global Structural Health Monitoring Market Market Attractiveness Analysis by Region, 2016-2032
- Figure 7: Global Structural Health Monitoring Market Market Revenue (US$ Mn) (2016-2032)
- Figure 8: Global Structural Health Monitoring Market Market Revenue (US$ Mn) Comparison by Region (2016-2032)
- Figure 9: Global Structural Health Monitoring Market Market Revenue (US$ Mn) Comparison by Type (2016-2032)
- Figure 10: Global Structural Health Monitoring Market Market Revenue (US$ Mn) Comparison by Application (2016-2032)
- Figure 11: Global Structural Health Monitoring Market Market Y-o-Y Growth Rate Comparison by Region (2016-2032)
- Figure 12: Global Structural Health Monitoring Market Market Y-o-Y Growth Rate Comparison by Type (2016-2032)
- Figure 13: Global Structural Health Monitoring Market Market Y-o-Y Growth Rate Comparison by Application (2016-2032)
- Figure 14: Global Structural Health Monitoring Market Market Share Comparison by Region (2016-2032)
- Figure 15: Global Structural Health Monitoring Market Market Share Comparison by Type (2016-2032)
- Figure 16: Global Structural Health Monitoring Market Market Share Comparison by Application (2016-2032)
- Figure 17: North America Structural Health Monitoring Market Revenue (US$ Mn) Market Share by Typein 2022
- Figure 18: North America Structural Health Monitoring Market Market Attractiveness Analysis by Type, 2016-2032
- Figure 19: North America Structural Health Monitoring Market Revenue (US$ Mn) Market Share by Applicationin 2022
- Figure 20: North America Structural Health Monitoring Market Market Attractiveness Analysis by Application, 2016-2032
- Figure 21: North America Structural Health Monitoring Market Revenue (US$ Mn) Market Share by Country in 2022
- Figure 22: North America Structural Health Monitoring Market Market Attractiveness Analysis by Country, 2016-2032
- Figure 23: North America Structural Health Monitoring Market Market Revenue (US$ Mn) (2016-2032)
- Figure 24: North America Structural Health Monitoring Market Market Revenue (US$ Mn) Comparison by Country (2016-2032)
- Figure 25: North America Structural Health Monitoring Market Market Revenue (US$ Mn) Comparison by Type (2016-2032)
- Figure 26: North America Structural Health Monitoring Market Market Revenue (US$ Mn) Comparison by Application (2016-2032)
- Figure 27: North America Structural Health Monitoring Market Market Y-o-Y Growth Rate Comparison by Country (2016-2032)
- Figure 28: North America Structural Health Monitoring Market Market Y-o-Y Growth Rate Comparison by Type (2016-2032)
- Figure 29: North America Structural Health Monitoring Market Market Y-o-Y Growth Rate Comparison by Application (2016-2032)
- Figure 30: North America Structural Health Monitoring Market Market Share Comparison by Country (2016-2032)
- Figure 31: North America Structural Health Monitoring Market Market Share Comparison by Type (2016-2032)
- Figure 32: North America Structural Health Monitoring Market Market Share Comparison by Application (2016-2032)
- Figure 33: Western Europe Structural Health Monitoring Market Revenue (US$ Mn) Market Share by Typein 2022
- Figure 34: Western Europe Structural Health Monitoring Market Market Attractiveness Analysis by Type, 2016-2032
- Figure 35: Western Europe Structural Health Monitoring Market Revenue (US$ Mn) Market Share by Applicationin 2022
- Figure 36: Western Europe Structural Health Monitoring Market Market Attractiveness Analysis by Application, 2016-2032
- Figure 37: Western Europe Structural Health Monitoring Market Revenue (US$ Mn) Market Share by Country in 2022
- Figure 38: Western Europe Structural Health Monitoring Market Market Attractiveness Analysis by Country, 2016-2032
- Figure 39: Western Europe Structural Health Monitoring Market Market Revenue (US$ Mn) (2016-2032)
- Figure 40: Western Europe Structural Health Monitoring Market Market Revenue (US$ Mn) Comparison by Country (2016-2032)
- Figure 41: Western Europe Structural Health Monitoring Market Market Revenue (US$ Mn) Comparison by Type (2016-2032)
- Figure 42: Western Europe Structural Health Monitoring Market Market Revenue (US$ Mn) Comparison by Application (2016-2032)
- Figure 43: Western Europe Structural Health Monitoring Market Market Y-o-Y Growth Rate Comparison by Country (2016-2032)
- Figure 44: Western Europe Structural Health Monitoring Market Market Y-o-Y Growth Rate Comparison by Type (2016-2032)
- Figure 45: Western Europe Structural Health Monitoring Market Market Y-o-Y Growth Rate Comparison by Application (2016-2032)
- Figure 46: Western Europe Structural Health Monitoring Market Market Share Comparison by Country (2016-2032)
- Figure 47: Western Europe Structural Health Monitoring Market Market Share Comparison by Type (2016-2032)
- Figure 48: Western Europe Structural Health Monitoring Market Market Share Comparison by Application (2016-2032)
- Figure 49: Eastern Europe Structural Health Monitoring Market Revenue (US$ Mn) Market Share by Typein 2022
- Figure 50: Eastern Europe Structural Health Monitoring Market Market Attractiveness Analysis by Type, 2016-2032
- Figure 51: Eastern Europe Structural Health Monitoring Market Revenue (US$ Mn) Market Share by Applicationin 2022
- Figure 52: Eastern Europe Structural Health Monitoring Market Market Attractiveness Analysis by Application, 2016-2032
- Figure 53: Eastern Europe Structural Health Monitoring Market Revenue (US$ Mn) Market Share by Country in 2022
- Figure 54: Eastern Europe Structural Health Monitoring Market Market Attractiveness Analysis by Country, 2016-2032
- Figure 55: Eastern Europe Structural Health Monitoring Market Market Revenue (US$ Mn) (2016-2032)
- Figure 56: Eastern Europe Structural Health Monitoring Market Market Revenue (US$ Mn) Comparison by Country (2016-2032)
- Figure 57: Eastern Europe Structural Health Monitoring Market Market Revenue (US$ Mn) Comparison by Type (2016-2032)
- Figure 58: Eastern Europe Structural Health Monitoring Market Market Revenue (US$ Mn) Comparison by Application (2016-2032)
- Figure 59: Eastern Europe Structural Health Monitoring Market Market Y-o-Y Growth Rate Comparison by Country (2016-2032)
- Figure 60: Eastern Europe Structural Health Monitoring Market Market Y-o-Y Growth Rate Comparison by Type (2016-2032)
- Figure 61: Eastern Europe Structural Health Monitoring Market Market Y-o-Y Growth Rate Comparison by Application (2016-2032)
- Figure 62: Eastern Europe Structural Health Monitoring Market Market Share Comparison by Country (2016-2032)
- Figure 63: Eastern Europe Structural Health Monitoring Market Market Share Comparison by Type (2016-2032)
- Figure 64: Eastern Europe Structural Health Monitoring Market Market Share Comparison by Application (2016-2032)
- Figure 65: APAC Structural Health Monitoring Market Revenue (US$ Mn) Market Share by Typein 2022
- Figure 66: APAC Structural Health Monitoring Market Market Attractiveness Analysis by Type, 2016-2032
- Figure 67: APAC Structural Health Monitoring Market Revenue (US$ Mn) Market Share by Applicationin 2022
- Figure 68: APAC Structural Health Monitoring Market Market Attractiveness Analysis by Application, 2016-2032
- Figure 69: APAC Structural Health Monitoring Market Revenue (US$ Mn) Market Share by Country in 2022
- Figure 70: APAC Structural Health Monitoring Market Market Attractiveness Analysis by Country, 2016-2032
- Figure 71: APAC Structural Health Monitoring Market Market Revenue (US$ Mn) (2016-2032)
- Figure 72: APAC Structural Health Monitoring Market Market Revenue (US$ Mn) Comparison by Country (2016-2032)
- Figure 73: APAC Structural Health Monitoring Market Market Revenue (US$ Mn) Comparison by Type (2016-2032)
- Figure 74: APAC Structural Health Monitoring Market Market Revenue (US$ Mn) Comparison by Application (2016-2032)
- Figure 75: APAC Structural Health Monitoring Market Market Y-o-Y Growth Rate Comparison by Country (2016-2032)
- Figure 76: APAC Structural Health Monitoring Market Market Y-o-Y Growth Rate Comparison by Type (2016-2032)
- Figure 77: APAC Structural Health Monitoring Market Market Y-o-Y Growth Rate Comparison by Application (2016-2032)
- Figure 78: APAC Structural Health Monitoring Market Market Share Comparison by Country (2016-2032)
- Figure 79: APAC Structural Health Monitoring Market Market Share Comparison by Type (2016-2032)
- Figure 80: APAC Structural Health Monitoring Market Market Share Comparison by Application (2016-2032)
- Figure 81: Latin America Structural Health Monitoring Market Revenue (US$ Mn) Market Share by Typein 2022
- Figure 82: Latin America Structural Health Monitoring Market Market Attractiveness Analysis by Type, 2016-2032
- Figure 83: Latin America Structural Health Monitoring Market Revenue (US$ Mn) Market Share by Applicationin 2022
- Figure 84: Latin America Structural Health Monitoring Market Market Attractiveness Analysis by Application, 2016-2032
- Figure 85: Latin America Structural Health Monitoring Market Revenue (US$ Mn) Market Share by Country in 2022
- Figure 86: Latin America Structural Health Monitoring Market Market Attractiveness Analysis by Country, 2016-2032
- Figure 87: Latin America Structural Health Monitoring Market Market Revenue (US$ Mn) (2016-2032)
- Figure 88: Latin America Structural Health Monitoring Market Market Revenue (US$ Mn) Comparison by Country (2016-2032)
- Figure 89: Latin America Structural Health Monitoring Market Market Revenue (US$ Mn) Comparison by Type (2016-2032)
- Figure 90: Latin America Structural Health Monitoring Market Market Revenue (US$ Mn) Comparison by Application (2016-2032)
- Figure 91: Latin America Structural Health Monitoring Market Market Y-o-Y Growth Rate Comparison by Country (2016-2032)
- Figure 92: Latin America Structural Health Monitoring Market Market Y-o-Y Growth Rate Comparison by Type (2016-2032)
- Figure 93: Latin America Structural Health Monitoring Market Market Y-o-Y Growth Rate Comparison by Application (2016-2032)
- Figure 94: Latin America Structural Health Monitoring Market Market Share Comparison by Country (2016-2032)
- Figure 95: Latin America Structural Health Monitoring Market Market Share Comparison by Type (2016-2032)
- Figure 96: Latin America Structural Health Monitoring Market Market Share Comparison by Application (2016-2032)
- Figure 97: Middle East & Africa Structural Health Monitoring Market Revenue (US$ Mn) Market Share by Typein 2022
- Figure 98: Middle East & Africa Structural Health Monitoring Market Market Attractiveness Analysis by Type, 2016-2032
- Figure 99: Middle East & Africa Structural Health Monitoring Market Revenue (US$ Mn) Market Share by Applicationin 2022
- Figure 100: Middle East & Africa Structural Health Monitoring Market Market Attractiveness Analysis by Application, 2016-2032
- Figure 101: Middle East & Africa Structural Health Monitoring Market Revenue (US$ Mn) Market Share by Country in 2022
- Figure 102: Middle East & Africa Structural Health Monitoring Market Market Attractiveness Analysis by Country, 2016-2032
- Figure 103: Middle East & Africa Structural Health Monitoring Market Market Revenue (US$ Mn) (2016-2032)
- Figure 104: Middle East & Africa Structural Health Monitoring Market Market Revenue (US$ Mn) Comparison by Country (2016-2032)
- Figure 105: Middle East & Africa Structural Health Monitoring Market Market Revenue (US$ Mn) Comparison by Type (2016-2032)
- Figure 106: Middle East & Africa Structural Health Monitoring Market Market Revenue (US$ Mn) Comparison by Application (2016-2032)
- Figure 107: Middle East & Africa Structural Health Monitoring Market Market Y-o-Y Growth Rate Comparison by Country (2016-2032)
- Figure 108: Middle East & Africa Structural Health Monitoring Market Market Y-o-Y Growth Rate Comparison by Type (2016-2032)
- Figure 109: Middle East & Africa Structural Health Monitoring Market Market Y-o-Y Growth Rate Comparison by Application (2016-2032)
- Figure 110: Middle East & Africa Structural Health Monitoring Market Market Share Comparison by Country (2016-2032)
- Figure 111: Middle East & Africa Structural Health Monitoring Market Market Share Comparison by Type (2016-2032)
- Figure 112: Middle East & Africa Structural Health Monitoring Market Market Share Comparison by Application (2016-2032)
"
- List of Tables
- "
- Table 1: Global Structural Health Monitoring Market Market Comparison by Type (2016-2032)
- Table 2: Global Structural Health Monitoring Market Market Comparison by Application (2016-2032)
- Table 3: Global Structural Health Monitoring Market Revenue (US$ Mn) Comparison by Region (2016-2032)
- Table 4: Global Structural Health Monitoring Market Market Revenue (US$ Mn) (2016-2032)
- Table 5: Global Structural Health Monitoring Market Market Revenue (US$ Mn) Comparison by Region (2016-2032)
- Table 6: Global Structural Health Monitoring Market Market Revenue (US$ Mn) Comparison by Type (2016-2032)
- Table 7: Global Structural Health Monitoring Market Market Revenue (US$ Mn) Comparison by Application (2016-2032)
- Table 8: Global Structural Health Monitoring Market Market Y-o-Y Growth Rate Comparison by Region (2016-2032)
- Table 9: Global Structural Health Monitoring Market Market Y-o-Y Growth Rate Comparison by Type (2016-2032)
- Table 10: Global Structural Health Monitoring Market Market Y-o-Y Growth Rate Comparison by Application (2016-2032)
- Table 11: Global Structural Health Monitoring Market Market Share Comparison by Region (2016-2032)
- Table 12: Global Structural Health Monitoring Market Market Share Comparison by Type (2016-2032)
- Table 13: Global Structural Health Monitoring Market Market Share Comparison by Application (2016-2032)
- Table 14: North America Structural Health Monitoring Market Market Comparison by Application (2016-2032)
- Table 15: North America Structural Health Monitoring Market Revenue (US$ Mn) Comparison by Country (2016-2032)
- Table 16: North America Structural Health Monitoring Market Market Revenue (US$ Mn) (2016-2032)
- Table 17: North America Structural Health Monitoring Market Market Revenue (US$ Mn) Comparison by Country (2016-2032)
- Table 18: North America Structural Health Monitoring Market Market Revenue (US$ Mn) Comparison by Type (2016-2032)
- Table 19: North America Structural Health Monitoring Market Market Revenue (US$ Mn) Comparison by Application (2016-2032)
- Table 20: North America Structural Health Monitoring Market Market Y-o-Y Growth Rate Comparison by Country (2016-2032)
- Table 21: North America Structural Health Monitoring Market Market Y-o-Y Growth Rate Comparison by Type (2016-2032)
- Table 22: North America Structural Health Monitoring Market Market Y-o-Y Growth Rate Comparison by Application (2016-2032)
- Table 23: North America Structural Health Monitoring Market Market Share Comparison by Country (2016-2032)
- Table 24: North America Structural Health Monitoring Market Market Share Comparison by Type (2016-2032)
- Table 25: North America Structural Health Monitoring Market Market Share Comparison by Application (2016-2032)
- Table 26: Western Europe Structural Health Monitoring Market Market Comparison by Type (2016-2032)
- Table 27: Western Europe Structural Health Monitoring Market Market Comparison by Application (2016-2032)
- Table 28: Western Europe Structural Health Monitoring Market Revenue (US$ Mn) Comparison by Country (2016-2032)
- Table 29: Western Europe Structural Health Monitoring Market Market Revenue (US$ Mn) (2016-2032)
- Table 30: Western Europe Structural Health Monitoring Market Market Revenue (US$ Mn) Comparison by Country (2016-2032)
- Table 31: Western Europe Structural Health Monitoring Market Market Revenue (US$ Mn) Comparison by Type (2016-2032)
- Table 32: Western Europe Structural Health Monitoring Market Market Revenue (US$ Mn) Comparison by Application (2016-2032)
- Table 33: Western Europe Structural Health Monitoring Market Market Y-o-Y Growth Rate Comparison by Country (2016-2032)
- Table 34: Western Europe Structural Health Monitoring Market Market Y-o-Y Growth Rate Comparison by Type (2016-2032)
- Table 35: Western Europe Structural Health Monitoring Market Market Y-o-Y Growth Rate Comparison by Application (2016-2032)
- Table 36: Western Europe Structural Health Monitoring Market Market Share Comparison by Country (2016-2032)
- Table 37: Western Europe Structural Health Monitoring Market Market Share Comparison by Type (2016-2032)
- Table 38: Western Europe Structural Health Monitoring Market Market Share Comparison by Application (2016-2032)
- Table 39: Eastern Europe Structural Health Monitoring Market Market Comparison by Type (2016-2032)
- Table 40: Eastern Europe Structural Health Monitoring Market Market Comparison by Application (2016-2032)
- Table 41: Eastern Europe Structural Health Monitoring Market Revenue (US$ Mn) Comparison by Country (2016-2032)
- Table 42: Eastern Europe Structural Health Monitoring Market Market Revenue (US$ Mn) (2016-2032)
- Table 43: Eastern Europe Structural Health Monitoring Market Market Revenue (US$ Mn) Comparison by Country (2016-2032)
- Table 44: Eastern Europe Structural Health Monitoring Market Market Revenue (US$ Mn) Comparison by Type (2016-2032)
- Table 45: Eastern Europe Structural Health Monitoring Market Market Revenue (US$ Mn) Comparison by Application (2016-2032)
- Table 46: Eastern Europe Structural Health Monitoring Market Market Y-o-Y Growth Rate Comparison by Country (2016-2032)
- Table 47: Eastern Europe Structural Health Monitoring Market Market Y-o-Y Growth Rate Comparison by Type (2016-2032)
- Table 48: Eastern Europe Structural Health Monitoring Market Market Y-o-Y Growth Rate Comparison by Application (2016-2032)
- Table 49: Eastern Europe Structural Health Monitoring Market Market Share Comparison by Country (2016-2032)
- Table 50: Eastern Europe Structural Health Monitoring Market Market Share Comparison by Type (2016-2032)
- Table 51: Eastern Europe Structural Health Monitoring Market Market Share Comparison by Application (2016-2032)
- Table 52: APAC Structural Health Monitoring Market Market Comparison by Type (2016-2032)
- Table 53: APAC Structural Health Monitoring Market Market Comparison by Application (2016-2032)
- Table 54: APAC Structural Health Monitoring Market Revenue (US$ Mn) Comparison by Country (2016-2032)
- Table 55: APAC Structural Health Monitoring Market Market Revenue (US$ Mn) (2016-2032)
- Table 56: APAC Structural Health Monitoring Market Market Revenue (US$ Mn) Comparison by Country (2016-2032)
- Table 57: APAC Structural Health Monitoring Market Market Revenue (US$ Mn) Comparison by Type (2016-2032)
- Table 58: APAC Structural Health Monitoring Market Market Revenue (US$ Mn) Comparison by Application (2016-2032)
- Table 59: APAC Structural Health Monitoring Market Market Y-o-Y Growth Rate Comparison by Country (2016-2032)
- Table 60: APAC Structural Health Monitoring Market Market Y-o-Y Growth Rate Comparison by Type (2016-2032)
- Table 61: APAC Structural Health Monitoring Market Market Y-o-Y Growth Rate Comparison by Application (2016-2032)
- Table 62: APAC Structural Health Monitoring Market Market Share Comparison by Country (2016-2032)
- Table 63: APAC Structural Health Monitoring Market Market Share Comparison by Type (2016-2032)
- Table 64: APAC Structural Health Monitoring Market Market Share Comparison by Application (2016-2032)
- Table 65: Latin America Structural Health Monitoring Market Market Comparison by Type (2016-2032)
- Table 66: Latin America Structural Health Monitoring Market Market Comparison by Application (2016-2032)
- Table 67: Latin America Structural Health Monitoring Market Revenue (US$ Mn) Comparison by Country (2016-2032)
- Table 68: Latin America Structural Health Monitoring Market Market Revenue (US$ Mn) (2016-2032)
- Table 69: Latin America Structural Health Monitoring Market Market Revenue (US$ Mn) Comparison by Country (2016-2032)
- Table 70: Latin America Structural Health Monitoring Market Market Revenue (US$ Mn) Comparison by Type (2016-2032)
- Table 71: Latin America Structural Health Monitoring Market Market Revenue (US$ Mn) Comparison by Application (2016-2032)
- Table 72: Latin America Structural Health Monitoring Market Market Y-o-Y Growth Rate Comparison by Country (2016-2032)
- Table 73: Latin America Structural Health Monitoring Market Market Y-o-Y Growth Rate Comparison by Type (2016-2032)
- Table 74: Latin America Structural Health Monitoring Market Market Y-o-Y Growth Rate Comparison by Application (2016-2032)
- Table 75: Latin America Structural Health Monitoring Market Market Share Comparison by Country (2016-2032)
- Table 76: Latin America Structural Health Monitoring Market Market Share Comparison by Type (2016-2032)
- Table 77: Latin America Structural Health Monitoring Market Market Share Comparison by Application (2016-2032)
- Table 78: Middle East & Africa Structural Health Monitoring Market Market Comparison by Type (2016-2032)
- Table 79: Middle East & Africa Structural Health Monitoring Market Market Comparison by Application (2016-2032)
- Table 80: Middle East & Africa Structural Health Monitoring Market Revenue (US$ Mn) Comparison by Country (2016-2032)
- Table 81: Middle East & Africa Structural Health Monitoring Market Market Revenue (US$ Mn) (2016-2032)
- Table 82: Middle East & Africa Structural Health Monitoring Market Market Revenue (US$ Mn) Comparison by Country (2016-2032)
- Table 83: Middle East & Africa Structural Health Monitoring Market Market Revenue (US$ Mn) Comparison by Type (2016-2032)
- Table 84: Middle East & Africa Structural Health Monitoring Market Market Revenue (US$ Mn) Comparison by Application (2016-2032)
- Table 85: Middle East & Africa Structural Health Monitoring Market Market Y-o-Y Growth Rate Comparison by Country (2016-2032)
- Table 86: Middle East & Africa Structural Health Monitoring Market Market Y-o-Y Growth Rate Comparison by Type (2016-2032)
- Table 87: Middle East & Africa Structural Health Monitoring Market Market Y-o-Y Growth Rate Comparison by Application (2016-2032)
- Table 88: Middle East & Africa Structural Health Monitoring Market Market Share Comparison by Country (2016-2032)
- Table 89: Middle East & Africa Structural Health Monitoring Market Market Share Comparison by Type (2016-2032)
- Table 90: Middle East & Africa Structural Health Monitoring Market Market Share Comparison by Application (2016-2032)
- 1. Executive Summary
-
Pneumatic Product Aeroex MECS Koch-Glitsch Geovent FABCO-AIR Met-Pro Environmental Air Solutions Coastal Technologies, Inc. AMACS Munters Boegger Industrial Limited Ningbo T.C.I Co., Ltd Industrial Maid Champion Mikropor Sulzer
Our Clients


View Our Licence Options
