
Dehydrated Food Market By Type(Spray-dried, Freeze-dried, Other), By Application(Supermarket, Hypermarket, Other), By Product Type(Dehydrated Meat and Seafood, Dehydrated Fruits, Others), By End-User(Individuals, Foodservice Establishments), By Region And Companies - Industry Segment Outlook, Market Assessment, Competition Scenario, Trends, And Forecast 2023-2032
-
12425
-
Nov 2023
-
167
-


-
This report was compiled by Shreyas Rokade Shreyas Rokade is a seasoned Research Analyst with CMFE, bringing extensive expertise in market research and consulting, with a strong background in Chemical Engineering. Correspondence Team Lead-CMFE Linkedin | Detailed Market research Methodology Our methodology involves a mix of primary research, including interviews with leading mental health experts, and secondary research from reputable medical journals and databases. View Detailed Methodology Page
-
Quick Navigation
Report Overview
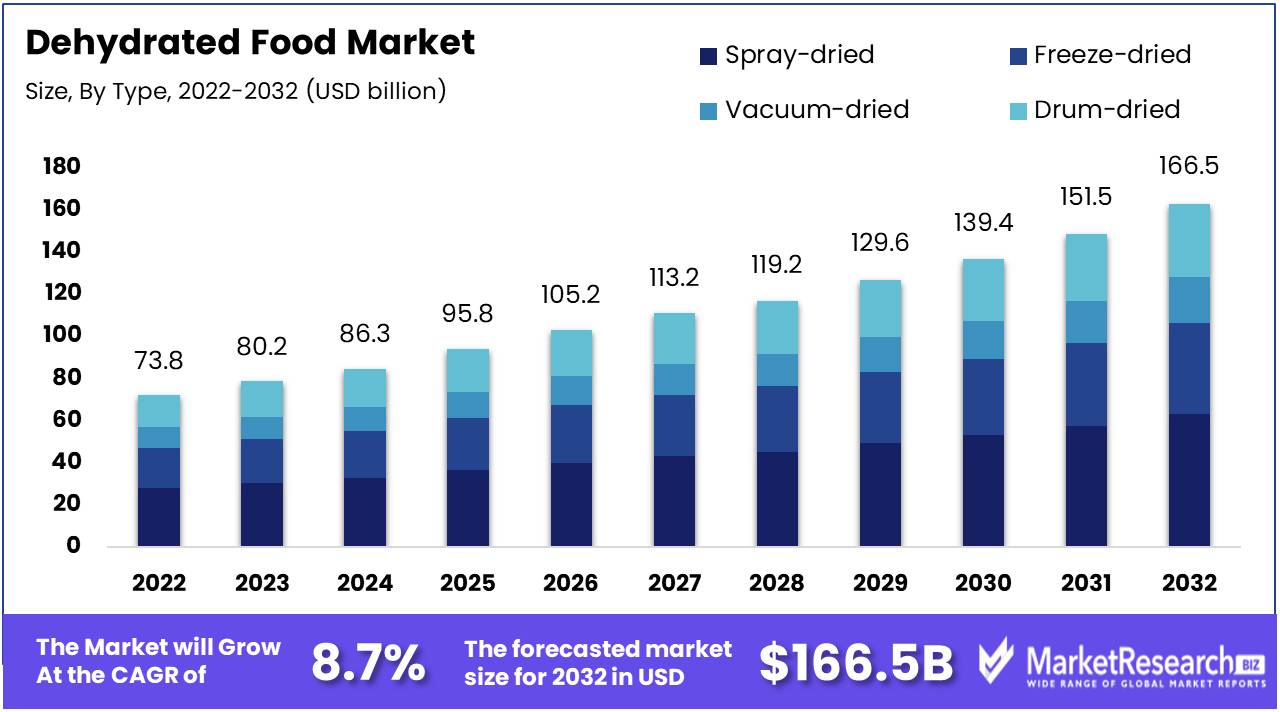
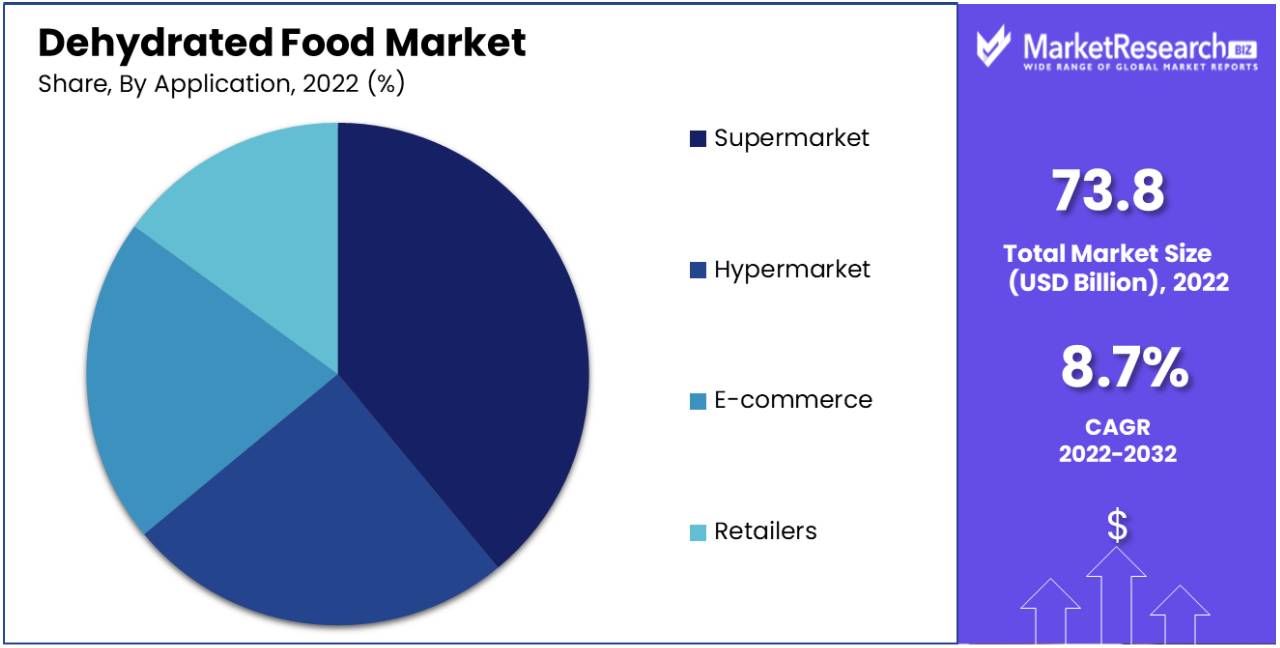
The Dehydrated Food Market size is expected to be worth around USD 166.5 Bn by 2032 from USD 73.8 Bn in 2022, growing at a CAGR of 8.7% during the forecast period from 2023 to 2032. Consumers are seeking to have a good amount of protein content in their diet which can maintain their immunity.
This has resulted in the rise of the sales of frozen dried meat products, dairy food items, and other food items that can be preserved for a longer duration of time with the same nutrients as fresh food items. The freeze-drying technology used for heat-sensitive food products, the demand for frozen dried pet foods, and the new freeze-drying methods into several food items for longer duration preservation and easy food consumption are some of the main driving factors for the dehydrated food market expansion.
As customer preferences are changing and most of them are opting for vegan and organic freeze-dried products. The main reason behind the customer change in preference is due to the benefit of freeze-dried products that it offers such as it can be kept for a longer period and can be purchased in larger volumes to avoid physical visits to the shops. These kinds of food items are easy to cook and will provide the same nutrition.
With the rise in the number of travelers and tourism, camping, hiking, and other activities have surged the demand for packaged and processed foods that are produced with the help of dehydrating methods.
Furthermore, the rise in demand for the easy accessibility of processed and packaged food products among manufacturers will help to gain more potential chances for the market growth of dehydrated foods in the coming years.
The distribution in the supply for raw material production and transportation might also increase. The manufacturers get involved in various types of tactical distribution methods to make sure that the items reach the end user efficiently. In the retail industry, dehydrated food items are distributed through different channels such as the traditional and online platform channels.
For example, many retail chains, grocery shops, supermarkets, and hypermarkets have many types of dehydrated food products such as fruits, vegetables, instant noodles, and meats. Furthermore, the ecommerce platform will provide direct-to-consumer distribution services of dehydrated foods which allows the customers to buy these items from anywhere. Such type of adaptability in distribution concerning the customer preference for easy convenience helps in the market growth of the dehydrated market in the broader food industries.
Driving factors
Extended Shelf Life Boosts Dehydrated Food Market Growth
The longer shelf life of dehydrated food compared to fresh alternatives is a key driver for the growth of the dehydrated food market. Dehydrated foods' resistance to spoilage makes them ideal for long-term storage, reducing the frequency of food purchases and minimizing waste. This factor is particularly appealing in areas with limited access to fresh produce or during emergency preparedness, where long-lasting food supplies are crucial.
The extended shelf life also benefits retailers and distributors by reducing the risk of unsold inventory due to spoilage. In the long term, this aspect of dehydrated foods is likely to remain a fundamental market driver, especially as global supply chain challenges persist and consumer focus on sustainability and waste reduction intensifies.
Nutrient Retention in Dehydrated Foods Spurs Market Growth
The retention of many essential nutrients in dehydrated foods contributes to their popularity and market growth. Unlike some forms of food processing, dehydration preserves a significant amount of the nutritional value of the original produce. This quality makes dehydrated foods a nutritious option for meals and snacks, appealing to health-conscious consumers.
As awareness of healthy eating rises, so too has demand for nutritious yet convenient food options. Dehydrated fruits, vegetables, and meats provide the optimal combination of convenience and health, making them a top pick among consumers who wish to maintain a nutritious diet without compromising ease of use. As consumer focus remains on nutrition over ease of use, this should drive continued market expansion for dehydrated food products.
Cost-Effectiveness of Home Food Dehydration Boosts Market
Dehydrating food at home is emerging as a cost-effective way to preserve food, driving market growth for home dehydration equipment and supplies. This practice appeals to consumers looking to reduce food waste and save money by extending the shelf life of produce. The initial investment in a dehydrator is often offset by the savings from less food waste and the ability to buy in bulk and preserve.
This trend is part of an emerging movement towards self-sufficiency and sustainable living, as more consumers adopt home food preservation methods. As more dehydrating equipment sales increase with this growing consumer trend, manufacturing companies and retailers should see opportunities within this space.
Convenience of Packaged Dehydrated Foods Propels Market
The convenience of packaged dehydrated foods, particularly snacks, has played a significant role in their growth as market staples. Dehydrated snacks are lightweight, portable, and non-perishable - ideal for travel, hiking, and on-the-go consumption - leading to their increased popularity with consumers looking for quick, healthy options that are easy to transport.
Packaged dehydrated snacks fit well within the fast-paced lifestyle of modern consumers, who often prioritize convenience and time-saving options. The increasing popularity of outdoor activities and travel is likely to continue fueling the demand for convenient, travel-friendly dehydrated foods.
Restraining Factors
Limited Availability of Raw Materials Restrains Dehydrated Food Market Growth
The growth of the dehydrated food market is constrained by the limited availability of quality raw materials. Sourcing fresh, high-quality produce is crucial for the production of dehydrated food products. Factors such as agricultural yield variations, supply chain disruptions, and competition for these raw materials from other food sectors can lead to shortages and increased costs. This limitation can affect the consistency and volume of dehydrated food production, impacting the market's ability to meet rising consumer demand and maintain product quality.
Health Concerns Over High Sodium Content Restrains Dehydrated Food Market Growth
Health concerns over the high sodium content in some dehydrated food products impede market expansion significantly. Consumers are becoming more conscious of how consuming too much salt increases the risk for hypertension and cardiovascular diseases, prompting an increased preference for lower sodium and healthier options - meaning dehydrated products, which may contain preservatives and sodium, face resistance from customers thus diminishing market demand and growth potential.
Dependence on Weather Conditions for Raw Material Production Restrains Market Growth
The dehydrated food market heavily depends on weather conditions for the production of raw materials. Adverse weather events like droughts, floods, or unseasonal temperatures can drastically affect agricultural yields, leading to inconsistencies in the supply and quality of raw materials. This dependence makes the market vulnerable to climate variability and can result in fluctuations in production volume and cost, posing significant challenges to maintaining market stability and growth.
Segmentation Analysis of Dehydrated Food Market
By Type Analysis
Spray drying leads the dehydration methods due to its efficiency and cost-effectiveness in producing large quantities of dehydrated food. It's extensively used in the dairy, coffee, and flavorings sectors. The technology allows for the rapid drying of liquid into powder form, preserving the flavor and nutritional value while extending shelf life. The widespread application in various food industries, coupled with the development of advanced spray-drying techniques, bolsters this segment's dominance.
Freeze-dried products are valued for their quality and nutrient retention, often used in fruits and high-end products. Vacuum drying is utilized for heat-sensitive products. Drum drying, though less efficient than spray drying, is used for specific applications requiring a flaky, dry product. Each method serves particular market niches based on product requirements.
By Application Analysis
Supermarkets are the principal distribution channel for dehydrated foods, offering a broad range of products under one roof. The convenience, accessibility, and variety of products available in supermarkets drive consumer preference and market dominance.
Hypermarkets provide similar benefits to supermarkets on a larger scale, while e-commerce is rapidly growing thanks to convenient shopping at home and home delivery services. Retailers including specialty stores cater to niche markets and consumer preferences.
By Product Type Analysis
Dehydrated meat and seafood hold a significant market share, driven by the demand for convenient, long-lasting protein sources. This segment is favored in the camping, military, and emergency food supplies sectors. The growth is also supported by the rising popularity of snackable meat products like jerky.
Dehydrated fruits and dehydrated vegetable sectors are popular for their extended shelf life and concentrated flavor. Ready-to-eat food caters to the demand for convenient, quick meal solutions. Other dehydrated products include herbs, spices, and bakery ingredients.
By End-User Analysis
Individual consumers are the main end-users of dehydrated foods, driven by the demand for convenient, non-perishable food options. The appeal to outdoor enthusiasts, busy households, and those seeking emergency food supplies contributes to this segment's growth.
Food service establishments, including restaurants, cafes, and catering services, utilize dehydrated foods for their convenience, consistency, and storage benefits. This sector is significant for bulk and specialty dehydrated products.
The dehydrated food market is characterized by the prevalence of spray-dried products due to their widespread application and cost-efficiency. Supermarkets are the leading distribution channel, offering accessibility and a diverse product range to consumers. Dehydrated meat and processed seafood products dominate the product type segment, catering to the demand for long-lasting, convenient protein sources. Individual consumers are the primary end-users, driven by the need for convenient and shelf-stable food options. The market is supported by ongoing technological advancements in dehydration methods and the growing consumer preference for convenience and extended shelf life in food products.
Key Market Segments
By Type
- Spray-dried
- Freeze-dried
- Vacuum-dried
- Drum-dried
By Application
- Supermarket
- Hypermarket
- E-commerce
- Retailers
By Product Type
- Dehydrated Meat and Seafood
- Dehydrated Fruits
- Dehydrated Vegetables
- Dehydrated Ready-to-Eat Meals, and Others
By End-User
- Individuals
- Foodservice Establishments
Growth Opportunity
Increasing Demand for Dehydrated Vegetables from Snack Food Manufacturers Fuels Market Growth in Dehydrated Food Industry
The surging demand for dehydrated vegetables from snack food manufacturers presents substantial growth opportunities in the dehydrated food market. Snack foods infused with dehydrated vegetables are gaining popularity due to their convenience and perceived health benefits. Consumers are increasingly seeking nutritious snack options, and dehydrated vegetables meet this demand. Manufacturers catering to this trend by incorporating dehydrated vegetables into their products are well-positioned for growth. This trend also drives innovation and diversification in the dehydrated food sector, contributing to overall market expansion.
Dehydrated Vegetables Are Cheap, Convenient, and Wholesome Drives Market Expansion
The affordability, convenience, and nutritional value of dehydrated vegetables drive market expansion in the dehydrated food industry. Dehydrated vegetables offer consumers an economical and convenient way to access nutritious produce. As busy lifestyles and health-conscious choices continue to influence consumer behavior, dehydrated vegetables align with these preferences. Manufacturers that emphasize the affordability and wholesomeness of their dehydrated vegetable products are well-positioned to capitalize on this demand, contributing to market growth by providing accessible and nutritious options. A major factor in the dehydrated food market is the dehydration process, crucial for producing nutritional products, as per industry analysis.
Regional Analysis
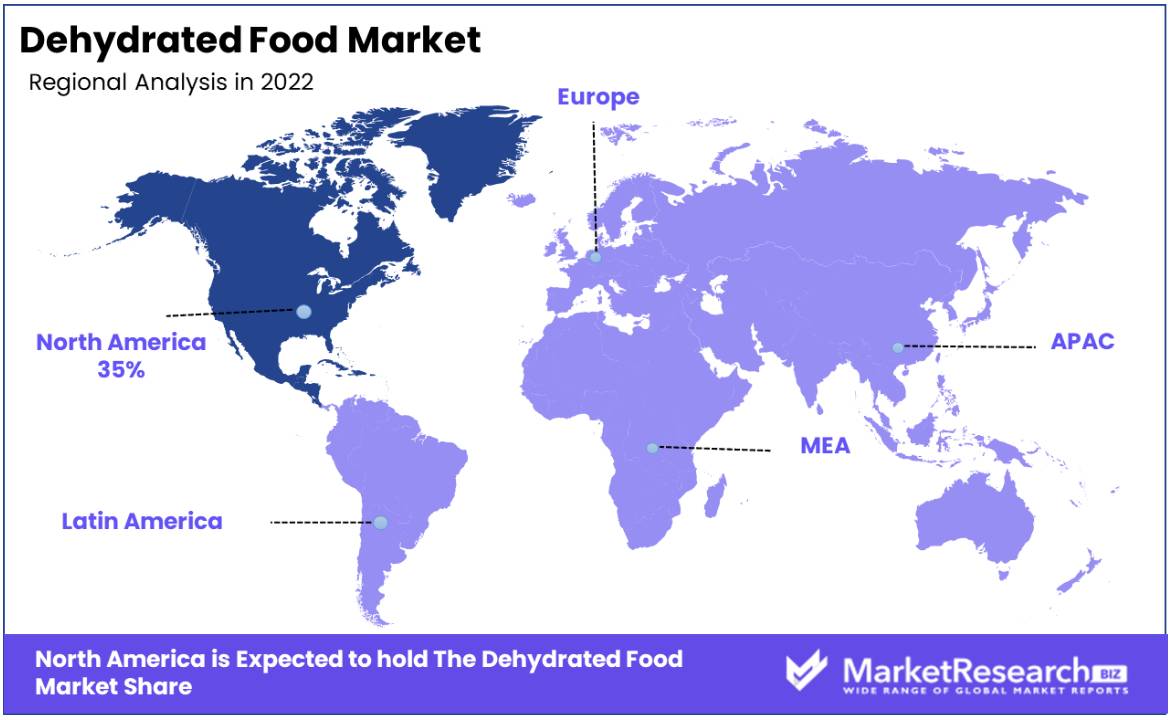
North America:
North America holds an estimated 35% market share for dehydrated food sales worldwide. This dominance can be attributed to North America's culture of convenience and on-the-go eating habits; other key contributors include high demand for simple-to-prepare food products among a time-pressed population, plus its well-established food processing industry and cutting-edge dehydration technology that is an integral part of daily life in this part of the world.
North American market dynamics are dictated by an increase in consumer preference for healthy, shelf-stable foods that meet their lifestyle needs. Furthermore, major companies that invest heavily in R&D to expand their dehydrated food product lines further bolster this sector of the market.
Forecast predictions project that North America will remain at the forefront of the dehydrated food market. Rising awareness about sustainable practices combined with an ongoing desire for convenient and nutritious options should drive its expansion. Furthermore, outdoor activities like camping and hiking may increase demand for portable dehydrated products.
Europe:
Europe's dehydrated food market is expanding at an impressive rate, thanks to increased regional focus on quality and an accelerating need for long-lasting convenient products. Europe benefits from established processing companies and an increasingly health-conscious consumer base that demands long-lasting foods without compromising health or taste.
The European market is likely to witness continued growth, fueled by rising health consciousness, busy lifestyles, and a growing interest in outdoor recreational activities where dehydrated foods are convenient.
Asia-Pacific:
Asia-Pacific region is witnessing rapid expansion in the dehydrated food market due to urbanization, rising disposable incomes, and an expanding working population. Furthermore, regional culinary traditions and an increase in the adoption of Western eating habits all play a significant role in this expansion.
Asia-Pacific market for dehydrated organic fruits and vegetables is projected to experience rapid expansion due to rising consumer demand for convenience foods as well as expansion in the processing industry. Asia's abundant agricultural output provides ample opportunity for producing dehydrated fruit and vegetables suitable for domestic as well as international markets.
Key Regions and Countries
North America
- The US
- Canada
- Rest of North America
Europe
- Germany
- France
- The UK
- Spain
- Italy
- Russia
- Netherlands
- Rest of Europe
Asia-Pacific
- China
- Japan
- South Korea
- India
- New Zealand
- Singapore
- Thailand
- Vietnam
- Rest of Asia Pacific
Latin America
- Brazil
- Mexico
- Rest of Latin America
Middle East & Africa
- South Africa
- Saudi Arabia
- UAE
- Rest of Middle East & Africa
Key Players Analysis
The dehydrated food market is characterized by a diverse array of companies, each contributing to the industry’s growth with unique strategic approaches. Van Drunen Farms and European Freeze Dry are at the forefront, known for their extensive product ranges and advanced freeze-drying technologies. Their market influence is significant, especially in providing ingredients to the processing industry.
Mercer Foods, LLC, and Harmony House Foods Inc. are recognized for their focus on high-quality dehydrated fruits and vegetables, catering to the growing consumer demand for healthy and convenient food options. Tong Garden Co. Ltd. and Crispy Green Inc. have established a strong market presence in the snack segment, leveraging the trend of healthy snacking.
Companies like Dried Processed Food, Dried Fruit and Vegetable, and Dried Dairy have diversified the market with a wide range of dehydrated demand for food products, from staple ingredients to specialty items. Their strategic positioning is pivotal in catering to both retail and industrial segments.
Dried Meat & Seafood, Mother Earth Products, and Green Rootz emphasize specialized offerings in their respective categories, focusing on quality and catering to niche markets. ITC Limited (India) and California Sun Dry Foods (U.S.) have a significant influence in regional markets with their strong brand presence and distribution networks.
BCFoods, Inc. (U.S.), Bella Sun Luci (U.S.), and Mondelez International, Inc. (U.S.) contribute to the market with their broad product portfolios and strong focus on consumer preferences. Sensient Technologies Corporation (U.S.) stands out for its technological innovations in flavor and ingredient solutions for the dehydrated food industry.
Collectively, these major players in the dehydrated food market through strategic initiatives focusing on product innovation, technological advancements, and adaptation to changing
Top Key Players in the Dehydrated Food Market
- Van Drunen Farms
- European Freeze Dry
- Mercer Foods, LLC
- Tong Garden Co. Ltd.
- Crispy Green Inc.
- Dried Processed Food
- Dried Fruit & Vegetable
- Dried Dairy
- Dried Meat & Seafood
- Harmony House Foods Inc.
- Mother Earth Products
- Green Rootz
- ITC Limited (India)
- California Sun Dry Foods (U.S.)
- BCFoods, Inc. (U.S.)
- Bella Sun Luci (U.S.)
- Mondelez International, Inc. (U.S.)
- Sensient Technologies Corporation (U.S.)
- Lion Raisins Inc.
- Viva Bella Orchards Inc.
- Sow Good Inc.
Recent Development
- In 2022, General Mills expanded its Food Should Taste Good brand of dried snacks with new organic vegetable chip varieties.
- In 2021, Nestle launched a range of dehydrated meat pieces and chunks under its Maggi brand for nutritious cooking.
- In 2020, Oregon Freeze Dry upgraded its production capabilities to meet the rising demand for freeze-dried ingredients and meals.
- In 2019, Kerry Group acquired Southeastern Mills' dehydrated vegetable business to expand its portfolio of food ingredients.
Report Scope
Report Features Description Market Value (2022) USD 73.8 Bn Forecast Revenue (2032) USD 166.5 Bn CAGR (2023-2032) 8.7% Base Year for Estimation 2022 Historic Period 2016-2022 Forecast Period 2023-2032 Report Coverage Revenue Forecast, Market Dynamics, COVID-19 Impact, Competitive Landscape, Recent Developments Segments Covered By Type(Spray-dried, Freeze-dried, Vacuum-dried, Drum-dried), By Application(Supermarket, Hypermarket, E-commerce, Retailers), By Product Type(Dehydrated Meat and Seafood, Dehydrated Fruits, Dehydrated Vegetables, Dehydrated Ready-to-Eat Meals, and Others), By End-User(Individuals, Foodservice Establishments) Regional Analysis North America - The US, Canada, Rest of North America, Europe - Germany, France, The UK, Spain, Italy, Russia, Netherlands, Rest of Europe, Asia-Pacific - China, Japan, South Korea, India, New Zealand, Singapore, Thailand, Vietnam, Rest of Asia Pacific, Latin America - Brazil, Mexico, Rest of Latin America, Middle East & Africa - South Africa, Saudi Arabia, UAE, Rest of Middle East & Africa Competitive Landscape Van Drunen Farms, European Freeze Dry, Mercer Foods, LLC, Crispy Green Inc., Dried Processed Food, Dried Fruit & Vegetable, Dried Dairy, Dried Meat & Seafood, Harmony House Foods Inc., Mother Earth Products, Green Rootz, ITC Limited (India), California Sun Dry Foods (U.S.), BCFoods, Inc. (U.S.), Mondelez International, Inc. (U.S.), Sensient Technologies Corporation (U.S.), Lion Raisins Inc., Viva Bella Orchards Inc. Customization Scope Customization for segments, region/country-level will be provided. Moreover, additional customization can be done based on the requirements. Purchase Options We have three licenses to opt for: Single User License, Multi-User License (Up to 5 Users), Corporate Use License (Unlimited User and Printable PDF) -
- 1. Executive Summary
- 1.1. Definition
- 1.2. Taxonomy
- 1.3. Research Scope
- 1.4. Key Analysis
- 1.5. Key Findings by Major Segments
- 1.6. Top strategies by Major Players
- 2. Global Dehydrated Food Market Overview
- 2.1. Dehydrated Food Market Dynamics
- 2.1.1. Drivers
- 2.1.2. Opportunities
- 2.1.3. Restraints
- 2.1.4. Challenges
- 2.2. Macro-economic Factors
- 2.3. Regulatory Framework
- 2.4. Market Investment Feasibility Index
- 2.5. PEST Analysis
- 2.6. PORTER’S Five Force Analysis
- 2.7. Drivers & Restraints Impact Analysis
- 2.8. Industry Chain Analysis
- 2.9. Cost Structure Analysis
- 2.10. Marketing Strategy
- 2.11. Russia-Ukraine War Impact Analysis
- 2.12. Opportunity Map Analysis
- 2.13. Market Competition Scenario Analysis
- 2.14. Product Life Cycle Analysis
- 2.15. Opportunity Orbits
- 2.16. Manufacturer Intensity Map
- 2.17. Major Companies sales by Value & Volume
- 2.1. Dehydrated Food Market Dynamics
- 3. Global Dehydrated Food Market Analysis, Opportunity and Forecast, 2016-2032
- 3.1. Global Dehydrated Food Market Analysis, 2016-2021
- 3.2. Global Dehydrated Food Market Opportunity and Forecast, 2023-2032
- 3.3. Global Dehydrated Food Market Analysis, Opportunity and Forecast, By Type , 2016-2032
- 3.3.1. Global Dehydrated Food Market Analysis by Type : Introduction
- 3.3.2. Market Size Absolute $ Opportunity Analysis and Forecast, By Type , 2016-2032
- 3.3.3. Spray-dried
- 3.3.4. Freeze-dried
- 3.3.5. Vacuum-dried
- 3.3.6. Drum-dried
- 3.4. Global Dehydrated Food Market Analysis, Opportunity and Forecast, By application, 2016-2032
- 3.4.1. Global Dehydrated Food Market Analysis by application: Introduction
- 3.4.2. Market Size Absolute $ Opportunity Analysis and Forecast, By application, 2016-2032
- 3.4.3. Supermarket
- 3.4.4. Hypermarket
- 3.4.5. E-commerce
- 3.4.6. Retailers
- 3.5. Global Dehydrated Food Market Analysis, Opportunity and Forecast, By product type, 2016-2032
- 3.5.1. Global Dehydrated Food Market Analysis by product type: Introduction
- 3.5.2. Market Size Absolute $ Opportunity Analysis and Forecast, By product type, 2016-2032
- 3.5.3. Dehydrated Fruits
- 3.5.4. Dehydrated Vegetables
- 3.5.5. Dehydrated Meat and Seafood
- 3.5.6. Dehydrated Ready-to-Eat Meals
- 3.5.7. Others
- 3.6. Global Dehydrated Food Market Analysis, Opportunity and Forecast, By end-user, 2016-2032
- 3.6.1. Global Dehydrated Food Market Analysis by end-user: Introduction
- 3.6.2. Market Size Absolute $ Opportunity Analysis and Forecast, By end-user, 2016-2032
- 3.6.3. individuals
- 3.6.4. foodservice establishments
- 4. North America Dehydrated Food Market Analysis, Opportunity and Forecast, 2016-2032
- 4.1. North America Dehydrated Food Market Analysis, 2016-2021
- 4.2. North America Dehydrated Food Market Opportunity and Forecast, 2023-2032
- 4.3. North America Dehydrated Food Market Analysis, Opportunity and Forecast, By Type , 2016-2032
- 4.3.1. North America Dehydrated Food Market Analysis by Type : Introduction
- 4.3.2. Market Size Absolute $ Opportunity Analysis and Forecast, By Type , 2016-2032
- 4.3.3. Spray-dried
- 4.3.4. Freeze-dried
- 4.3.5. Vacuum-dried
- 4.3.6. Drum-dried
- 4.4. North America Dehydrated Food Market Analysis, Opportunity and Forecast, By application, 2016-2032
- 4.4.1. North America Dehydrated Food Market Analysis by application: Introduction
- 4.4.2. Market Size Absolute $ Opportunity Analysis and Forecast, By application, 2016-2032
- 4.4.3. Supermarket
- 4.4.4. Hypermarket
- 4.4.5. E-commerce
- 4.4.6. Retailers
- 4.5. North America Dehydrated Food Market Analysis, Opportunity and Forecast, By product type, 2016-2032
- 4.5.1. North America Dehydrated Food Market Analysis by product type: Introduction
- 4.5.2. Market Size Absolute $ Opportunity Analysis and Forecast, By product type, 2016-2032
- 4.5.3. Dehydrated Fruits
- 4.5.4. Dehydrated Vegetables
- 4.5.5. Dehydrated Meat and Seafood
- 4.5.6. Dehydrated Ready-to-Eat Meals
- 4.5.7. Others
- 4.6. North America Dehydrated Food Market Analysis, Opportunity and Forecast, By end-user, 2016-2032
- 4.6.1. North America Dehydrated Food Market Analysis by end-user: Introduction
- 4.6.2. Market Size Absolute $ Opportunity Analysis and Forecast, By end-user, 2016-2032
- 4.6.3. individuals
- 4.6.4. foodservice establishments
- 4.7. North America Dehydrated Food Market Analysis, Opportunity and Forecast, By Country , 2016-2032
- 4.7.1. North America Dehydrated Food Market Analysis by Country : Introduction
- 4.7.2. Market Size Absolute $ Opportunity Analysis and Forecast, Country , 2016-2032
- 4.7.2.1. The US
- 4.7.2.2. Canada
- 4.7.2.3. Mexico
- 5. Western Europe Dehydrated Food Market Analysis, Opportunity and Forecast, 2016-2032
- 5.1. Western Europe Dehydrated Food Market Analysis, 2016-2021
- 5.2. Western Europe Dehydrated Food Market Opportunity and Forecast, 2023-2032
- 5.3. Western Europe Dehydrated Food Market Analysis, Opportunity and Forecast, By Type , 2016-2032
- 5.3.1. Western Europe Dehydrated Food Market Analysis by Type : Introduction
- 5.3.2. Market Size Absolute $ Opportunity Analysis and Forecast, By Type , 2016-2032
- 5.3.3. Spray-dried
- 5.3.4. Freeze-dried
- 5.3.5. Vacuum-dried
- 5.3.6. Drum-dried
- 5.4. Western Europe Dehydrated Food Market Analysis, Opportunity and Forecast, By application, 2016-2032
- 5.4.1. Western Europe Dehydrated Food Market Analysis by application: Introduction
- 5.4.2. Market Size Absolute $ Opportunity Analysis and Forecast, By application, 2016-2032
- 5.4.3. Supermarket
- 5.4.4. Hypermarket
- 5.4.5. E-commerce
- 5.4.6. Retailers
- 5.5. Western Europe Dehydrated Food Market Analysis, Opportunity and Forecast, By product type, 2016-2032
- 5.5.1. Western Europe Dehydrated Food Market Analysis by product type: Introduction
- 5.5.2. Market Size Absolute $ Opportunity Analysis and Forecast, By product type, 2016-2032
- 5.5.3. Dehydrated Fruits
- 5.5.4. Dehydrated Vegetables
- 5.5.5. Dehydrated Meat and Seafood
- 5.5.6. Dehydrated Ready-to-Eat Meals
- 5.5.7. Others
- 5.6. Western Europe Dehydrated Food Market Analysis, Opportunity and Forecast, By end-user, 2016-2032
- 5.6.1. Western Europe Dehydrated Food Market Analysis by end-user: Introduction
- 5.6.2. Market Size Absolute $ Opportunity Analysis and Forecast, By end-user, 2016-2032
- 5.6.3. individuals
- 5.6.4. foodservice establishments
- 5.7. Western Europe Dehydrated Food Market Analysis, Opportunity and Forecast, By Country , 2016-2032
- 5.7.1. Western Europe Dehydrated Food Market Analysis by Country : Introduction
- 5.7.2. Market Size Absolute $ Opportunity Analysis and Forecast, Country , 2016-2032
- 5.7.2.1. Germany
- 5.7.2.2. France
- 5.7.2.3. The UK
- 5.7.2.4. Spain
- 5.7.2.5. Italy
- 5.7.2.6. Portugal
- 5.7.2.7. Ireland
- 5.7.2.8. Austria
- 5.7.2.9. Switzerland
- 5.7.2.10. Benelux
- 5.7.2.11. Nordic
- 5.7.2.12. Rest of Western Europe
- 6. Eastern Europe Dehydrated Food Market Analysis, Opportunity and Forecast, 2016-2032
- 6.1. Eastern Europe Dehydrated Food Market Analysis, 2016-2021
- 6.2. Eastern Europe Dehydrated Food Market Opportunity and Forecast, 2023-2032
- 6.3. Eastern Europe Dehydrated Food Market Analysis, Opportunity and Forecast, By Type , 2016-2032
- 6.3.1. Eastern Europe Dehydrated Food Market Analysis by Type : Introduction
- 6.3.2. Market Size Absolute $ Opportunity Analysis and Forecast, By Type , 2016-2032
- 6.3.3. Spray-dried
- 6.3.4. Freeze-dried
- 6.3.5. Vacuum-dried
- 6.3.6. Drum-dried
- 6.4. Eastern Europe Dehydrated Food Market Analysis, Opportunity and Forecast, By application, 2016-2032
- 6.4.1. Eastern Europe Dehydrated Food Market Analysis by application: Introduction
- 6.4.2. Market Size Absolute $ Opportunity Analysis and Forecast, By application, 2016-2032
- 6.4.3. Supermarket
- 6.4.4. Hypermarket
- 6.4.5. E-commerce
- 6.4.6. Retailers
- 6.5. Eastern Europe Dehydrated Food Market Analysis, Opportunity and Forecast, By product type, 2016-2032
- 6.5.1. Eastern Europe Dehydrated Food Market Analysis by product type: Introduction
- 6.5.2. Market Size Absolute $ Opportunity Analysis and Forecast, By product type, 2016-2032
- 6.5.3. Dehydrated Fruits
- 6.5.4. Dehydrated Vegetables
- 6.5.5. Dehydrated Meat and Seafood
- 6.5.6. Dehydrated Ready-to-Eat Meals
- 6.5.7. Others
- 6.6. Eastern Europe Dehydrated Food Market Analysis, Opportunity and Forecast, By end-user, 2016-2032
- 6.6.1. Eastern Europe Dehydrated Food Market Analysis by end-user: Introduction
- 6.6.2. Market Size Absolute $ Opportunity Analysis and Forecast, By end-user, 2016-2032
- 6.6.3. individuals
- 6.6.4. foodservice establishments
- 6.7. Eastern Europe Dehydrated Food Market Analysis, Opportunity and Forecast, By Country , 2016-2032
- 6.7.1. Eastern Europe Dehydrated Food Market Analysis by Country : Introduction
- 6.7.2. Market Size Absolute $ Opportunity Analysis and Forecast, Country , 2016-2032
- 6.7.2.1. Russia
- 6.7.2.2. Poland
- 6.7.2.3. The Czech Republic
- 6.7.2.4. Greece
- 6.7.2.5. Rest of Eastern Europe
- 7. APAC Dehydrated Food Market Analysis, Opportunity and Forecast, 2016-2032
- 7.1. APAC Dehydrated Food Market Analysis, 2016-2021
- 7.2. APAC Dehydrated Food Market Opportunity and Forecast, 2023-2032
- 7.3. APAC Dehydrated Food Market Analysis, Opportunity and Forecast, By Type , 2016-2032
- 7.3.1. APAC Dehydrated Food Market Analysis by Type : Introduction
- 7.3.2. Market Size Absolute $ Opportunity Analysis and Forecast, By Type , 2016-2032
- 7.3.3. Spray-dried
- 7.3.4. Freeze-dried
- 7.3.5. Vacuum-dried
- 7.3.6. Drum-dried
- 7.4. APAC Dehydrated Food Market Analysis, Opportunity and Forecast, By application, 2016-2032
- 7.4.1. APAC Dehydrated Food Market Analysis by application: Introduction
- 7.4.2. Market Size Absolute $ Opportunity Analysis and Forecast, By application, 2016-2032
- 7.4.3. Supermarket
- 7.4.4. Hypermarket
- 7.4.5. E-commerce
- 7.4.6. Retailers
- 7.5. APAC Dehydrated Food Market Analysis, Opportunity and Forecast, By product type, 2016-2032
- 7.5.1. APAC Dehydrated Food Market Analysis by product type: Introduction
- 7.5.2. Market Size Absolute $ Opportunity Analysis and Forecast, By product type, 2016-2032
- 7.5.3. Dehydrated Fruits
- 7.5.4. Dehydrated Vegetables
- 7.5.5. Dehydrated Meat and Seafood
- 7.5.6. Dehydrated Ready-to-Eat Meals
- 7.5.7. Others
- 7.6. APAC Dehydrated Food Market Analysis, Opportunity and Forecast, By end-user, 2016-2032
- 7.6.1. APAC Dehydrated Food Market Analysis by end-user: Introduction
- 7.6.2. Market Size Absolute $ Opportunity Analysis and Forecast, By end-user, 2016-2032
- 7.6.3. individuals
- 7.6.4. foodservice establishments
- 7.7. APAC Dehydrated Food Market Analysis, Opportunity and Forecast, By Country , 2016-2032
- 7.7.1. APAC Dehydrated Food Market Analysis by Country : Introduction
- 7.7.2. Market Size Absolute $ Opportunity Analysis and Forecast, Country , 2016-2032
- 7.7.2.1. China
- 7.7.2.2. Japan
- 7.7.2.3. South Korea
- 7.7.2.4. India
- 7.7.2.5. Australia & New Zeland
- 7.7.2.6. Indonesia
- 7.7.2.7. Malaysia
- 7.7.2.8. Philippines
- 7.7.2.9. Singapore
- 7.7.2.10. Thailand
- 7.7.2.11. Vietnam
- 7.7.2.12. Rest of APAC
- 8. Latin America Dehydrated Food Market Analysis, Opportunity and Forecast, 2016-2032
- 8.1. Latin America Dehydrated Food Market Analysis, 2016-2021
- 8.2. Latin America Dehydrated Food Market Opportunity and Forecast, 2023-2032
- 8.3. Latin America Dehydrated Food Market Analysis, Opportunity and Forecast, By Type , 2016-2032
- 8.3.1. Latin America Dehydrated Food Market Analysis by Type : Introduction
- 8.3.2. Market Size Absolute $ Opportunity Analysis and Forecast, By Type , 2016-2032
- 8.3.3. Spray-dried
- 8.3.4. Freeze-dried
- 8.3.5. Vacuum-dried
- 8.3.6. Drum-dried
- 8.4. Latin America Dehydrated Food Market Analysis, Opportunity and Forecast, By application, 2016-2032
- 8.4.1. Latin America Dehydrated Food Market Analysis by application: Introduction
- 8.4.2. Market Size Absolute $ Opportunity Analysis and Forecast, By application, 2016-2032
- 8.4.3. Supermarket
- 8.4.4. Hypermarket
- 8.4.5. E-commerce
- 8.4.6. Retailers
- 8.5. Latin America Dehydrated Food Market Analysis, Opportunity and Forecast, By product type, 2016-2032
- 8.5.1. Latin America Dehydrated Food Market Analysis by product type: Introduction
- 8.5.2. Market Size Absolute $ Opportunity Analysis and Forecast, By product type, 2016-2032
- 8.5.3. Dehydrated Fruits
- 8.5.4. Dehydrated Vegetables
- 8.5.5. Dehydrated Meat and Seafood
- 8.5.6. Dehydrated Ready-to-Eat Meals
- 8.5.7. Others
- 8.6. Latin America Dehydrated Food Market Analysis, Opportunity and Forecast, By end-user, 2016-2032
- 8.6.1. Latin America Dehydrated Food Market Analysis by end-user: Introduction
- 8.6.2. Market Size Absolute $ Opportunity Analysis and Forecast, By end-user, 2016-2032
- 8.6.3. individuals
- 8.6.4. foodservice establishments
- 8.7. Latin America Dehydrated Food Market Analysis, Opportunity and Forecast, By Country , 2016-2032
- 8.7.1. Latin America Dehydrated Food Market Analysis by Country : Introduction
- 8.7.2. Market Size Absolute $ Opportunity Analysis and Forecast, Country , 2016-2032
- 8.7.2.1. Brazil
- 8.7.2.2. Colombia
- 8.7.2.3. Chile
- 8.7.2.4. Argentina
- 8.7.2.5. Costa Rica
- 8.7.2.6. Rest of Latin America
- 9. Middle East & Africa Dehydrated Food Market Analysis, Opportunity and Forecast, 2016-2032
- 9.1. Middle East & Africa Dehydrated Food Market Analysis, 2016-2021
- 9.2. Middle East & Africa Dehydrated Food Market Opportunity and Forecast, 2023-2032
- 9.3. Middle East & Africa Dehydrated Food Market Analysis, Opportunity and Forecast, By Type , 2016-2032
- 9.3.1. Middle East & Africa Dehydrated Food Market Analysis by Type : Introduction
- 9.3.2. Market Size Absolute $ Opportunity Analysis and Forecast, By Type , 2016-2032
- 9.3.3. Spray-dried
- 9.3.4. Freeze-dried
- 9.3.5. Vacuum-dried
- 9.3.6. Drum-dried
- 9.4. Middle East & Africa Dehydrated Food Market Analysis, Opportunity and Forecast, By application, 2016-2032
- 9.4.1. Middle East & Africa Dehydrated Food Market Analysis by application: Introduction
- 9.4.2. Market Size Absolute $ Opportunity Analysis and Forecast, By application, 2016-2032
- 9.4.3. Supermarket
- 9.4.4. Hypermarket
- 9.4.5. E-commerce
- 9.4.6. Retailers
- 9.5. Middle East & Africa Dehydrated Food Market Analysis, Opportunity and Forecast, By product type, 2016-2032
- 9.5.1. Middle East & Africa Dehydrated Food Market Analysis by product type: Introduction
- 9.5.2. Market Size Absolute $ Opportunity Analysis and Forecast, By product type, 2016-2032
- 9.5.3. Dehydrated Fruits
- 9.5.4. Dehydrated Vegetables
- 9.5.5. Dehydrated Meat and Seafood
- 9.5.6. Dehydrated Ready-to-Eat Meals
- 9.5.7. Others
- 9.6. Middle East & Africa Dehydrated Food Market Analysis, Opportunity and Forecast, By end-user, 2016-2032
- 9.6.1. Middle East & Africa Dehydrated Food Market Analysis by end-user: Introduction
- 9.6.2. Market Size Absolute $ Opportunity Analysis and Forecast, By end-user, 2016-2032
- 9.6.3. individuals
- 9.6.4. foodservice establishments
- 9.7. Middle East & Africa Dehydrated Food Market Analysis, Opportunity and Forecast, By Country , 2016-2032
- 9.7.1. Middle East & Africa Dehydrated Food Market Analysis by Country : Introduction
- 9.7.2. Market Size Absolute $ Opportunity Analysis and Forecast, Country , 2016-2032
- 9.7.2.1. Algeria
- 9.7.2.2. Egypt
- 9.7.2.3. Israel
- 9.7.2.4. Kuwait
- 9.7.2.5. Nigeria
- 9.7.2.6. Saudi Arabia
- 9.7.2.7. South Africa
- 9.7.2.8. Turkey
- 9.7.2.9. The UAE
- 9.7.2.10. Rest of MEA
- 10. Global Dehydrated Food Market Analysis, Opportunity and Forecast, By Region , 2016-2032
- 10.1. Global Dehydrated Food Market Analysis by Region : Introduction
- 10.2. Market Size Absolute $ Opportunity Analysis and Forecast, By Region , 2016-2032
- 10.2.1. North America
- 10.2.2. Western Europe
- 10.2.3. Eastern Europe
- 10.2.4. APAC
- 10.2.5. Latin America
- 10.2.6. Middle East & Africa
- 11. Global Dehydrated Food Market Competitive Landscape, Market Share Analysis, and Company Profiles
- 11.1. Market Share Analysis
- 11.2. Company Profiles
- 11.3. Van Drunen Farms
- 11.3.1. Company Overview
- 11.3.2. Financial Highlights
- 11.3.3. Product Portfolio
- 11.3.4. SWOT Analysis
- 11.3.5. Key Strategies and Developments
- 11.4. European Freeze Dry
- 11.4.1. Company Overview
- 11.4.2. Financial Highlights
- 11.4.3. Product Portfolio
- 11.4.4. SWOT Analysis
- 11.4.5. Key Strategies and Developments
- 11.5. Mercer Foods, LLC
- 11.5.1. Company Overview
- 11.5.2. Financial Highlights
- 11.5.3. Product Portfolio
- 11.5.4. SWOT Analysis
- 11.5.5. Key Strategies and Developments
- 11.6. Tong Garden Co. Ltd.
- 11.6.1. Company Overview
- 11.6.2. Financial Highlights
- 11.6.3. Product Portfolio
- 11.6.4. SWOT Analysis
- 11.6.5. Key Strategies and Developments
- 11.7. Crispy Green Inc.
- 11.7.1. Company Overview
- 11.7.2. Financial Highlights
- 11.7.3. Product Portfolio
- 11.7.4. SWOT Analysis
- 11.7.5. Key Strategies and Developments
- 11.8. Harmony House Foods Inc.
- 11.8.1. Company Overview
- 11.8.2. Financial Highlights
- 11.8.3. Product Portfolio
- 11.8.4. SWOT Analysis
- 11.8.5. Key Strategies and Developments
- 11.9. Mother Earth Products
- 11.9.1. Company Overview
- 11.9.2. Financial Highlights
- 11.9.3. Product Portfolio
- 11.9.4. SWOT Analysis
- 11.9.5. Key Strategies and Developments
- 11.10. Green Rootz
- 11.10.1. Company Overview
- 11.10.2. Financial Highlights
- 11.10.3. Product Portfolio
- 11.10.4. SWOT Analysis
- 11.10.5. Key Strategies and Developments
- 11.11. ITC Limited (India)
- 11.11.1. Company Overview
- 11.11.2. Financial Highlights
- 11.11.3. Product Portfolio
- 11.11.4. SWOT Analysis
- 11.11.5. Key Strategies and Developments
- 11.12. California Sun Dry Foods (U.S.)
- 11.12.1. Company Overview
- 11.12.2. Financial Highlights
- 11.12.3. Product Portfolio
- 11.12.4. SWOT Analysis
- 11.12.5. Key Strategies and Developments
- 11.13.1. Company Overview
- 11.13.2. Financial Highlights
- 11.13.3. Product Portfolio
- 11.13.4. SWOT Analysis
- 11.13.5. Key Strategies and Developments
- 11.14. BCFoods, Inc. (U.S.)
- 11.14.1. Company Overview
- 11.14.2. Financial Highlights
- 11.14.3. Product Portfolio
- 11.14.4. SWOT Analysis
- 11.14.5. Key Strategies and Developments
- 11.15. Mondelez International, Inc. (U.S.)
- 11.15.1. Company Overview
- 11.15.2. Financial Highlights
- 11.15.3. Product Portfolio
- 11.15.4. SWOT Analysis
- 11.15.5. Key Strategies and Developments
- 11.16. Sensient Technologies Corporation (U.S.)
- 11.16.1. Company Overview
- 11.16.2. Financial Highlights
- 11.16.3. Product Portfolio
- 11.16.4. SWOT Analysis
- 11.16.5. Key Strategies and Developments
- 12. Assumptions and Acronyms
- 13. Research Methodology
- 14. Contact
- List of Figures
- Figure 1: Global Dehydrated Food Market Revenue (US$ Mn) Market Share by Type in 2022
- Figure 2: Global Dehydrated Food Market Attractiveness Analysis by Type , 2016-2032
- Figure 3: Global Dehydrated Food Market Revenue (US$ Mn) Market Share by applicationin 2022
- Figure 4: Global Dehydrated Food Market Attractiveness Analysis by application, 2016-2032
- Figure 5: Global Dehydrated Food Market Revenue (US$ Mn) Market Share by product typein 2022
- Figure 6: Global Dehydrated Food Market Attractiveness Analysis by product type, 2016-2032
- Figure 7: Global Dehydrated Food Market Revenue (US$ Mn) Market Share by end-userin 2022
- Figure 8: Global Dehydrated Food Market Attractiveness Analysis by end-user, 2016-2032
- Figure 9: Global Dehydrated Food Market Revenue (US$ Mn) Market Share by Region in 2022
- Figure 10: Global Dehydrated Food Market Attractiveness Analysis by Region, 2016-2032
- Figure 11: Global Dehydrated Food Market Revenue (US$ Mn) (2016-2032)
- Figure 12: Global Dehydrated Food Market Revenue (US$ Mn) Comparison by Region (2016-2032)
- Figure 13: Global Dehydrated Food Market Revenue (US$ Mn) Comparison by Type (2016-2032)
- Figure 14: Global Dehydrated Food Market Revenue (US$ Mn) Comparison by application (2016-2032)
- Figure 15: Global Dehydrated Food Market Revenue (US$ Mn) Comparison by product type (2016-2032)
- Figure 16: Global Dehydrated Food Market Revenue (US$ Mn) Comparison by end-user (2016-2032)
- Figure 17: Global Dehydrated Food Market Y-o-Y Growth Rate Comparison by Region (2016-2032)
- Figure 18: Global Dehydrated Food Market Y-o-Y Growth Rate Comparison by Type (2016-2032)
- Figure 19: Global Dehydrated Food Market Y-o-Y Growth Rate Comparison by application (2016-2032)
- Figure 20: Global Dehydrated Food Market Y-o-Y Growth Rate Comparison by product type (2016-2032)
- Figure 21: Global Dehydrated Food Market Y-o-Y Growth Rate Comparison by end-user (2016-2032)
- Figure 22: Global Dehydrated Food Market Share Comparison by Region (2016-2032)
- Figure 23: Global Dehydrated Food Market Share Comparison by Type (2016-2032)
- Figure 24: Global Dehydrated Food Market Share Comparison by application (2016-2032)
- Figure 25: Global Dehydrated Food Market Share Comparison by product type (2016-2032)
- Figure 26: Global Dehydrated Food Market Share Comparison by end-user (2016-2032)
- Figure 27: North America Dehydrated Food Market Revenue (US$ Mn) Market Share by Type in 2022
- Figure 28: North America Dehydrated Food Market Attractiveness Analysis by Type , 2016-2032
- Figure 29: North America Dehydrated Food Market Revenue (US$ Mn) Market Share by applicationin 2022
- Figure 30: North America Dehydrated Food Market Attractiveness Analysis by application, 2016-2032
- Figure 31: North America Dehydrated Food Market Revenue (US$ Mn) Market Share by product typein 2022
- Figure 32: North America Dehydrated Food Market Attractiveness Analysis by product type, 2016-2032
- Figure 33: North America Dehydrated Food Market Revenue (US$ Mn) Market Share by end-userin 2022
- Figure 34: North America Dehydrated Food Market Attractiveness Analysis by end-user, 2016-2032
- Figure 35: North America Dehydrated Food Market Revenue (US$ Mn) Market Share by Country in 2022
- Figure 36: North America Dehydrated Food Market Attractiveness Analysis by Country, 2016-2032
- Figure 37: North America Dehydrated Food Market Revenue (US$ Mn) (2016-2032)
- Figure 38: North America Dehydrated Food Market Revenue (US$ Mn) Comparison by Country (2016-2032)
- Figure 39: North America Dehydrated Food Market Revenue (US$ Mn) Comparison by Type (2016-2032)
- Figure 40: North America Dehydrated Food Market Revenue (US$ Mn) Comparison by application (2016-2032)
- Figure 41: North America Dehydrated Food Market Revenue (US$ Mn) Comparison by product type (2016-2032)
- Figure 42: North America Dehydrated Food Market Revenue (US$ Mn) Comparison by end-user (2016-2032)
- Figure 43: North America Dehydrated Food Market Y-o-Y Growth Rate Comparison by Country (2016-2032)
- Figure 44: North America Dehydrated Food Market Y-o-Y Growth Rate Comparison by Type (2016-2032)
- Figure 45: North America Dehydrated Food Market Y-o-Y Growth Rate Comparison by application (2016-2032)
- Figure 46: North America Dehydrated Food Market Y-o-Y Growth Rate Comparison by product type (2016-2032)
- Figure 47: North America Dehydrated Food Market Y-o-Y Growth Rate Comparison by end-user (2016-2032)
- Figure 48: North America Dehydrated Food Market Share Comparison by Country (2016-2032)
- Figure 49: North America Dehydrated Food Market Share Comparison by Type (2016-2032)
- Figure 50: North America Dehydrated Food Market Share Comparison by application (2016-2032)
- Figure 51: North America Dehydrated Food Market Share Comparison by product type (2016-2032)
- Figure 52: North America Dehydrated Food Market Share Comparison by end-user (2016-2032)
- Figure 53: Western Europe Dehydrated Food Market Revenue (US$ Mn) Market Share by Type in 2022
- Figure 54: Western Europe Dehydrated Food Market Attractiveness Analysis by Type , 2016-2032
- Figure 55: Western Europe Dehydrated Food Market Revenue (US$ Mn) Market Share by applicationin 2022
- Figure 56: Western Europe Dehydrated Food Market Attractiveness Analysis by application, 2016-2032
- Figure 57: Western Europe Dehydrated Food Market Revenue (US$ Mn) Market Share by product typein 2022
- Figure 58: Western Europe Dehydrated Food Market Attractiveness Analysis by product type, 2016-2032
- Figure 59: Western Europe Dehydrated Food Market Revenue (US$ Mn) Market Share by end-userin 2022
- Figure 60: Western Europe Dehydrated Food Market Attractiveness Analysis by end-user, 2016-2032
- Figure 61: Western Europe Dehydrated Food Market Revenue (US$ Mn) Market Share by Country in 2022
- Figure 62: Western Europe Dehydrated Food Market Attractiveness Analysis by Country, 2016-2032
- Figure 63: Western Europe Dehydrated Food Market Revenue (US$ Mn) (2016-2032)
- Figure 64: Western Europe Dehydrated Food Market Revenue (US$ Mn) Comparison by Country (2016-2032)
- Figure 65: Western Europe Dehydrated Food Market Revenue (US$ Mn) Comparison by Type (2016-2032)
- Figure 66: Western Europe Dehydrated Food Market Revenue (US$ Mn) Comparison by application (2016-2032)
- Figure 67: Western Europe Dehydrated Food Market Revenue (US$ Mn) Comparison by product type (2016-2032)
- Figure 68: Western Europe Dehydrated Food Market Revenue (US$ Mn) Comparison by end-user (2016-2032)
- Figure 69: Western Europe Dehydrated Food Market Y-o-Y Growth Rate Comparison by Country (2016-2032)
- Figure 70: Western Europe Dehydrated Food Market Y-o-Y Growth Rate Comparison by Type (2016-2032)
- Figure 71: Western Europe Dehydrated Food Market Y-o-Y Growth Rate Comparison by application (2016-2032)
- Figure 72: Western Europe Dehydrated Food Market Y-o-Y Growth Rate Comparison by product type (2016-2032)
- Figure 73: Western Europe Dehydrated Food Market Y-o-Y Growth Rate Comparison by end-user (2016-2032)
- Figure 74: Western Europe Dehydrated Food Market Share Comparison by Country (2016-2032)
- Figure 75: Western Europe Dehydrated Food Market Share Comparison by Type (2016-2032)
- Figure 76: Western Europe Dehydrated Food Market Share Comparison by application (2016-2032)
- Figure 77: Western Europe Dehydrated Food Market Share Comparison by product type (2016-2032)
- Figure 78: Western Europe Dehydrated Food Market Share Comparison by end-user (2016-2032)
- Figure 79: Eastern Europe Dehydrated Food Market Revenue (US$ Mn) Market Share by Type in 2022
- Figure 80: Eastern Europe Dehydrated Food Market Attractiveness Analysis by Type , 2016-2032
- Figure 81: Eastern Europe Dehydrated Food Market Revenue (US$ Mn) Market Share by applicationin 2022
- Figure 82: Eastern Europe Dehydrated Food Market Attractiveness Analysis by application, 2016-2032
- Figure 83: Eastern Europe Dehydrated Food Market Revenue (US$ Mn) Market Share by product typein 2022
- Figure 84: Eastern Europe Dehydrated Food Market Attractiveness Analysis by product type, 2016-2032
- Figure 85: Eastern Europe Dehydrated Food Market Revenue (US$ Mn) Market Share by end-userin 2022
- Figure 86: Eastern Europe Dehydrated Food Market Attractiveness Analysis by end-user, 2016-2032
- Figure 87: Eastern Europe Dehydrated Food Market Revenue (US$ Mn) Market Share by Country in 2022
- Figure 88: Eastern Europe Dehydrated Food Market Attractiveness Analysis by Country, 2016-2032
- Figure 89: Eastern Europe Dehydrated Food Market Revenue (US$ Mn) (2016-2032)
- Figure 90: Eastern Europe Dehydrated Food Market Revenue (US$ Mn) Comparison by Country (2016-2032)
- Figure 91: Eastern Europe Dehydrated Food Market Revenue (US$ Mn) Comparison by Type (2016-2032)
- Figure 92: Eastern Europe Dehydrated Food Market Revenue (US$ Mn) Comparison by application (2016-2032)
- Figure 93: Eastern Europe Dehydrated Food Market Revenue (US$ Mn) Comparison by product type (2016-2032)
- Figure 94: Eastern Europe Dehydrated Food Market Revenue (US$ Mn) Comparison by end-user (2016-2032)
- Figure 95: Eastern Europe Dehydrated Food Market Y-o-Y Growth Rate Comparison by Country (2016-2032)
- Figure 96: Eastern Europe Dehydrated Food Market Y-o-Y Growth Rate Comparison by Type (2016-2032)
- Figure 97: Eastern Europe Dehydrated Food Market Y-o-Y Growth Rate Comparison by application (2016-2032)
- Figure 98: Eastern Europe Dehydrated Food Market Y-o-Y Growth Rate Comparison by product type (2016-2032)
- Figure 99: Eastern Europe Dehydrated Food Market Y-o-Y Growth Rate Comparison by end-user (2016-2032)
- Figure 100: Eastern Europe Dehydrated Food Market Share Comparison by Country (2016-2032)
- Figure 101: Eastern Europe Dehydrated Food Market Share Comparison by Type (2016-2032)
- Figure 102: Eastern Europe Dehydrated Food Market Share Comparison by application (2016-2032)
- Figure 103: Eastern Europe Dehydrated Food Market Share Comparison by product type (2016-2032)
- Figure 104: Eastern Europe Dehydrated Food Market Share Comparison by end-user (2016-2032)
- Figure 105: APAC Dehydrated Food Market Revenue (US$ Mn) Market Share by Type in 2022
- Figure 106: APAC Dehydrated Food Market Attractiveness Analysis by Type , 2016-2032
- Figure 107: APAC Dehydrated Food Market Revenue (US$ Mn) Market Share by applicationin 2022
- Figure 108: APAC Dehydrated Food Market Attractiveness Analysis by application, 2016-2032
- Figure 109: APAC Dehydrated Food Market Revenue (US$ Mn) Market Share by product typein 2022
- Figure 110: APAC Dehydrated Food Market Attractiveness Analysis by product type, 2016-2032
- Figure 111: APAC Dehydrated Food Market Revenue (US$ Mn) Market Share by end-userin 2022
- Figure 112: APAC Dehydrated Food Market Attractiveness Analysis by end-user, 2016-2032
- Figure 113: APAC Dehydrated Food Market Revenue (US$ Mn) Market Share by Country in 2022
- Figure 114: APAC Dehydrated Food Market Attractiveness Analysis by Country, 2016-2032
- Figure 115: APAC Dehydrated Food Market Revenue (US$ Mn) (2016-2032)
- Figure 116: APAC Dehydrated Food Market Revenue (US$ Mn) Comparison by Country (2016-2032)
- Figure 117: APAC Dehydrated Food Market Revenue (US$ Mn) Comparison by Type (2016-2032)
- Figure 118: APAC Dehydrated Food Market Revenue (US$ Mn) Comparison by application (2016-2032)
- Figure 119: APAC Dehydrated Food Market Revenue (US$ Mn) Comparison by product type (2016-2032)
- Figure 120: APAC Dehydrated Food Market Revenue (US$ Mn) Comparison by end-user (2016-2032)
- Figure 121: APAC Dehydrated Food Market Y-o-Y Growth Rate Comparison by Country (2016-2032)
- Figure 122: APAC Dehydrated Food Market Y-o-Y Growth Rate Comparison by Type (2016-2032)
- Figure 123: APAC Dehydrated Food Market Y-o-Y Growth Rate Comparison by application (2016-2032)
- Figure 124: APAC Dehydrated Food Market Y-o-Y Growth Rate Comparison by product type (2016-2032)
- Figure 125: APAC Dehydrated Food Market Y-o-Y Growth Rate Comparison by end-user (2016-2032)
- Figure 126: APAC Dehydrated Food Market Share Comparison by Country (2016-2032)
- Figure 127: APAC Dehydrated Food Market Share Comparison by Type (2016-2032)
- Figure 128: APAC Dehydrated Food Market Share Comparison by application (2016-2032)
- Figure 129: APAC Dehydrated Food Market Share Comparison by product type (2016-2032)
- Figure 130: APAC Dehydrated Food Market Share Comparison by end-user (2016-2032)
- Figure 131: Latin America Dehydrated Food Market Revenue (US$ Mn) Market Share by Type in 2022
- Figure 132: Latin America Dehydrated Food Market Attractiveness Analysis by Type , 2016-2032
- Figure 133: Latin America Dehydrated Food Market Revenue (US$ Mn) Market Share by applicationin 2022
- Figure 134: Latin America Dehydrated Food Market Attractiveness Analysis by application, 2016-2032
- Figure 135: Latin America Dehydrated Food Market Revenue (US$ Mn) Market Share by product typein 2022
- Figure 136: Latin America Dehydrated Food Market Attractiveness Analysis by product type, 2016-2032
- Figure 137: Latin America Dehydrated Food Market Revenue (US$ Mn) Market Share by end-userin 2022
- Figure 138: Latin America Dehydrated Food Market Attractiveness Analysis by end-user, 2016-2032
- Figure 139: Latin America Dehydrated Food Market Revenue (US$ Mn) Market Share by Country in 2022
- Figure 140: Latin America Dehydrated Food Market Attractiveness Analysis by Country, 2016-2032
- Figure 141: Latin America Dehydrated Food Market Revenue (US$ Mn) (2016-2032)
- Figure 142: Latin America Dehydrated Food Market Revenue (US$ Mn) Comparison by Country (2016-2032)
- Figure 143: Latin America Dehydrated Food Market Revenue (US$ Mn) Comparison by Type (2016-2032)
- Figure 144: Latin America Dehydrated Food Market Revenue (US$ Mn) Comparison by application (2016-2032)
- Figure 145: Latin America Dehydrated Food Market Revenue (US$ Mn) Comparison by product type (2016-2032)
- Figure 146: Latin America Dehydrated Food Market Revenue (US$ Mn) Comparison by end-user (2016-2032)
- Figure 147: Latin America Dehydrated Food Market Y-o-Y Growth Rate Comparison by Country (2016-2032)
- Figure 148: Latin America Dehydrated Food Market Y-o-Y Growth Rate Comparison by Type (2016-2032)
- Figure 149: Latin America Dehydrated Food Market Y-o-Y Growth Rate Comparison by application (2016-2032)
- Figure 150: Latin America Dehydrated Food Market Y-o-Y Growth Rate Comparison by product type (2016-2032)
- Figure 151: Latin America Dehydrated Food Market Y-o-Y Growth Rate Comparison by end-user (2016-2032)
- Figure 152: Latin America Dehydrated Food Market Share Comparison by Country (2016-2032)
- Figure 153: Latin America Dehydrated Food Market Share Comparison by Type (2016-2032)
- Figure 154: Latin America Dehydrated Food Market Share Comparison by application (2016-2032)
- Figure 155: Latin America Dehydrated Food Market Share Comparison by product type (2016-2032)
- Figure 156: Latin America Dehydrated Food Market Share Comparison by end-user (2016-2032)
- Figure 157: Middle East & Africa Dehydrated Food Market Revenue (US$ Mn) Market Share by Type in 2022
- Figure 158: Middle East & Africa Dehydrated Food Market Attractiveness Analysis by Type , 2016-2032
- Figure 159: Middle East & Africa Dehydrated Food Market Revenue (US$ Mn) Market Share by applicationin 2022
- Figure 160: Middle East & Africa Dehydrated Food Market Attractiveness Analysis by application, 2016-2032
- Figure 161: Middle East & Africa Dehydrated Food Market Revenue (US$ Mn) Market Share by product typein 2022
- Figure 162: Middle East & Africa Dehydrated Food Market Attractiveness Analysis by product type, 2016-2032
- Figure 163: Middle East & Africa Dehydrated Food Market Revenue (US$ Mn) Market Share by end-userin 2022
- Figure 164: Middle East & Africa Dehydrated Food Market Attractiveness Analysis by end-user, 2016-2032
- Figure 165: Middle East & Africa Dehydrated Food Market Revenue (US$ Mn) Market Share by Country in 2022
- Figure 166: Middle East & Africa Dehydrated Food Market Attractiveness Analysis by Country, 2016-2032
- Figure 167: Middle East & Africa Dehydrated Food Market Revenue (US$ Mn) (2016-2032)
- Figure 168: Middle East & Africa Dehydrated Food Market Revenue (US$ Mn) Comparison by Country (2016-2032)
- Figure 169: Middle East & Africa Dehydrated Food Market Revenue (US$ Mn) Comparison by Type (2016-2032)
- Figure 170: Middle East & Africa Dehydrated Food Market Revenue (US$ Mn) Comparison by application (2016-2032)
- Figure 171: Middle East & Africa Dehydrated Food Market Revenue (US$ Mn) Comparison by product type (2016-2032)
- Figure 172: Middle East & Africa Dehydrated Food Market Revenue (US$ Mn) Comparison by end-user (2016-2032)
- Figure 173: Middle East & Africa Dehydrated Food Market Y-o-Y Growth Rate Comparison by Country (2016-2032)
- Figure 174: Middle East & Africa Dehydrated Food Market Y-o-Y Growth Rate Comparison by Type (2016-2032)
- Figure 175: Middle East & Africa Dehydrated Food Market Y-o-Y Growth Rate Comparison by application (2016-2032)
- Figure 176: Middle East & Africa Dehydrated Food Market Y-o-Y Growth Rate Comparison by product type (2016-2032)
- Figure 177: Middle East & Africa Dehydrated Food Market Y-o-Y Growth Rate Comparison by end-user (2016-2032)
- Figure 178: Middle East & Africa Dehydrated Food Market Share Comparison by Country (2016-2032)
- Figure 179: Middle East & Africa Dehydrated Food Market Share Comparison by Type (2016-2032)
- Figure 180: Middle East & Africa Dehydrated Food Market Share Comparison by application (2016-2032)
- Figure 181: Middle East & Africa Dehydrated Food Market Share Comparison by product type (2016-2032)
- Figure 182: Middle East & Africa Dehydrated Food Market Share Comparison by end-user (2016-2032)
- List of Tables
- Table 1: Global Dehydrated Food Market Comparison by Type (2016-2032)
- Table 2: Global Dehydrated Food Market Comparison by application (2016-2032)
- Table 3: Global Dehydrated Food Market Comparison by product type (2016-2032)
- Table 4: Global Dehydrated Food Market Comparison by end-user (2016-2032)
- Table 5: Global Dehydrated Food Market Revenue (US$ Mn) Comparison by Region (2016-2032)
- Table 6: Global Dehydrated Food Market Revenue (US$ Mn) (2016-2032)
- Table 7: Global Dehydrated Food Market Revenue (US$ Mn) Comparison by Region (2016-2032)
- Table 8: Global Dehydrated Food Market Revenue (US$ Mn) Comparison by Type (2016-2032)
- Table 9: Global Dehydrated Food Market Revenue (US$ Mn) Comparison by application (2016-2032)
- Table 10: Global Dehydrated Food Market Revenue (US$ Mn) Comparison by product type (2016-2032)
- Table 11: Global Dehydrated Food Market Revenue (US$ Mn) Comparison by end-user (2016-2032)
- Table 12: Global Dehydrated Food Market Y-o-Y Growth Rate Comparison by Region (2016-2032)
- Table 13: Global Dehydrated Food Market Y-o-Y Growth Rate Comparison by Type (2016-2032)
- Table 14: Global Dehydrated Food Market Y-o-Y Growth Rate Comparison by application (2016-2032)
- Table 15: Global Dehydrated Food Market Y-o-Y Growth Rate Comparison by product type (2016-2032)
- Table 16: Global Dehydrated Food Market Y-o-Y Growth Rate Comparison by end-user (2016-2032)
- Table 17: Global Dehydrated Food Market Share Comparison by Region (2016-2032)
- Table 18: Global Dehydrated Food Market Share Comparison by Type (2016-2032)
- Table 19: Global Dehydrated Food Market Share Comparison by application (2016-2032)
- Table 20: Global Dehydrated Food Market Share Comparison by product type (2016-2032)
- Table 21: Global Dehydrated Food Market Share Comparison by end-user (2016-2032)
- Table 22: North America Dehydrated Food Market Comparison by application (2016-2032)
- Table 23: North America Dehydrated Food Market Comparison by product type (2016-2032)
- Table 24: North America Dehydrated Food Market Comparison by end-user (2016-2032)
- Table 25: North America Dehydrated Food Market Revenue (US$ Mn) Comparison by Country (2016-2032)
- Table 26: North America Dehydrated Food Market Revenue (US$ Mn) (2016-2032)
- Table 27: North America Dehydrated Food Market Revenue (US$ Mn) Comparison by Country (2016-2032)
- Table 28: North America Dehydrated Food Market Revenue (US$ Mn) Comparison by Type (2016-2032)
- Table 29: North America Dehydrated Food Market Revenue (US$ Mn) Comparison by application (2016-2032)
- Table 30: North America Dehydrated Food Market Revenue (US$ Mn) Comparison by product type (2016-2032)
- Table 31: North America Dehydrated Food Market Revenue (US$ Mn) Comparison by end-user (2016-2032)
- Table 32: North America Dehydrated Food Market Y-o-Y Growth Rate Comparison by Country (2016-2032)
- Table 33: North America Dehydrated Food Market Y-o-Y Growth Rate Comparison by Type (2016-2032)
- Table 34: North America Dehydrated Food Market Y-o-Y Growth Rate Comparison by application (2016-2032)
- Table 35: North America Dehydrated Food Market Y-o-Y Growth Rate Comparison by product type (2016-2032)
- Table 36: North America Dehydrated Food Market Y-o-Y Growth Rate Comparison by end-user (2016-2032)
- Table 37: North America Dehydrated Food Market Share Comparison by Country (2016-2032)
- Table 38: North America Dehydrated Food Market Share Comparison by Type (2016-2032)
- Table 39: North America Dehydrated Food Market Share Comparison by application (2016-2032)
- Table 40: North America Dehydrated Food Market Share Comparison by product type (2016-2032)
- Table 41: North America Dehydrated Food Market Share Comparison by end-user (2016-2032)
- Table 42: Western Europe Dehydrated Food Market Comparison by Type (2016-2032)
- Table 43: Western Europe Dehydrated Food Market Comparison by application (2016-2032)
- Table 44: Western Europe Dehydrated Food Market Comparison by product type (2016-2032)
- Table 45: Western Europe Dehydrated Food Market Comparison by end-user (2016-2032)
- Table 46: Western Europe Dehydrated Food Market Revenue (US$ Mn) Comparison by Country (2016-2032)
- Table 47: Western Europe Dehydrated Food Market Revenue (US$ Mn) (2016-2032)
- Table 48: Western Europe Dehydrated Food Market Revenue (US$ Mn) Comparison by Country (2016-2032)
- Table 49: Western Europe Dehydrated Food Market Revenue (US$ Mn) Comparison by Type (2016-2032)
- Table 50: Western Europe Dehydrated Food Market Revenue (US$ Mn) Comparison by application (2016-2032)
- Table 51: Western Europe Dehydrated Food Market Revenue (US$ Mn) Comparison by product type (2016-2032)
- Table 52: Western Europe Dehydrated Food Market Revenue (US$ Mn) Comparison by end-user (2016-2032)
- Table 53: Western Europe Dehydrated Food Market Y-o-Y Growth Rate Comparison by Country (2016-2032)
- Table 54: Western Europe Dehydrated Food Market Y-o-Y Growth Rate Comparison by Type (2016-2032)
- Table 55: Western Europe Dehydrated Food Market Y-o-Y Growth Rate Comparison by application (2016-2032)
- Table 56: Western Europe Dehydrated Food Market Y-o-Y Growth Rate Comparison by product type (2016-2032)
- Table 57: Western Europe Dehydrated Food Market Y-o-Y Growth Rate Comparison by end-user (2016-2032)
- Table 58: Western Europe Dehydrated Food Market Share Comparison by Country (2016-2032)
- Table 59: Western Europe Dehydrated Food Market Share Comparison by Type (2016-2032)
- Table 60: Western Europe Dehydrated Food Market Share Comparison by application (2016-2032)
- Table 61: Western Europe Dehydrated Food Market Share Comparison by product type (2016-2032)
- Table 62: Western Europe Dehydrated Food Market Share Comparison by end-user (2016-2032)
- Table 63: Eastern Europe Dehydrated Food Market Comparison by Type (2016-2032)
- Table 64: Eastern Europe Dehydrated Food Market Comparison by application (2016-2032)
- Table 65: Eastern Europe Dehydrated Food Market Comparison by product type (2016-2032)
- Table 66: Eastern Europe Dehydrated Food Market Comparison by end-user (2016-2032)
- Table 67: Eastern Europe Dehydrated Food Market Revenue (US$ Mn) Comparison by Country (2016-2032)
- Table 68: Eastern Europe Dehydrated Food Market Revenue (US$ Mn) (2016-2032)
- Table 69: Eastern Europe Dehydrated Food Market Revenue (US$ Mn) Comparison by Country (2016-2032)
- Table 70: Eastern Europe Dehydrated Food Market Revenue (US$ Mn) Comparison by Type (2016-2032)
- Table 71: Eastern Europe Dehydrated Food Market Revenue (US$ Mn) Comparison by application (2016-2032)
- Table 72: Eastern Europe Dehydrated Food Market Revenue (US$ Mn) Comparison by product type (2016-2032)
- Table 73: Eastern Europe Dehydrated Food Market Revenue (US$ Mn) Comparison by end-user (2016-2032)
- Table 74: Eastern Europe Dehydrated Food Market Y-o-Y Growth Rate Comparison by Country (2016-2032)
- Table 75: Eastern Europe Dehydrated Food Market Y-o-Y Growth Rate Comparison by Type (2016-2032)
- Table 76: Eastern Europe Dehydrated Food Market Y-o-Y Growth Rate Comparison by application (2016-2032)
- Table 77: Eastern Europe Dehydrated Food Market Y-o-Y Growth Rate Comparison by product type (2016-2032)
- Table 78: Eastern Europe Dehydrated Food Market Y-o-Y Growth Rate Comparison by end-user (2016-2032)
- Table 79: Eastern Europe Dehydrated Food Market Share Comparison by Country (2016-2032)
- Table 80: Eastern Europe Dehydrated Food Market Share Comparison by Type (2016-2032)
- Table 81: Eastern Europe Dehydrated Food Market Share Comparison by application (2016-2032)
- Table 82: Eastern Europe Dehydrated Food Market Share Comparison by product type (2016-2032)
- Table 83: Eastern Europe Dehydrated Food Market Share Comparison by end-user (2016-2032)
- Table 84: APAC Dehydrated Food Market Comparison by Type (2016-2032)
- Table 85: APAC Dehydrated Food Market Comparison by application (2016-2032)
- Table 86: APAC Dehydrated Food Market Comparison by product type (2016-2032)
- Table 87: APAC Dehydrated Food Market Comparison by end-user (2016-2032)
- Table 88: APAC Dehydrated Food Market Revenue (US$ Mn) Comparison by Country (2016-2032)
- Table 89: APAC Dehydrated Food Market Revenue (US$ Mn) (2016-2032)
- Table 90: APAC Dehydrated Food Market Revenue (US$ Mn) Comparison by Country (2016-2032)
- Table 91: APAC Dehydrated Food Market Revenue (US$ Mn) Comparison by Type (2016-2032)
- Table 92: APAC Dehydrated Food Market Revenue (US$ Mn) Comparison by application (2016-2032)
- Table 93: APAC Dehydrated Food Market Revenue (US$ Mn) Comparison by product type (2016-2032)
- Table 94: APAC Dehydrated Food Market Revenue (US$ Mn) Comparison by end-user (2016-2032)
- Table 95: APAC Dehydrated Food Market Y-o-Y Growth Rate Comparison by Country (2016-2032)
- Table 96: APAC Dehydrated Food Market Y-o-Y Growth Rate Comparison by Type (2016-2032)
- Table 97: APAC Dehydrated Food Market Y-o-Y Growth Rate Comparison by application (2016-2032)
- Table 98: APAC Dehydrated Food Market Y-o-Y Growth Rate Comparison by product type (2016-2032)
- Table 99: APAC Dehydrated Food Market Y-o-Y Growth Rate Comparison by end-user (2016-2032)
- Table 100: APAC Dehydrated Food Market Share Comparison by Country (2016-2032)
- Table 101: APAC Dehydrated Food Market Share Comparison by Type (2016-2032)
- Table 102: APAC Dehydrated Food Market Share Comparison by application (2016-2032)
- Table 103: APAC Dehydrated Food Market Share Comparison by product type (2016-2032)
- Table 104: APAC Dehydrated Food Market Share Comparison by end-user (2016-2032)
- Table 105: Latin America Dehydrated Food Market Comparison by Type (2016-2032)
- Table 106: Latin America Dehydrated Food Market Comparison by application (2016-2032)
- Table 107: Latin America Dehydrated Food Market Comparison by product type (2016-2032)
- Table 108: Latin America Dehydrated Food Market Comparison by end-user (2016-2032)
- Table 109: Latin America Dehydrated Food Market Revenue (US$ Mn) Comparison by Country (2016-2032)
- Table 110: Latin America Dehydrated Food Market Revenue (US$ Mn) (2016-2032)
- Table 111: Latin America Dehydrated Food Market Revenue (US$ Mn) Comparison by Country (2016-2032)
- Table 112: Latin America Dehydrated Food Market Revenue (US$ Mn) Comparison by Type (2016-2032)
- Table 113: Latin America Dehydrated Food Market Revenue (US$ Mn) Comparison by application (2016-2032)
- Table 114: Latin America Dehydrated Food Market Revenue (US$ Mn) Comparison by product type (2016-2032)
- Table 115: Latin America Dehydrated Food Market Revenue (US$ Mn) Comparison by end-user (2016-2032)
- Table 116: Latin America Dehydrated Food Market Y-o-Y Growth Rate Comparison by Country (2016-2032)
- Table 117: Latin America Dehydrated Food Market Y-o-Y Growth Rate Comparison by Type (2016-2032)
- Table 118: Latin America Dehydrated Food Market Y-o-Y Growth Rate Comparison by application (2016-2032)
- Table 119: Latin America Dehydrated Food Market Y-o-Y Growth Rate Comparison by product type (2016-2032)
- Table 120: Latin America Dehydrated Food Market Y-o-Y Growth Rate Comparison by end-user (2016-2032)
- Table 121: Latin America Dehydrated Food Market Share Comparison by Country (2016-2032)
- Table 122: Latin America Dehydrated Food Market Share Comparison by Type (2016-2032)
- Table 123: Latin America Dehydrated Food Market Share Comparison by application (2016-2032)
- Table 124: Latin America Dehydrated Food Market Share Comparison by product type (2016-2032)
- Table 125: Latin America Dehydrated Food Market Share Comparison by end-user (2016-2032)
- Table 126: Middle East & Africa Dehydrated Food Market Comparison by Type (2016-2032)
- Table 127: Middle East & Africa Dehydrated Food Market Comparison by application (2016-2032)
- Table 128: Middle East & Africa Dehydrated Food Market Comparison by product type (2016-2032)
- Table 129: Middle East & Africa Dehydrated Food Market Comparison by end-user (2016-2032)
- Table 130: Middle East & Africa Dehydrated Food Market Revenue (US$ Mn) Comparison by Country (2016-2032)
- Table 131: Middle East & Africa Dehydrated Food Market Revenue (US$ Mn) (2016-2032)
- Table 132: Middle East & Africa Dehydrated Food Market Revenue (US$ Mn) Comparison by Country (2016-2032)
- Table 133: Middle East & Africa Dehydrated Food Market Revenue (US$ Mn) Comparison by Type (2016-2032)
- Table 134: Middle East & Africa Dehydrated Food Market Revenue (US$ Mn) Comparison by application (2016-2032)
- Table 135: Middle East & Africa Dehydrated Food Market Revenue (US$ Mn) Comparison by product type (2016-2032)
- Table 136: Middle East & Africa Dehydrated Food Market Revenue (US$ Mn) Comparison by end-user (2016-2032)
- Table 137: Middle East & Africa Dehydrated Food Market Y-o-Y Growth Rate Comparison by Country (2016-2032)
- Table 138: Middle East & Africa Dehydrated Food Market Y-o-Y Growth Rate Comparison by Type (2016-2032)
- Table 139: Middle East & Africa Dehydrated Food Market Y-o-Y Growth Rate Comparison by application (2016-2032)
- Table 140: Middle East & Africa Dehydrated Food Market Y-o-Y Growth Rate Comparison by product type (2016-2032)
- Table 141: Middle East & Africa Dehydrated Food Market Y-o-Y Growth Rate Comparison by end-user (2016-2032)
- Table 142: Middle East & Africa Dehydrated Food Market Share Comparison by Country (2016-2032)
- Table 143: Middle East & Africa Dehydrated Food Market Share Comparison by Type (2016-2032)
- Table 144: Middle East & Africa Dehydrated Food Market Share Comparison by application (2016-2032)
- Table 145: Middle East & Africa Dehydrated Food Market Share Comparison by product type (2016-2032)
- Table 146: Middle East & Africa Dehydrated Food Market Share Comparison by end-user (2016-2032)
- 1. Executive Summary
-
- Van Drunen Farms
- European Freeze Dry
- Mercer Foods, LLC
- Tong Garden Co. Ltd.
- Crispy Green Inc.
- Dried Processed Food
- Dried Fruit & Vegetable
- Dried Dairy
- Dried Meat & Seafood
- Harmony House Foods Inc.
- Mother Earth Products
- Green Rootz
- ITC Limited (India)
- California Sun Dry Foods (U.S.)
- BCFoods, Inc. (U.S.)
- Bella Sun Luci (U.S.)
- Mondelez International, Inc. (U.S.)
- Sensient Technologies Corporation (U.S.)
- Lion Raisins Inc.
- Viva Bella Orchards Inc.
- Sow Good Inc.
Our Clients


View Our Licence Options
