
Dashboard Software Market Report By Deployment Type (Cloud-based, On-premises), By Organization Size (Small and Medium-sized Enterprises [SMEs], Large Enterprises), By Industry Vertical (Healthcare, Retail, Telecommunications and IT, Banking, Financial Services, and Insurance [BFSI], Manufacturing, Government and Defense, Others), By Region and Companies - Industry Segment Outlook, Market Assessment, Competition Scenario, Trends and Forecast 2024-2033
-
49321
-
July 2024
-
325
-


-
This report was compiled by Vishwa Gaul Vishwa is an experienced market research and consulting professional with over 8 years of expertise in the ICT industry, contributing to over 700 reports across telecommunications, software, hardware, and digital solutions. Correspondence Team Lead- ICT Linkedin | Detailed Market research Methodology Our methodology involves a mix of primary research, including interviews with leading mental health experts, and secondary research from reputable medical journals and databases. View Detailed Methodology Page
-
Quick Navigation
Report Overview
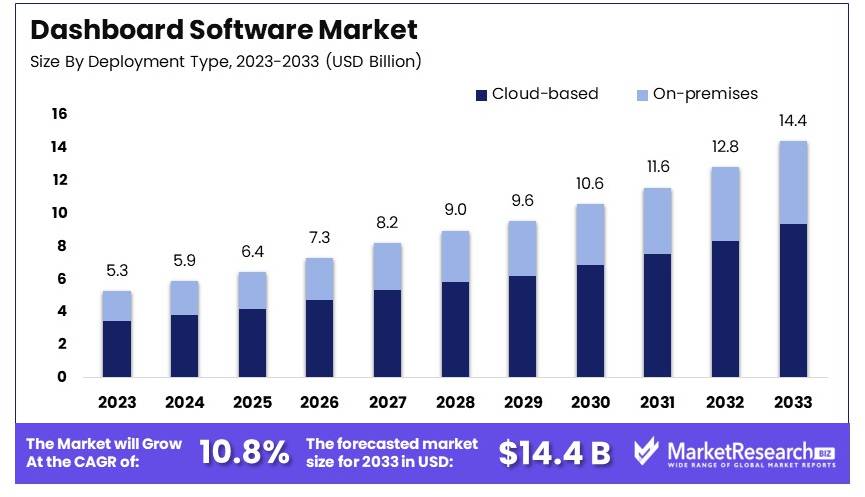
The Global Dashboard Software Market size is expected to be worth around USD 14.4 Billion by 2033, from USD 5.3 Billion in 2023, growing at a CAGR of 10.8% during the forecast period from 2024 to 2033.
The Dashboard Software Market involves software that visualizes key business metrics. These tools consolidate data from multiple sources into one interface. Users can track performance, identify trends, and make data-driven decisions. Companies use dashboard software to enhance operational efficiency. It is critical for monitoring financial performance, sales, and customer behavior.
This market is expanding due to the rise of big data and analytics. It caters to various industries like finance, healthcare, and retail. Vendors offer customized solutions to meet specific business needs. Overall, dashboard software transforms complex data into actionable insights, supporting strategic decision-making.
The Dashboard Software Market is poised for significant expansion, primarily driven by the burgeoning volume of global data, which is forecasted to nearly double from 97 zettabytes in 2022 to 181 zettabytes by 2025. This exponential growth in data creation underscores the critical role of dashboard software in enabling efficient data visualization and decision-making processes across various industries.
Organizations that leverage data-driven strategies exhibit a distinct competitive advantage, evidenced by their enhanced customer acquisition and retention metrics. Specifically, data-driven entities are 23 times more likely to succeed in attracting new customers and six times more likely to retain them, compared to their less informed counterparts. Furthermore, these organizations are 19 times more likely to achieve profitability, highlighting the direct correlation between effective data utilization and financial performance.
As businesses continue to navigate increasingly complex data landscapes, the demand for sophisticated dashboard solutions that offer comprehensive, real-time insights into operational, customer, and market dynamics is expected to escalate. Dashboard software not only simplifies the interpretation of large data sets but also enhances the strategic agility of businesses by providing actionable intelligence that is crucial for maintaining competitive relevance in a data-centric world.
This market's growth is further facilitated by continuous advancements in technology and the integration of artificial intelligence and machine learning, which enhance the analytical capabilities of dashboard tools, making them more predictive and adaptive to user needs. As a result, the Dashboard Software Market is set to become an indispensable component of the modern data-driven business ecosystem.
Key Takeaways
- Market Value: The Dashboard Software Market was valued at USD 5.3 billion in 2023, and is expected to reach USD 14.4 billion by 2033, with a CAGR of 10.8%.
- Deployment Type Analysis: Cloud-based solutions dominated with 65%; essential for flexibility and scalability.
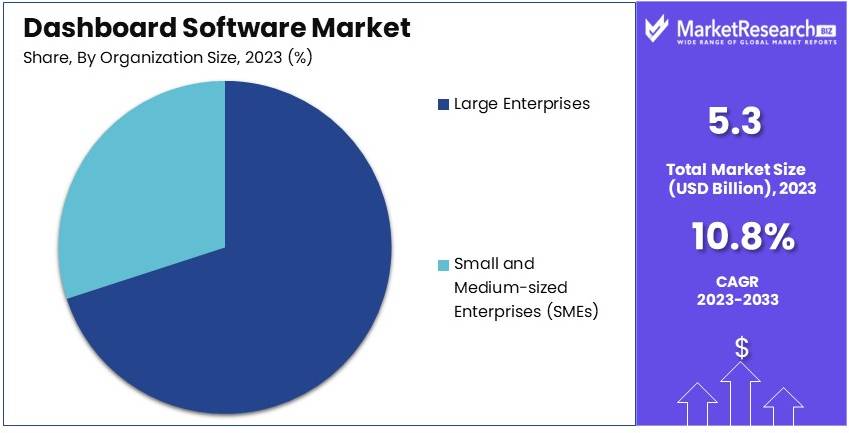
- Organization Size Analysis: Large Enterprises led with 70%; significant for extensive data needs.
- Industry Vertical Analysis: BFSI held 30%; crucial for data-driven decision-making.
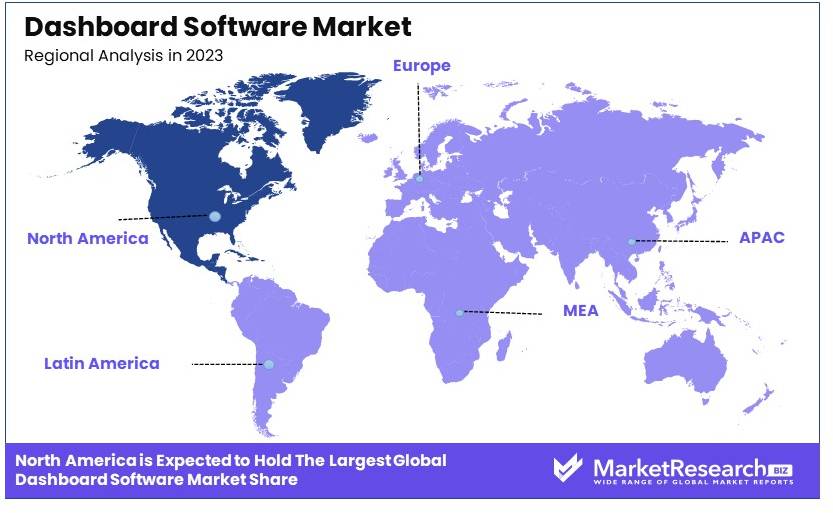
- Dominant Region: North America led with 48%; driven by advanced IT infrastructure.
- High Growth Region: Asia Pacific, driven by rapid digital transformation.
- Analyst Viewpoint: The market is highly competitive with robust growth potential due to increasing demand for data analytics.
Driving Factors
Increasing Demand for Data-Driven Decision-Making Drives Market Growth
The dashboard software market is experiencing substantial growth, primarily fueled by the increasing need for data-driven decision-making across various sectors. Organizations are leveraging dashboard software to access real-time visualizations of key performance indicators (KPIs) and other critical metrics, enhancing their decision-making capabilities.
For instance, a recent study revealed that companies utilizing data-driven analytics have seen a 5-6% improvement in productivity and profitability compared to those that do not. Dashboard software empowers sales, marketing, and executive teams to track performance effectively, align strategies with real-time insights, and anticipate market demands promptly. This demand for strategic, informed decision-making processes substantiates the expansion of the dashboard software market.
Rise of Big Data and Advanced Analytics Drives Market Growth
The surging volume of data generated from diverse sources like social media, IoT solutions, and transactional systems is propelling the adoption of dashboard software. This software plays a crucial role in harnessing the potential of big data by providing advanced analytical tools that help businesses identify trends, patterns, and actionable insights.
For example, the retail sector utilizes dashboard software to analyze customer behaviors and optimize inventory management, which can lead to an increase in customer satisfaction and operational efficiency. The global data creation is projected to grow to more than 180 zettabytes by 2025, highlighting the critical need for effective data management solutions like dashboard software, which are essential for businesses aiming to remain competitive in a data-driven world.
Need for Centralized Data Visualization and Reporting Drives Market Growth
In the modern fast-paced business environment, the demand for real-time, centralized data visualization and reporting is more critical than ever. Dashboard software meets this need by integrating data from multiple sources into a cohesive and visually engaging platform. This capability is particularly vital in industries such as healthcare, where quick access to comprehensive patient data can significantly impact decision-making and patient outcomes.
A report indicates that the use of centralized data systems can reduce information retrieval times by up to 70%, enhancing operational efficiency and responsiveness. The ability of dashboard software to provide a unified view of essential information is a key driver in its market growth, facilitating better strategic decisions and operational agility across various industries.
Restraining Factors
Data Security and Privacy Concerns Restrain Market Growth
The increasing dependency on dashboard software for data visualization and analysis brings significant data security and privacy challenges. As firms handle more sensitive information such as customer details, financial data, and strategic intelligence, ensuring robust protection becomes crucial. Recent surveys indicate that approximately 60% of organizations consider data privacy and security concerns as a major barrier to adopting new software technologies.
These concerns stem from the risk of data breaches and the stringent requirements of global data protection regulations like GDPR. The necessity to implement comprehensive security measures and maintain compliance can deter organizations from adopting dashboard software, thus restraining market growth.
Integration Challenges with Existing Systems Restrain Market Growth
Integration issues with legacy systems significantly hinder the adoption and effective use of dashboard software. Many organizations operate on outdated databases and systems that do not easily integrate with modern dashboard solutions.
The process of extracting, transforming, and loading data across different platforms often requires extensive time and technical expertise, leading to increased costs and delayed deployment. A recent study found that integration challenges contribute to over 40% of the failures in software implementation projects. These integration obstacles not only slow down the operational efficiency but also limit the scalability and flexibility of dashboard software, thereby impeding market expansion.
Deployment Type Analysis
Cloud-based deployment dominates with 65% due to scalability and cost-effectiveness.
The Dashboard Software Market can be significantly segmented by deployment type, including cloud-based and on-premises solutions. Among these, the cloud-based segment commands a dominant position, holding approximately 65% of the market share. This dominance is primarily attributed to the scalability, flexibility, and cost-effectiveness that cloud solutions offer. Organizations, regardless of size, prefer cloud-based dashboard software because it reduces the need for substantial upfront capital investments in IT infrastructure and lowers maintenance costs. Additionally, cloud solutions facilitate easier and faster updates and offer superior integration capabilities with other cloud services, enhancing the overall data management and analytics ecosystem.
On the other hand, the on-premises segment, while smaller, still plays a crucial role, especially in industries that require stringent data control and security, such as banking and government. This segment appeals to organizations that have high compliance requirements or those that operate in regions with strict data residency laws. Although it involves higher initial costs and requires more extensive IT support, on-premises solutions offer organizations complete control over their data and security, which is a critical deciding factor for certain businesses.
Organization Size Analysis
Large enterprises lead with 70% market share due to the need for extensive data integration and advanced analytics capabilities.
In terms of organization size, the Dashboard Software Market is segmented into small and medium-sized enterprises (SMEs) and large enterprises. Large enterprises are the dominant sub-segment, capturing about 70% of the market. This dominance is largely because large organizations typically have more complex operational structures and require comprehensive data integration across various departments and regions. Large enterprises often seek advanced analytics and customization capabilities to handle large volumes of data and derive actionable insights, which dashboard software provides effectively.
While large enterprises lead the segment, SMEs are rapidly adopting dashboard software as well, driven by the need to compete more effectively with larger corporations and the increasing affordability of cloud-based analytics solutions. For SMEs, dashboard software offers a significant advantage by enabling them to make data-driven decisions without the need for extensive IT resources. This democratization of data analytics is crucial for their growth and scalability, making dashboard software an invaluable tool even for smaller businesses.
Industry Vertical Analysis
The BFSI sector leads with 30% market share due to its reliance on real-time data for customer and risk management.
Dashboard software finds extensive application across various industry verticals, but it is particularly predominant in the Banking, Financial Services, and Insurance (BFSI) sector, which holds a 30% share of the market. The BFSI sector relies heavily on real-time and accurate data to manage risks, comply with regulations, and provide enhanced customer services. Dashboard software supports these needs by providing financial institutions with tools to monitor real-time transactions, customer behavior analytics, and risk management parameters effectively.
Other significant segments within the industry vertical include healthcare, retail, telecommunications and IT, manufacturing, government and defense, and others. Each of these segments integrates dashboard software to cater to industry-specific requirements. For instance, in healthcare, dashboard software is used to manage patient care and hospital operations efficiently. In retail, it helps in tracking inventory levels and consumer behavior trends. The telecommunications and IT segment uses dashboard software to monitor network performance and manage customer service effectively. These diverse applications underscore the versatility of dashboard software and its capability to adapt to different industry needs, further driving its market growth across various sectors.
Key Market Segments
By Deployment Type
- Cloud-based
- On-premises
By Organization Size
- Small and Medium-sized Enterprises (SMEs)
- Large Enterprises
By Industry Vertical
- Healthcare
- Retail
- Telecommunications and IT
- Banking, Financial Services, and Insurance (BFSI)
- Manufacturing
- Government and Defense
- Others
Growth Opportunities
Artificial Intelligence (AI) and Machine Learning (ML) Integration Offers Growth Opportunity
The incorporation of AI and ML into dashboard software significantly amplifies its market potential. By integrating these technologies, dashboard tools enhance their analytical capabilities, facilitating superior pattern recognition and predictive analytics. AI-powered dashboards, for instance, are equipped to autonomously identify trends, perform anomaly detection, and generate actionable insights, which empowers businesses to anticipate market changes and optimize operations proactively.
This capability not only improves decision-making but also boosts operational efficiency. Market reports suggest that AI integration in business intelligence tools can increase user engagement by up to 30% due to more personalized and relevant data interactions.
Augmented and Virtual Reality (AR/VR) Visualization Offers Growth Opportunity
Incorporating AR and VR technologies into dashboard software introduces a transformative growth opportunity within the market. These technologies enrich the user experience by providing immersive and interactive ways to visualize and interact with complex data sets. For industries like architecture and engineering, AR/VR enables professionals to explore project simulations and modifications in a virtual 3D environment, enhancing understanding and decision-making precision.
This application is not only innovative but also practical, as it allows for a more intuitive grasp of data, potentially reducing errors and enhancing project outcomes. As the demand for more dynamic and engaging data interaction grows, AR/VR integration stands out as a compelling enhancement that could drive broader adoption of dashboard technologies.
Trending Factors
Mobile and Cross-Device Accessibility Are Trending Factors
The surge in mobile device usage and the necessity for constant access to information are making mobile and cross-device accessibility critical features in the dashboard software market. Today, organizations demand software solutions that provide seamless and consistent access to data across various devices including smartphones, tablets, and laptops.
This mobility enables decision-makers to access vital business metrics on-the-go, ensuring that strategic decisions can be made promptly, irrespective of location. Statistics show that over 50% of business professionals require mobile access to dashboards for real-time data monitoring, highlighting the significant impact of mobile accessibility on the software's adoption and usability.
Collaboration and Sharing Capabilities Are Trending Factors
As remote work becomes more prevalent, the ability for teams to collaborate effectively in real-time is increasingly critical. Dashboard software that supports collaboration and sharing features is trending because it allows team members to annotate, discuss, and share insights directly within the platform, bridging communication gaps and fostering a more integrated decision-making process.
Such functionalities not only enhance the operational efficiency but also promote a collaborative culture by leveraging collective knowledge and expertise. Reports indicate that businesses that implement collaborative tools see a 20% increase in productivity, proving that enhanced sharing capabilities are a significant market trend driving the adoption of advanced dashboard solutions.
Regional Analysis
North America Dominates with 48% Market Share
North America's commanding 48% share in the Dashboard Software Market is driven by several robust factors. This region houses a high concentration of large enterprises that heavily invest in advanced technological solutions to enhance their decision-making processes. Furthermore, North America boasts a mature IT infrastructure, which supports the deployment and integration of advanced dashboard software. The presence of leading tech giants and innovative startups in the region also fuels continual advancements in business intelligence technologies, making it a hotbed for cutting-edge developments in dashboard software.
The regional dynamics of North America are characterized by its highly competitive business environment, which demands efficient, data-driven decision-making tools. The widespread adoption of cloud computing and AI technologies in this region enhances the functionality and appeal of dashboard software, making it an integral part of corporate strategy. Additionally, the stringent data protection regulations in North America drive the need for compliant and secure dashboard solutions, further embedding these tools into the regional market fabric.
Looking ahead, North America is expected to maintain a significant influence on the global Dashboard Software Market. As businesses continue to prioritize data analytics and as technological infrastructure progresses, the demand for sophisticated dashboard solutions is likely to grow. This region's commitment to technological innovation and its role as a global economic leader will likely continue to drive advancements and adoption in the dashboard software sector.
Other Regional Market Shares:
- Europe: Europe holds approximately 29% of the global Dashboard Software Market. The region's growth is supported by its strong emphasis on data privacy and the widespread adoption of GDPR-compliant software solutions.
- Asia Pacific: The Asia Pacific region is rapidly growing with a market share of 17%. This growth is propelled by increasing digital transformation in emerging economies and expanding IT services.
- Middle East & Africa: Holding around 3% of the market, the Middle East and Africa are seeing gradual adoption, driven by digital modernization in government and large enterprises.
- Latin America: Latin America currently captures about 3% of the market. Growth in this region is fueled by the increasing adoption of technology in business operations and the expansion of local enterprises into the digital realm.
Key Regions and Countries
- North America
- The US
- Canada
- Mexico
- Western Europe
- Germany
- France
- The UK
- Spain
- Italy
- Portugal
- Ireland
- Austria
- Switzerland
- Benelux
- Nordic
- Rest of Western Europe
- Eastern Europe
- Russia
- Poland
- The Czech Republic
- Greece
- Rest of Eastern Europe
- APAC
- China
- Japan
- South Korea
- India
- Australia & New Zealand
- Indonesia
- Malaysia
- Philippines
- Singapore
- Thailand
- Vietnam
- Rest of APAC
- Latin America
- Brazil
- Colombia
- Chile
- Argentina
- Costa Rica
- Rest of Latin America
- Middle East & Africa
- Algeria
- Egypt
- Israel
- Kuwait
- Nigeria
- Saudi Arabia
- South Africa
- Turkey
- United Arab Emirates
- Rest of MEA
Key Players Analysis
The Dashboard Software Market features prominent companies like Tableau Software, Microsoft Power BI, and others. These players significantly impact market trends and development.
Tableau Software and Microsoft Power BI lead the market with their advanced analytics and visualization tools. Their user-friendly interfaces and strong market presence give them a strategic advantage.
QlikTech International AB and SAP SE provide robust dashboard solutions. Their comprehensive features and extensive integration capabilities enhance their market influence.
Domo, Inc. and IBM Corporation focus on real-time data analytics and business intelligence. Their innovative solutions and strong market strategies boost their influence.
Sisense Inc. and TIBCO Software Inc. offer advanced data integration and analytics platforms. Their continuous innovation and strategic positioning strengthen their market presence.
Yellowfin BI and Oracle Corporation provide comprehensive BI solutions with advanced visualization capabilities. Their strong market presence and innovative features impact market trends.
Zoho Corporation and Dundas Data Visualization, Inc. focus on user-friendly and customizable dashboard solutions. Their competitive pricing and extensive features improve their market standing.
Infor and GoodData Corporation offer robust data analytics and visualization tools. Their focus on customer satisfaction and continuous product development enhances their market influence.
Looker Data Sciences, Inc. provides advanced data exploration and visualization tools. Its strategic positioning and innovative solutions strengthen its market presence.
In summary, these companies drive the Dashboard Software Market through innovation, strategic positioning, and market influence. Their advanced technologies and robust product offerings shape the market’s future.
Market Key Players
- Tableau Software
- Microsoft Power BI
- QlikTech International AB
- SAP SE
- Domo, Inc.
- IBM Corporation
- Sisense Inc.
- TIBCO Software Inc.
- Yellowfin BI
- Oracle Corporation
- Zoho Corporation
- Dundas Data Visualization, Inc.
- Infor
- GoodData Corporation
- Looker Data Sciences, Inc.
Recent Developments
2024.2 Release / Tableau: Tableau has introduced several new features with its 2024.2 release, including the Einstein Copilot for Tableau. This AI-powered assistant helps users create and edit visualizations using natural language prompts, making data exploration and preparation more efficient. Einstein Copilot for Tableau is expected to be available in July and August 2024.
Report Scope
Report Features Description Market Value (2023) USD 5.3 Billion Forecast Revenue (2033) USD 14.4 Billion CAGR (2024-2033) 10.8% Base Year for Estimation 2023 Historic Period 2018-2023 Forecast Period 2024-2033 Report Coverage Revenue Forecast, Market Dynamics, Competitive Landscape, Recent Developments Segments Covered By Deployment Type (Cloud-based, On-premises), By Organization Size (Small and Medium-sized Enterprises [SMEs], Large Enterprises), By Industry Vertical (Healthcare, Retail, Telecommunications and IT, Banking, Financial Services, and Insurance [BFSI], Manufacturing, Government and Defense, Others) Regional Analysis North America - The US, Canada, & Mexico; Western Europe - Germany, France, The UK, Spain, Italy, Portugal, Ireland, Austria, Switzerland, Benelux, Nordic, & Rest of Western Europe; Eastern Europe - Russia, Poland, The Czech Republic, Greece, & Rest of Eastern Europe; APAC - China, Japan, South Korea, India, Australia & New Zealand, Indonesia, Malaysia, Philippines, Singapore, Thailand, Vietnam, & Rest of APAC; Latin America - Brazil, Colombia, Chile, Argentina, Costa Rica, & Rest of Latin America; Middle East & Africa - Algeria, Egypt, Israel, Kuwait, Nigeria, Saudi Arabia, South Africa, Turkey, United Arab Emirates, & Rest of MEA Competitive Landscape Tableau Software, Microsoft Power BI, QlikTech International AB, SAP SE, Domo, Inc., IBM Corporation, Sisense Inc., TIBCO Software Inc., Yellowfin BI, Oracle Corporation, Zoho Corporation, Dundas Data Visualization, Inc., Infor, GoodData Corporation, Looker Data Sciences, Inc. Customization Scope Customization for segments, region/country-level will be provided. Moreover, additional customization can be done based on the requirements. Purchase Options We have three licenses to opt for: Single User License, Multi-User License (Up to 5 Users), Corporate Use License (Unlimited User and Printable PDF) -
- 1. Executive Summary
- 1.1. Definition
- 1.2. Taxonomy
- 1.3. Research Scope
- 1.4. Key Analysis
- 1.5. Key Findings by Major Segments
- 1.6. Top strategies by Major Players
- 2. Global Dashboard Software Market Overview
- 2.1. Dashboard Software Market Dynamics
- 2.1.1. Drivers
- 2.1.2. Opportunities
- 2.1.3. Restraints
- 2.1.4. Challenges
- 2.2. Macro-economic Factors
- 2.3. Regulatory Framework
- 2.4. Market Investment Feasibility Index
- 2.5. PEST Analysis
- 2.6. PORTER’S Five Force Analysis
- 2.7. Drivers & Restraints Impact Analysis
- 2.8. Industry Chain Analysis
- 2.9. Cost Structure Analysis
- 2.10. Marketing Strategy
- 2.11. Russia-Ukraine War Impact Analysis
- 2.12. Opportunity Map Analysis
- 2.13. Market Competition Scenario Analysis
- 2.14. Product Life Cycle Analysis
- 2.15. Opportunity Orbits
- 2.16. Manufacturer Intensity Map
- 2.17. Major Companies sales by Value & Volume
- 2.1. Dashboard Software Market Dynamics
- 3. Global Dashboard Software Market Analysis, Opportunity and Forecast, 2016-2033
- 3.1. Global Dashboard Software Market Analysis, 2016-2021
- 3.2. Global Dashboard Software Market Opportunity and Forecast, 2023-2033
- 3.3. Global Dashboard Software Market Analysis, Opportunity and Forecast, By Deployment Type, 2016-2033
- 3.3.1. Global Dashboard Software Market Analysis by Deployment Type: Introduction
- 3.3.2. Market Size Absolute $ Opportunity Analysis and Forecast, By Deployment Type, 2016-2033
- 3.3.3. Cloud-based
- 3.3.4. On-premises
- 3.4. Global Dashboard Software Market Analysis, Opportunity and Forecast, By Organization Size, 2016-2033
- 3.4.1. Global Dashboard Software Market Analysis by Organization Size: Introduction
- 3.4.2. Market Size Absolute $ Opportunity Analysis and Forecast, By Organization Size, 2016-2033
- 3.4.3. Small and Medium-sized Enterprises (SMEs)
- 3.4.4. Large Enterprises
- 3.5. Global Dashboard Software Market Analysis, Opportunity and Forecast, By Industry Vertical, 2016-2033
- 3.5.1. Global Dashboard Software Market Analysis by Industry Vertical: Introduction
- 3.5.2. Market Size Absolute $ Opportunity Analysis and Forecast, By Industry Vertical, 2016-2033
- 3.5.3. Healthcare
- 3.5.4. Retail
- 3.5.5. Telecommunications and IT
- 3.5.6. Banking, Financial Services, and Insurance (BFSI)
- 3.5.7. Manufacturing
- 3.5.8. Government and Defense
- 3.5.9. Others
- 4. North America Dashboard Software Market Analysis, Opportunity and Forecast, 2016-2033
- 4.1. North America Dashboard Software Market Analysis, 2016-2021
- 4.2. North America Dashboard Software Market Opportunity and Forecast, 2023-2033
- 4.3. North America Dashboard Software Market Analysis, Opportunity and Forecast, By Deployment Type, 2016-2033
- 4.3.1. North America Dashboard Software Market Analysis by Deployment Type: Introduction
- 4.3.2. Market Size Absolute $ Opportunity Analysis and Forecast, By Deployment Type, 2016-2033
- 4.3.3. Cloud-based
- 4.3.4. On-premises
- 4.4. North America Dashboard Software Market Analysis, Opportunity and Forecast, By Organization Size, 2016-2033
- 4.4.1. North America Dashboard Software Market Analysis by Organization Size: Introduction
- 4.4.2. Market Size Absolute $ Opportunity Analysis and Forecast, By Organization Size, 2016-2033
- 4.4.3. Small and Medium-sized Enterprises (SMEs)
- 4.4.4. Large Enterprises
- 4.5. North America Dashboard Software Market Analysis, Opportunity and Forecast, By Industry Vertical, 2016-2033
- 4.5.1. North America Dashboard Software Market Analysis by Industry Vertical: Introduction
- 4.5.2. Market Size Absolute $ Opportunity Analysis and Forecast, By Industry Vertical, 2016-2033
- 4.5.3. Healthcare
- 4.5.4. Retail
- 4.5.5. Telecommunications and IT
- 4.5.6. Banking, Financial Services, and Insurance (BFSI)
- 4.5.7. Manufacturing
- 4.5.8. Government and Defense
- 4.5.9. Others
- 4.6. North America Dashboard Software Market Analysis, Opportunity and Forecast, By Country , 2016-2033
- 4.6.1. North America Dashboard Software Market Analysis by Country : Introduction
- 4.6.2. Market Size Absolute $ Opportunity Analysis and Forecast, Country , 2016-2033
- 4.6.2.1. The US
- 4.6.2.2. Canada
- 4.6.2.3. Mexico
- 5. Western Europe Dashboard Software Market Analysis, Opportunity and Forecast, 2016-2033
- 5.1. Western Europe Dashboard Software Market Analysis, 2016-2021
- 5.2. Western Europe Dashboard Software Market Opportunity and Forecast, 2023-2033
- 5.3. Western Europe Dashboard Software Market Analysis, Opportunity and Forecast, By Deployment Type, 2016-2033
- 5.3.1. Western Europe Dashboard Software Market Analysis by Deployment Type: Introduction
- 5.3.2. Market Size Absolute $ Opportunity Analysis and Forecast, By Deployment Type, 2016-2033
- 5.3.3. Cloud-based
- 5.3.4. On-premises
- 5.4. Western Europe Dashboard Software Market Analysis, Opportunity and Forecast, By Organization Size, 2016-2033
- 5.4.1. Western Europe Dashboard Software Market Analysis by Organization Size: Introduction
- 5.4.2. Market Size Absolute $ Opportunity Analysis and Forecast, By Organization Size, 2016-2033
- 5.4.3. Small and Medium-sized Enterprises (SMEs)
- 5.4.4. Large Enterprises
- 5.5. Western Europe Dashboard Software Market Analysis, Opportunity and Forecast, By Industry Vertical, 2016-2033
- 5.5.1. Western Europe Dashboard Software Market Analysis by Industry Vertical: Introduction
- 5.5.2. Market Size Absolute $ Opportunity Analysis and Forecast, By Industry Vertical, 2016-2033
- 5.5.3. Healthcare
- 5.5.4. Retail
- 5.5.5. Telecommunications and IT
- 5.5.6. Banking, Financial Services, and Insurance (BFSI)
- 5.5.7. Manufacturing
- 5.5.8. Government and Defense
- 5.5.9. Others
- 5.6. Western Europe Dashboard Software Market Analysis, Opportunity and Forecast, By Country , 2016-2033
- 5.6.1. Western Europe Dashboard Software Market Analysis by Country : Introduction
- 5.6.2. Market Size Absolute $ Opportunity Analysis and Forecast, Country , 2016-2033
- 5.6.2.1. Germany
- 5.6.2.2. France
- 5.6.2.3. The UK
- 5.6.2.4. Spain
- 5.6.2.5. Italy
- 5.6.2.6. Portugal
- 5.6.2.7. Ireland
- 5.6.2.8. Austria
- 5.6.2.9. Switzerland
- 5.6.2.10. Benelux
- 5.6.2.11. Nordic
- 5.6.2.12. Rest of Western Europe
- 6. Eastern Europe Dashboard Software Market Analysis, Opportunity and Forecast, 2016-2033
- 6.1. Eastern Europe Dashboard Software Market Analysis, 2016-2021
- 6.2. Eastern Europe Dashboard Software Market Opportunity and Forecast, 2023-2033
- 6.3. Eastern Europe Dashboard Software Market Analysis, Opportunity and Forecast, By Deployment Type, 2016-2033
- 6.3.1. Eastern Europe Dashboard Software Market Analysis by Deployment Type: Introduction
- 6.3.2. Market Size Absolute $ Opportunity Analysis and Forecast, By Deployment Type, 2016-2033
- 6.3.3. Cloud-based
- 6.3.4. On-premises
- 6.4. Eastern Europe Dashboard Software Market Analysis, Opportunity and Forecast, By Organization Size, 2016-2033
- 6.4.1. Eastern Europe Dashboard Software Market Analysis by Organization Size: Introduction
- 6.4.2. Market Size Absolute $ Opportunity Analysis and Forecast, By Organization Size, 2016-2033
- 6.4.3. Small and Medium-sized Enterprises (SMEs)
- 6.4.4. Large Enterprises
- 6.5. Eastern Europe Dashboard Software Market Analysis, Opportunity and Forecast, By Industry Vertical, 2016-2033
- 6.5.1. Eastern Europe Dashboard Software Market Analysis by Industry Vertical: Introduction
- 6.5.2. Market Size Absolute $ Opportunity Analysis and Forecast, By Industry Vertical, 2016-2033
- 6.5.3. Healthcare
- 6.5.4. Retail
- 6.5.5. Telecommunications and IT
- 6.5.6. Banking, Financial Services, and Insurance (BFSI)
- 6.5.7. Manufacturing
- 6.5.8. Government and Defense
- 6.5.9. Others
- 6.6. Eastern Europe Dashboard Software Market Analysis, Opportunity and Forecast, By Country , 2016-2033
- 6.6.1. Eastern Europe Dashboard Software Market Analysis by Country : Introduction
- 6.6.2. Market Size Absolute $ Opportunity Analysis and Forecast, Country , 2016-2033
- 6.6.2.1. Russia
- 6.6.2.2. Poland
- 6.6.2.3. The Czech Republic
- 6.6.2.4. Greece
- 6.6.2.5. Rest of Eastern Europe
- 7. APAC Dashboard Software Market Analysis, Opportunity and Forecast, 2016-2033
- 7.1. APAC Dashboard Software Market Analysis, 2016-2021
- 7.2. APAC Dashboard Software Market Opportunity and Forecast, 2023-2033
- 7.3. APAC Dashboard Software Market Analysis, Opportunity and Forecast, By Deployment Type, 2016-2033
- 7.3.1. APAC Dashboard Software Market Analysis by Deployment Type: Introduction
- 7.3.2. Market Size Absolute $ Opportunity Analysis and Forecast, By Deployment Type, 2016-2033
- 7.3.3. Cloud-based
- 7.3.4. On-premises
- 7.4. APAC Dashboard Software Market Analysis, Opportunity and Forecast, By Organization Size, 2016-2033
- 7.4.1. APAC Dashboard Software Market Analysis by Organization Size: Introduction
- 7.4.2. Market Size Absolute $ Opportunity Analysis and Forecast, By Organization Size, 2016-2033
- 7.4.3. Small and Medium-sized Enterprises (SMEs)
- 7.4.4. Large Enterprises
- 7.5. APAC Dashboard Software Market Analysis, Opportunity and Forecast, By Industry Vertical, 2016-2033
- 7.5.1. APAC Dashboard Software Market Analysis by Industry Vertical: Introduction
- 7.5.2. Market Size Absolute $ Opportunity Analysis and Forecast, By Industry Vertical, 2016-2033
- 7.5.3. Healthcare
- 7.5.4. Retail
- 7.5.5. Telecommunications and IT
- 7.5.6. Banking, Financial Services, and Insurance (BFSI)
- 7.5.7. Manufacturing
- 7.5.8. Government and Defense
- 7.5.9. Others
- 7.6. APAC Dashboard Software Market Analysis, Opportunity and Forecast, By Country , 2016-2033
- 7.6.1. APAC Dashboard Software Market Analysis by Country : Introduction
- 7.6.2. Market Size Absolute $ Opportunity Analysis and Forecast, Country , 2016-2033
- 7.6.2.1. China
- 7.6.2.2. Japan
- 7.6.2.3. South Korea
- 7.6.2.4. India
- 7.6.2.5. Australia & New Zeland
- 7.6.2.6. Indonesia
- 7.6.2.7. Malaysia
- 7.6.2.8. Philippines
- 7.6.2.9. Singapore
- 7.6.2.10. Thailand
- 7.6.2.11. Vietnam
- 7.6.2.12. Rest of APAC
- 8. Latin America Dashboard Software Market Analysis, Opportunity and Forecast, 2016-2033
- 8.1. Latin America Dashboard Software Market Analysis, 2016-2021
- 8.2. Latin America Dashboard Software Market Opportunity and Forecast, 2023-2033
- 8.3. Latin America Dashboard Software Market Analysis, Opportunity and Forecast, By Deployment Type, 2016-2033
- 8.3.1. Latin America Dashboard Software Market Analysis by Deployment Type: Introduction
- 8.3.2. Market Size Absolute $ Opportunity Analysis and Forecast, By Deployment Type, 2016-2033
- 8.3.3. Cloud-based
- 8.3.4. On-premises
- 8.4. Latin America Dashboard Software Market Analysis, Opportunity and Forecast, By Organization Size, 2016-2033
- 8.4.1. Latin America Dashboard Software Market Analysis by Organization Size: Introduction
- 8.4.2. Market Size Absolute $ Opportunity Analysis and Forecast, By Organization Size, 2016-2033
- 8.4.3. Small and Medium-sized Enterprises (SMEs)
- 8.4.4. Large Enterprises
- 8.5. Latin America Dashboard Software Market Analysis, Opportunity and Forecast, By Industry Vertical, 2016-2033
- 8.5.1. Latin America Dashboard Software Market Analysis by Industry Vertical: Introduction
- 8.5.2. Market Size Absolute $ Opportunity Analysis and Forecast, By Industry Vertical, 2016-2033
- 8.5.3. Healthcare
- 8.5.4. Retail
- 8.5.5. Telecommunications and IT
- 8.5.6. Banking, Financial Services, and Insurance (BFSI)
- 8.5.7. Manufacturing
- 8.5.8. Government and Defense
- 8.5.9. Others
- 8.6. Latin America Dashboard Software Market Analysis, Opportunity and Forecast, By Country , 2016-2033
- 8.6.1. Latin America Dashboard Software Market Analysis by Country : Introduction
- 8.6.2. Market Size Absolute $ Opportunity Analysis and Forecast, Country , 2016-2033
- 8.6.2.1. Brazil
- 8.6.2.2. Colombia
- 8.6.2.3. Chile
- 8.6.2.4. Argentina
- 8.6.2.5. Costa Rica
- 8.6.2.6. Rest of Latin America
- 9. Middle East & Africa Dashboard Software Market Analysis, Opportunity and Forecast, 2016-2033
- 9.1. Middle East & Africa Dashboard Software Market Analysis, 2016-2021
- 9.2. Middle East & Africa Dashboard Software Market Opportunity and Forecast, 2023-2033
- 9.3. Middle East & Africa Dashboard Software Market Analysis, Opportunity and Forecast, By Deployment Type, 2016-2033
- 9.3.1. Middle East & Africa Dashboard Software Market Analysis by Deployment Type: Introduction
- 9.3.2. Market Size Absolute $ Opportunity Analysis and Forecast, By Deployment Type, 2016-2033
- 9.3.3. Cloud-based
- 9.3.4. On-premises
- 9.4. Middle East & Africa Dashboard Software Market Analysis, Opportunity and Forecast, By Organization Size, 2016-2033
- 9.4.1. Middle East & Africa Dashboard Software Market Analysis by Organization Size: Introduction
- 9.4.2. Market Size Absolute $ Opportunity Analysis and Forecast, By Organization Size, 2016-2033
- 9.4.3. Small and Medium-sized Enterprises (SMEs)
- 9.4.4. Large Enterprises
- 9.5. Middle East & Africa Dashboard Software Market Analysis, Opportunity and Forecast, By Industry Vertical, 2016-2033
- 9.5.1. Middle East & Africa Dashboard Software Market Analysis by Industry Vertical: Introduction
- 9.5.2. Market Size Absolute $ Opportunity Analysis and Forecast, By Industry Vertical, 2016-2033
- 9.5.3. Healthcare
- 9.5.4. Retail
- 9.5.5. Telecommunications and IT
- 9.5.6. Banking, Financial Services, and Insurance (BFSI)
- 9.5.7. Manufacturing
- 9.5.8. Government and Defense
- 9.5.9. Others
- 9.6. Middle East & Africa Dashboard Software Market Analysis, Opportunity and Forecast, By Country , 2016-2033
- 9.6.1. Middle East & Africa Dashboard Software Market Analysis by Country : Introduction
- 9.6.2. Market Size Absolute $ Opportunity Analysis and Forecast, Country , 2016-2033
- 9.6.2.1. Algeria
- 9.6.2.2. Egypt
- 9.6.2.3. Israel
- 9.6.2.4. Kuwait
- 9.6.2.5. Nigeria
- 9.6.2.6. Saudi Arabia
- 9.6.2.7. South Africa
- 9.6.2.8. Turkey
- 9.6.2.9. The UAE
- 9.6.2.10. Rest of MEA
- 10. Global Dashboard Software Market Analysis, Opportunity and Forecast, By Region , 2016-2033
- 10.1. Global Dashboard Software Market Analysis by Region : Introduction
- 10.2. Market Size Absolute $ Opportunity Analysis and Forecast, By Region , 2016-2033
- 10.2.1. North America
- 10.2.2. Western Europe
- 10.2.3. Eastern Europe
- 10.2.4. APAC
- 10.2.5. Latin America
- 10.2.6. Middle East & Africa
- 11. Global Dashboard Software Market Competitive Landscape, Market Share Analysis, and Company Profiles
- 11.1. Market Share Analysis
- 11.2. Company Profiles
- 11.3. Tableau Software
- 11.3.1. Company Overview
- 11.3.2. Financial Highlights
- 11.3.3. Product Portfolio
- 11.3.4. SWOT Analysis
- 11.3.5. Key Strategies and Developments
- 11.4. Microsoft Power BI
- 11.4.1. Company Overview
- 11.4.2. Financial Highlights
- 11.4.3. Product Portfolio
- 11.4.4. SWOT Analysis
- 11.4.5. Key Strategies and Developments
- 11.5. QlikTech International AB
- 11.5.1. Company Overview
- 11.5.2. Financial Highlights
- 11.5.3. Product Portfolio
- 11.5.4. SWOT Analysis
- 11.5.5. Key Strategies and Developments
- 11.6. SAP SE
- 11.6.1. Company Overview
- 11.6.2. Financial Highlights
- 11.6.3. Product Portfolio
- 11.6.4. SWOT Analysis
- 11.6.5. Key Strategies and Developments
- 11.7. Domo, Inc.
- 11.7.1. Company Overview
- 11.7.2. Financial Highlights
- 11.7.3. Product Portfolio
- 11.7.4. SWOT Analysis
- 11.7.5. Key Strategies and Developments
- 11.8. IBM Corporation
- 11.8.1. Company Overview
- 11.8.2. Financial Highlights
- 11.8.3. Product Portfolio
- 11.8.4. SWOT Analysis
- 11.8.5. Key Strategies and Developments
- 11.9. Sisense Inc.
- 11.9.1. Company Overview
- 11.9.2. Financial Highlights
- 11.9.3. Product Portfolio
- 11.9.4. SWOT Analysis
- 11.9.5. Key Strategies and Developments
- 11.10. TIBCO Software Inc.
- 11.10.1. Company Overview
- 11.10.2. Financial Highlights
- 11.10.3. Product Portfolio
- 11.10.4. SWOT Analysis
- 11.10.5. Key Strategies and Developments
- 11.11. Yellowfin BI
- 11.11.1. Company Overview
- 11.11.2. Financial Highlights
- 11.11.3. Product Portfolio
- 11.11.4. SWOT Analysis
- 11.11.5. Key Strategies and Developments
- 11.12. Oracle Corporation
- 11.12.1. Company Overview
- 11.12.2. Financial Highlights
- 11.12.3. Product Portfolio
- 11.12.4. SWOT Analysis
- 11.12.5. Key Strategies and Developments
- 11.13.1. Company Overview
- 11.13.2. Financial Highlights
- 11.13.3. Product Portfolio
- 11.13.4. SWOT Analysis
- 11.13.5. Key Strategies and Developments
- 11.14. Zoho Corporation
- 11.14.1. Company Overview
- 11.14.2. Financial Highlights
- 11.14.3. Product Portfolio
- 11.14.4. SWOT Analysis
- 11.14.5. Key Strategies and Developments
- 11.15. Infor
- 11.15.1. Company Overview
- 11.15.2. Financial Highlights
- 11.15.3. Product Portfolio
- 11.15.4. SWOT Analysis
- 11.15.5. Key Strategies and Developments
- 11.16. GoodData Corporation
- 11.16.1. Company Overview
- 11.16.2. Financial Highlights
- 11.16.3. Product Portfolio
- 11.16.4. SWOT Analysis
- 11.16.5. Key Strategies and Developments
- 11.17. Looker Data Sciences, Inc.
- 11.17.1. Company Overview
- 11.17.2. Financial Highlights
- 11.17.3. Product Portfolio
- 11.17.4. SWOT Analysis
- 11.17.5. Key Strategies and Developments
- 12. Assumptions and Acronyms
- 13. Research Methodology
- 14. Contact
"
- List of Figures
- "
- Figure 1: Global Dashboard Software Market Revenue (US$ Mn) Market Share by Deployment Type in 2022
- Figure 2: Global Dashboard Software Market Attractiveness Analysis by Deployment Type, 2016-2033
- Figure 3: Global Dashboard Software Market Revenue (US$ Mn) Market Share by Organization Sizein 2022
- Figure 4: Global Dashboard Software Market Attractiveness Analysis by Organization Size, 2016-2033
- Figure 5: Global Dashboard Software Market Revenue (US$ Mn) Market Share by Industry Verticalin 2022
- Figure 6: Global Dashboard Software Market Attractiveness Analysis by Industry Vertical, 2016-2033
- Figure 7: Global Dashboard Software Market Revenue (US$ Mn) Market Share by Region in 2022
- Figure 8: Global Dashboard Software Market Attractiveness Analysis by Region, 2016-2033
- Figure 9: Global Dashboard Software Market Revenue (US$ Mn) (2016-2033)
- Figure 10: Global Dashboard Software Market Revenue (US$ Mn) Comparison by Region (2016-2033)
- Figure 11: Global Dashboard Software Market Revenue (US$ Mn) Comparison by Deployment Type (2016-2033)
- Figure 12: Global Dashboard Software Market Revenue (US$ Mn) Comparison by Organization Size (2016-2033)
- Figure 13: Global Dashboard Software Market Revenue (US$ Mn) Comparison by Industry Vertical (2016-2033)
- Figure 14: Global Dashboard Software Market Y-o-Y Growth Rate Comparison by Region (2016-2033)
- Figure 15: Global Dashboard Software Market Y-o-Y Growth Rate Comparison by Deployment Type (2016-2033)
- Figure 16: Global Dashboard Software Market Y-o-Y Growth Rate Comparison by Organization Size (2016-2033)
- Figure 17: Global Dashboard Software Market Y-o-Y Growth Rate Comparison by Industry Vertical (2016-2033)
- Figure 18: Global Dashboard Software Market Share Comparison by Region (2016-2033)
- Figure 19: Global Dashboard Software Market Share Comparison by Deployment Type (2016-2033)
- Figure 20: Global Dashboard Software Market Share Comparison by Organization Size (2016-2033)
- Figure 21: Global Dashboard Software Market Share Comparison by Industry Vertical (2016-2033)
- Figure 22: North America Dashboard Software Market Revenue (US$ Mn) Market Share by Deployment Typein 2022
- Figure 23: North America Dashboard Software Market Attractiveness Analysis by Deployment Type, 2016-2033
- Figure 24: North America Dashboard Software Market Revenue (US$ Mn) Market Share by Organization Sizein 2022
- Figure 25: North America Dashboard Software Market Attractiveness Analysis by Organization Size, 2016-2033
- Figure 26: North America Dashboard Software Market Revenue (US$ Mn) Market Share by Industry Verticalin 2022
- Figure 27: North America Dashboard Software Market Attractiveness Analysis by Industry Vertical, 2016-2033
- Figure 28: North America Dashboard Software Market Revenue (US$ Mn) Market Share by Country in 2022
- Figure 29: North America Dashboard Software Market Attractiveness Analysis by Country, 2016-2033
- Figure 30: North America Dashboard Software Market Revenue (US$ Mn) (2016-2033)
- Figure 31: North America Dashboard Software Market Revenue (US$ Mn) Comparison by Country (2016-2033)
- Figure 32: North America Dashboard Software Market Revenue (US$ Mn) Comparison by Deployment Type (2016-2033)
- Figure 33: North America Dashboard Software Market Revenue (US$ Mn) Comparison by Organization Size (2016-2033)
- Figure 34: North America Dashboard Software Market Revenue (US$ Mn) Comparison by Industry Vertical (2016-2033)
- Figure 35: North America Dashboard Software Market Y-o-Y Growth Rate Comparison by Country (2016-2033)
- Figure 36: North America Dashboard Software Market Y-o-Y Growth Rate Comparison by Deployment Type (2016-2033)
- Figure 37: North America Dashboard Software Market Y-o-Y Growth Rate Comparison by Organization Size (2016-2033)
- Figure 38: North America Dashboard Software Market Y-o-Y Growth Rate Comparison by Industry Vertical (2016-2033)
- Figure 39: North America Dashboard Software Market Share Comparison by Country (2016-2033)
- Figure 40: North America Dashboard Software Market Share Comparison by Deployment Type (2016-2033)
- Figure 41: North America Dashboard Software Market Share Comparison by Organization Size (2016-2033)
- Figure 42: North America Dashboard Software Market Share Comparison by Industry Vertical (2016-2033)
- Figure 43: Western Europe Dashboard Software Market Revenue (US$ Mn) Market Share by Deployment Typein 2022
- Figure 44: Western Europe Dashboard Software Market Attractiveness Analysis by Deployment Type, 2016-2033
- Figure 45: Western Europe Dashboard Software Market Revenue (US$ Mn) Market Share by Organization Sizein 2022
- Figure 46: Western Europe Dashboard Software Market Attractiveness Analysis by Organization Size, 2016-2033
- Figure 47: Western Europe Dashboard Software Market Revenue (US$ Mn) Market Share by Industry Verticalin 2022
- Figure 48: Western Europe Dashboard Software Market Attractiveness Analysis by Industry Vertical, 2016-2033
- Figure 49: Western Europe Dashboard Software Market Revenue (US$ Mn) Market Share by Country in 2022
- Figure 50: Western Europe Dashboard Software Market Attractiveness Analysis by Country, 2016-2033
- Figure 51: Western Europe Dashboard Software Market Revenue (US$ Mn) (2016-2033)
- Figure 52: Western Europe Dashboard Software Market Revenue (US$ Mn) Comparison by Country (2016-2033)
- Figure 53: Western Europe Dashboard Software Market Revenue (US$ Mn) Comparison by Deployment Type (2016-2033)
- Figure 54: Western Europe Dashboard Software Market Revenue (US$ Mn) Comparison by Organization Size (2016-2033)
- Figure 55: Western Europe Dashboard Software Market Revenue (US$ Mn) Comparison by Industry Vertical (2016-2033)
- Figure 56: Western Europe Dashboard Software Market Y-o-Y Growth Rate Comparison by Country (2016-2033)
- Figure 57: Western Europe Dashboard Software Market Y-o-Y Growth Rate Comparison by Deployment Type (2016-2033)
- Figure 58: Western Europe Dashboard Software Market Y-o-Y Growth Rate Comparison by Organization Size (2016-2033)
- Figure 59: Western Europe Dashboard Software Market Y-o-Y Growth Rate Comparison by Industry Vertical (2016-2033)
- Figure 60: Western Europe Dashboard Software Market Share Comparison by Country (2016-2033)
- Figure 61: Western Europe Dashboard Software Market Share Comparison by Deployment Type (2016-2033)
- Figure 62: Western Europe Dashboard Software Market Share Comparison by Organization Size (2016-2033)
- Figure 63: Western Europe Dashboard Software Market Share Comparison by Industry Vertical (2016-2033)
- Figure 64: Eastern Europe Dashboard Software Market Revenue (US$ Mn) Market Share by Deployment Typein 2022
- Figure 65: Eastern Europe Dashboard Software Market Attractiveness Analysis by Deployment Type, 2016-2033
- Figure 66: Eastern Europe Dashboard Software Market Revenue (US$ Mn) Market Share by Organization Sizein 2022
- Figure 67: Eastern Europe Dashboard Software Market Attractiveness Analysis by Organization Size, 2016-2033
- Figure 68: Eastern Europe Dashboard Software Market Revenue (US$ Mn) Market Share by Industry Verticalin 2022
- Figure 69: Eastern Europe Dashboard Software Market Attractiveness Analysis by Industry Vertical, 2016-2033
- Figure 70: Eastern Europe Dashboard Software Market Revenue (US$ Mn) Market Share by Country in 2022
- Figure 71: Eastern Europe Dashboard Software Market Attractiveness Analysis by Country, 2016-2033
- Figure 72: Eastern Europe Dashboard Software Market Revenue (US$ Mn) (2016-2033)
- Figure 73: Eastern Europe Dashboard Software Market Revenue (US$ Mn) Comparison by Country (2016-2033)
- Figure 74: Eastern Europe Dashboard Software Market Revenue (US$ Mn) Comparison by Deployment Type (2016-2033)
- Figure 75: Eastern Europe Dashboard Software Market Revenue (US$ Mn) Comparison by Organization Size (2016-2033)
- Figure 76: Eastern Europe Dashboard Software Market Revenue (US$ Mn) Comparison by Industry Vertical (2016-2033)
- Figure 77: Eastern Europe Dashboard Software Market Y-o-Y Growth Rate Comparison by Country (2016-2033)
- Figure 78: Eastern Europe Dashboard Software Market Y-o-Y Growth Rate Comparison by Deployment Type (2016-2033)
- Figure 79: Eastern Europe Dashboard Software Market Y-o-Y Growth Rate Comparison by Organization Size (2016-2033)
- Figure 80: Eastern Europe Dashboard Software Market Y-o-Y Growth Rate Comparison by Industry Vertical (2016-2033)
- Figure 81: Eastern Europe Dashboard Software Market Share Comparison by Country (2016-2033)
- Figure 82: Eastern Europe Dashboard Software Market Share Comparison by Deployment Type (2016-2033)
- Figure 83: Eastern Europe Dashboard Software Market Share Comparison by Organization Size (2016-2033)
- Figure 84: Eastern Europe Dashboard Software Market Share Comparison by Industry Vertical (2016-2033)
- Figure 85: APAC Dashboard Software Market Revenue (US$ Mn) Market Share by Deployment Typein 2022
- Figure 86: APAC Dashboard Software Market Attractiveness Analysis by Deployment Type, 2016-2033
- Figure 87: APAC Dashboard Software Market Revenue (US$ Mn) Market Share by Organization Sizein 2022
- Figure 88: APAC Dashboard Software Market Attractiveness Analysis by Organization Size, 2016-2033
- Figure 89: APAC Dashboard Software Market Revenue (US$ Mn) Market Share by Industry Verticalin 2022
- Figure 90: APAC Dashboard Software Market Attractiveness Analysis by Industry Vertical, 2016-2033
- Figure 91: APAC Dashboard Software Market Revenue (US$ Mn) Market Share by Country in 2022
- Figure 92: APAC Dashboard Software Market Attractiveness Analysis by Country, 2016-2033
- Figure 93: APAC Dashboard Software Market Revenue (US$ Mn) (2016-2033)
- Figure 94: APAC Dashboard Software Market Revenue (US$ Mn) Comparison by Country (2016-2033)
- Figure 95: APAC Dashboard Software Market Revenue (US$ Mn) Comparison by Deployment Type (2016-2033)
- Figure 96: APAC Dashboard Software Market Revenue (US$ Mn) Comparison by Organization Size (2016-2033)
- Figure 97: APAC Dashboard Software Market Revenue (US$ Mn) Comparison by Industry Vertical (2016-2033)
- Figure 98: APAC Dashboard Software Market Y-o-Y Growth Rate Comparison by Country (2016-2033)
- Figure 99: APAC Dashboard Software Market Y-o-Y Growth Rate Comparison by Deployment Type (2016-2033)
- Figure 100: APAC Dashboard Software Market Y-o-Y Growth Rate Comparison by Organization Size (2016-2033)
- Figure 101: APAC Dashboard Software Market Y-o-Y Growth Rate Comparison by Industry Vertical (2016-2033)
- Figure 102: APAC Dashboard Software Market Share Comparison by Country (2016-2033)
- Figure 103: APAC Dashboard Software Market Share Comparison by Deployment Type (2016-2033)
- Figure 104: APAC Dashboard Software Market Share Comparison by Organization Size (2016-2033)
- Figure 105: APAC Dashboard Software Market Share Comparison by Industry Vertical (2016-2033)
- Figure 106: Latin America Dashboard Software Market Revenue (US$ Mn) Market Share by Deployment Typein 2022
- Figure 107: Latin America Dashboard Software Market Attractiveness Analysis by Deployment Type, 2016-2033
- Figure 108: Latin America Dashboard Software Market Revenue (US$ Mn) Market Share by Organization Sizein 2022
- Figure 109: Latin America Dashboard Software Market Attractiveness Analysis by Organization Size, 2016-2033
- Figure 110: Latin America Dashboard Software Market Revenue (US$ Mn) Market Share by Industry Verticalin 2022
- Figure 111: Latin America Dashboard Software Market Attractiveness Analysis by Industry Vertical, 2016-2033
- Figure 112: Latin America Dashboard Software Market Revenue (US$ Mn) Market Share by Country in 2022
- Figure 113: Latin America Dashboard Software Market Attractiveness Analysis by Country, 2016-2033
- Figure 114: Latin America Dashboard Software Market Revenue (US$ Mn) (2016-2033)
- Figure 115: Latin America Dashboard Software Market Revenue (US$ Mn) Comparison by Country (2016-2033)
- Figure 116: Latin America Dashboard Software Market Revenue (US$ Mn) Comparison by Deployment Type (2016-2033)
- Figure 117: Latin America Dashboard Software Market Revenue (US$ Mn) Comparison by Organization Size (2016-2033)
- Figure 118: Latin America Dashboard Software Market Revenue (US$ Mn) Comparison by Industry Vertical (2016-2033)
- Figure 119: Latin America Dashboard Software Market Y-o-Y Growth Rate Comparison by Country (2016-2033)
- Figure 120: Latin America Dashboard Software Market Y-o-Y Growth Rate Comparison by Deployment Type (2016-2033)
- Figure 121: Latin America Dashboard Software Market Y-o-Y Growth Rate Comparison by Organization Size (2016-2033)
- Figure 122: Latin America Dashboard Software Market Y-o-Y Growth Rate Comparison by Industry Vertical (2016-2033)
- Figure 123: Latin America Dashboard Software Market Share Comparison by Country (2016-2033)
- Figure 124: Latin America Dashboard Software Market Share Comparison by Deployment Type (2016-2033)
- Figure 125: Latin America Dashboard Software Market Share Comparison by Organization Size (2016-2033)
- Figure 126: Latin America Dashboard Software Market Share Comparison by Industry Vertical (2016-2033)
- Figure 127: Middle East & Africa Dashboard Software Market Revenue (US$ Mn) Market Share by Deployment Typein 2022
- Figure 128: Middle East & Africa Dashboard Software Market Attractiveness Analysis by Deployment Type, 2016-2033
- Figure 129: Middle East & Africa Dashboard Software Market Revenue (US$ Mn) Market Share by Organization Sizein 2022
- Figure 130: Middle East & Africa Dashboard Software Market Attractiveness Analysis by Organization Size, 2016-2033
- Figure 131: Middle East & Africa Dashboard Software Market Revenue (US$ Mn) Market Share by Industry Verticalin 2022
- Figure 132: Middle East & Africa Dashboard Software Market Attractiveness Analysis by Industry Vertical, 2016-2033
- Figure 133: Middle East & Africa Dashboard Software Market Revenue (US$ Mn) Market Share by Country in 2022
- Figure 134: Middle East & Africa Dashboard Software Market Attractiveness Analysis by Country, 2016-2033
- Figure 135: Middle East & Africa Dashboard Software Market Revenue (US$ Mn) (2016-2033)
- Figure 136: Middle East & Africa Dashboard Software Market Revenue (US$ Mn) Comparison by Country (2016-2033)
- Figure 137: Middle East & Africa Dashboard Software Market Revenue (US$ Mn) Comparison by Deployment Type (2016-2033)
- Figure 138: Middle East & Africa Dashboard Software Market Revenue (US$ Mn) Comparison by Organization Size (2016-2033)
- Figure 139: Middle East & Africa Dashboard Software Market Revenue (US$ Mn) Comparison by Industry Vertical (2016-2033)
- Figure 140: Middle East & Africa Dashboard Software Market Y-o-Y Growth Rate Comparison by Country (2016-2033)
- Figure 141: Middle East & Africa Dashboard Software Market Y-o-Y Growth Rate Comparison by Deployment Type (2016-2033)
- Figure 142: Middle East & Africa Dashboard Software Market Y-o-Y Growth Rate Comparison by Organization Size (2016-2033)
- Figure 143: Middle East & Africa Dashboard Software Market Y-o-Y Growth Rate Comparison by Industry Vertical (2016-2033)
- Figure 144: Middle East & Africa Dashboard Software Market Share Comparison by Country (2016-2033)
- Figure 145: Middle East & Africa Dashboard Software Market Share Comparison by Deployment Type (2016-2033)
- Figure 146: Middle East & Africa Dashboard Software Market Share Comparison by Organization Size (2016-2033)
- Figure 147: Middle East & Africa Dashboard Software Market Share Comparison by Industry Vertical (2016-2033)
"
- List of Tables
- "
- Table 1: Global Dashboard Software Market Comparison by Deployment Type (2016-2033)
- Table 2: Global Dashboard Software Market Comparison by Organization Size (2016-2033)
- Table 3: Global Dashboard Software Market Comparison by Industry Vertical (2016-2033)
- Table 4: Global Dashboard Software Market Revenue (US$ Mn) Comparison by Region (2016-2033)
- Table 5: Global Dashboard Software Market Revenue (US$ Mn) (2016-2033)
- Table 6: Global Dashboard Software Market Revenue (US$ Mn) Comparison by Region (2016-2033)
- Table 7: Global Dashboard Software Market Revenue (US$ Mn) Comparison by Deployment Type (2016-2033)
- Table 8: Global Dashboard Software Market Revenue (US$ Mn) Comparison by Organization Size (2016-2033)
- Table 9: Global Dashboard Software Market Revenue (US$ Mn) Comparison by Industry Vertical (2016-2033)
- Table 10: Global Dashboard Software Market Y-o-Y Growth Rate Comparison by Region (2016-2033)
- Table 11: Global Dashboard Software Market Y-o-Y Growth Rate Comparison by Deployment Type (2016-2033)
- Table 12: Global Dashboard Software Market Y-o-Y Growth Rate Comparison by Organization Size (2016-2033)
- Table 13: Global Dashboard Software Market Y-o-Y Growth Rate Comparison by Industry Vertical (2016-2033)
- Table 14: Global Dashboard Software Market Share Comparison by Region (2016-2033)
- Table 15: Global Dashboard Software Market Share Comparison by Deployment Type (2016-2033)
- Table 16: Global Dashboard Software Market Share Comparison by Organization Size (2016-2033)
- Table 17: Global Dashboard Software Market Share Comparison by Industry Vertical (2016-2033)
- Table 18: North America Dashboard Software Market Comparison by Organization Size (2016-2033)
- Table 19: North America Dashboard Software Market Comparison by Industry Vertical (2016-2033)
- Table 20: North America Dashboard Software Market Revenue (US$ Mn) Comparison by Country (2016-2033)
- Table 21: North America Dashboard Software Market Revenue (US$ Mn) (2016-2033)
- Table 22: North America Dashboard Software Market Revenue (US$ Mn) Comparison by Country (2016-2033)
- Table 23: North America Dashboard Software Market Revenue (US$ Mn) Comparison by Deployment Type (2016-2033)
- Table 24: North America Dashboard Software Market Revenue (US$ Mn) Comparison by Organization Size (2016-2033)
- Table 25: North America Dashboard Software Market Revenue (US$ Mn) Comparison by Industry Vertical (2016-2033)
- Table 26: North America Dashboard Software Market Y-o-Y Growth Rate Comparison by Country (2016-2033)
- Table 27: North America Dashboard Software Market Y-o-Y Growth Rate Comparison by Deployment Type (2016-2033)
- Table 28: North America Dashboard Software Market Y-o-Y Growth Rate Comparison by Organization Size (2016-2033)
- Table 29: North America Dashboard Software Market Y-o-Y Growth Rate Comparison by Industry Vertical (2016-2033)
- Table 30: North America Dashboard Software Market Share Comparison by Country (2016-2033)
- Table 31: North America Dashboard Software Market Share Comparison by Deployment Type (2016-2033)
- Table 32: North America Dashboard Software Market Share Comparison by Organization Size (2016-2033)
- Table 33: North America Dashboard Software Market Share Comparison by Industry Vertical (2016-2033)
- Table 34: Western Europe Dashboard Software Market Comparison by Deployment Type (2016-2033)
- Table 35: Western Europe Dashboard Software Market Comparison by Organization Size (2016-2033)
- Table 36: Western Europe Dashboard Software Market Comparison by Industry Vertical (2016-2033)
- Table 37: Western Europe Dashboard Software Market Revenue (US$ Mn) Comparison by Country (2016-2033)
- Table 38: Western Europe Dashboard Software Market Revenue (US$ Mn) (2016-2033)
- Table 39: Western Europe Dashboard Software Market Revenue (US$ Mn) Comparison by Country (2016-2033)
- Table 40: Western Europe Dashboard Software Market Revenue (US$ Mn) Comparison by Deployment Type (2016-2033)
- Table 41: Western Europe Dashboard Software Market Revenue (US$ Mn) Comparison by Organization Size (2016-2033)
- Table 42: Western Europe Dashboard Software Market Revenue (US$ Mn) Comparison by Industry Vertical (2016-2033)
- Table 43: Western Europe Dashboard Software Market Y-o-Y Growth Rate Comparison by Country (2016-2033)
- Table 44: Western Europe Dashboard Software Market Y-o-Y Growth Rate Comparison by Deployment Type (2016-2033)
- Table 45: Western Europe Dashboard Software Market Y-o-Y Growth Rate Comparison by Organization Size (2016-2033)
- Table 46: Western Europe Dashboard Software Market Y-o-Y Growth Rate Comparison by Industry Vertical (2016-2033)
- Table 47: Western Europe Dashboard Software Market Share Comparison by Country (2016-2033)
- Table 48: Western Europe Dashboard Software Market Share Comparison by Deployment Type (2016-2033)
- Table 49: Western Europe Dashboard Software Market Share Comparison by Organization Size (2016-2033)
- Table 50: Western Europe Dashboard Software Market Share Comparison by Industry Vertical (2016-2033)
- Table 51: Eastern Europe Dashboard Software Market Comparison by Deployment Type (2016-2033)
- Table 52: Eastern Europe Dashboard Software Market Comparison by Organization Size (2016-2033)
- Table 53: Eastern Europe Dashboard Software Market Comparison by Industry Vertical (2016-2033)
- Table 54: Eastern Europe Dashboard Software Market Revenue (US$ Mn) Comparison by Country (2016-2033)
- Table 55: Eastern Europe Dashboard Software Market Revenue (US$ Mn) (2016-2033)
- Table 56: Eastern Europe Dashboard Software Market Revenue (US$ Mn) Comparison by Country (2016-2033)
- Table 57: Eastern Europe Dashboard Software Market Revenue (US$ Mn) Comparison by Deployment Type (2016-2033)
- Table 58: Eastern Europe Dashboard Software Market Revenue (US$ Mn) Comparison by Organization Size (2016-2033)
- Table 59: Eastern Europe Dashboard Software Market Revenue (US$ Mn) Comparison by Industry Vertical (2016-2033)
- Table 60: Eastern Europe Dashboard Software Market Y-o-Y Growth Rate Comparison by Country (2016-2033)
- Table 61: Eastern Europe Dashboard Software Market Y-o-Y Growth Rate Comparison by Deployment Type (2016-2033)
- Table 62: Eastern Europe Dashboard Software Market Y-o-Y Growth Rate Comparison by Organization Size (2016-2033)
- Table 63: Eastern Europe Dashboard Software Market Y-o-Y Growth Rate Comparison by Industry Vertical (2016-2033)
- Table 64: Eastern Europe Dashboard Software Market Share Comparison by Country (2016-2033)
- Table 65: Eastern Europe Dashboard Software Market Share Comparison by Deployment Type (2016-2033)
- Table 66: Eastern Europe Dashboard Software Market Share Comparison by Organization Size (2016-2033)
- Table 67: Eastern Europe Dashboard Software Market Share Comparison by Industry Vertical (2016-2033)
- Table 68: APAC Dashboard Software Market Comparison by Deployment Type (2016-2033)
- Table 69: APAC Dashboard Software Market Comparison by Organization Size (2016-2033)
- Table 70: APAC Dashboard Software Market Comparison by Industry Vertical (2016-2033)
- Table 71: APAC Dashboard Software Market Revenue (US$ Mn) Comparison by Country (2016-2033)
- Table 72: APAC Dashboard Software Market Revenue (US$ Mn) (2016-2033)
- Table 73: APAC Dashboard Software Market Revenue (US$ Mn) Comparison by Country (2016-2033)
- Table 74: APAC Dashboard Software Market Revenue (US$ Mn) Comparison by Deployment Type (2016-2033)
- Table 75: APAC Dashboard Software Market Revenue (US$ Mn) Comparison by Organization Size (2016-2033)
- Table 76: APAC Dashboard Software Market Revenue (US$ Mn) Comparison by Industry Vertical (2016-2033)
- Table 77: APAC Dashboard Software Market Y-o-Y Growth Rate Comparison by Country (2016-2033)
- Table 78: APAC Dashboard Software Market Y-o-Y Growth Rate Comparison by Deployment Type (2016-2033)
- Table 79: APAC Dashboard Software Market Y-o-Y Growth Rate Comparison by Organization Size (2016-2033)
- Table 80: APAC Dashboard Software Market Y-o-Y Growth Rate Comparison by Industry Vertical (2016-2033)
- Table 81: APAC Dashboard Software Market Share Comparison by Country (2016-2033)
- Table 82: APAC Dashboard Software Market Share Comparison by Deployment Type (2016-2033)
- Table 83: APAC Dashboard Software Market Share Comparison by Organization Size (2016-2033)
- Table 84: APAC Dashboard Software Market Share Comparison by Industry Vertical (2016-2033)
- Table 85: Latin America Dashboard Software Market Comparison by Deployment Type (2016-2033)
- Table 86: Latin America Dashboard Software Market Comparison by Organization Size (2016-2033)
- Table 87: Latin America Dashboard Software Market Comparison by Industry Vertical (2016-2033)
- Table 88: Latin America Dashboard Software Market Revenue (US$ Mn) Comparison by Country (2016-2033)
- Table 89: Latin America Dashboard Software Market Revenue (US$ Mn) (2016-2033)
- Table 90: Latin America Dashboard Software Market Revenue (US$ Mn) Comparison by Country (2016-2033)
- Table 91: Latin America Dashboard Software Market Revenue (US$ Mn) Comparison by Deployment Type (2016-2033)
- Table 92: Latin America Dashboard Software Market Revenue (US$ Mn) Comparison by Organization Size (2016-2033)
- Table 93: Latin America Dashboard Software Market Revenue (US$ Mn) Comparison by Industry Vertical (2016-2033)
- Table 94: Latin America Dashboard Software Market Y-o-Y Growth Rate Comparison by Country (2016-2033)
- Table 95: Latin America Dashboard Software Market Y-o-Y Growth Rate Comparison by Deployment Type (2016-2033)
- Table 96: Latin America Dashboard Software Market Y-o-Y Growth Rate Comparison by Organization Size (2016-2033)
- Table 97: Latin America Dashboard Software Market Y-o-Y Growth Rate Comparison by Industry Vertical (2016-2033)
- Table 98: Latin America Dashboard Software Market Share Comparison by Country (2016-2033)
- Table 99: Latin America Dashboard Software Market Share Comparison by Deployment Type (2016-2033)
- Table 100: Latin America Dashboard Software Market Share Comparison by Organization Size (2016-2033)
- Table 101: Latin America Dashboard Software Market Share Comparison by Industry Vertical (2016-2033)
- Table 102: Middle East & Africa Dashboard Software Market Comparison by Deployment Type (2016-2033)
- Table 103: Middle East & Africa Dashboard Software Market Comparison by Organization Size (2016-2033)
- Table 104: Middle East & Africa Dashboard Software Market Comparison by Industry Vertical (2016-2033)
- Table 105: Middle East & Africa Dashboard Software Market Revenue (US$ Mn) Comparison by Country (2016-2033)
- Table 106: Middle East & Africa Dashboard Software Market Revenue (US$ Mn) (2016-2033)
- Table 107: Middle East & Africa Dashboard Software Market Revenue (US$ Mn) Comparison by Country (2016-2033)
- Table 108: Middle East & Africa Dashboard Software Market Revenue (US$ Mn) Comparison by Deployment Type (2016-2033)
- Table 109: Middle East & Africa Dashboard Software Market Revenue (US$ Mn) Comparison by Organization Size (2016-2033)
- Table 110: Middle East & Africa Dashboard Software Market Revenue (US$ Mn) Comparison by Industry Vertical (2016-2033)
- Table 111: Middle East & Africa Dashboard Software Market Y-o-Y Growth Rate Comparison by Country (2016-2033)
- Table 112: Middle East & Africa Dashboard Software Market Y-o-Y Growth Rate Comparison by Deployment Type (2016-2033)
- Table 113: Middle East & Africa Dashboard Software Market Y-o-Y Growth Rate Comparison by Organization Size (2016-2033)
- Table 114: Middle East & Africa Dashboard Software Market Y-o-Y Growth Rate Comparison by Industry Vertical (2016-2033)
- Table 115: Middle East & Africa Dashboard Software Market Share Comparison by Country (2016-2033)
- Table 116: Middle East & Africa Dashboard Software Market Share Comparison by Deployment Type (2016-2033)
- Table 117: Middle East & Africa Dashboard Software Market Share Comparison by Organization Size (2016-2033)
- Table 118: Middle East & Africa Dashboard Software Market Share Comparison by Industry Vertical (2016-2033)
- 1. Executive Summary
-
- Tableau Software
- Microsoft Power BI
- QlikTech International AB
- SAP SE
- Domo, Inc.
- IBM Corporation
- Sisense Inc.
- TIBCO Software Inc.
- Yellowfin BI
- Oracle Corporation
- Zoho Corporation
- Dundas Data Visualization, Inc.
- Infor
- GoodData Corporation
- Looker Data Sciences, Inc
Our Clients


View Our Licence Options
