
Global Bubble Tea Market By Type (Green Tea, Black Tea, and Other), By Flavor (Original Flavor, Coffee Flavor and Other ), By Component, By Distribution Channel, By Region and Companies - Industry Segment Outlook, Market Assessment, Competition Scenario, Trends, and Forecast 2023-2032
-
5713
-
Aug
-
183
-


-
This report was compiled by Shreyas Rokade Shreyas Rokade is a seasoned Research Analyst with CMFE, bringing extensive expertise in market research and consulting, with a strong background in Chemical Engineering. Correspondence Team Lead-CMFE Linkedin | Detailed Market research Methodology Our methodology involves a mix of primary research, including interviews with leading mental health experts, and secondary research from reputable medical journals and databases. View Detailed Methodology Page
-
Quick Navigation
Report Overview
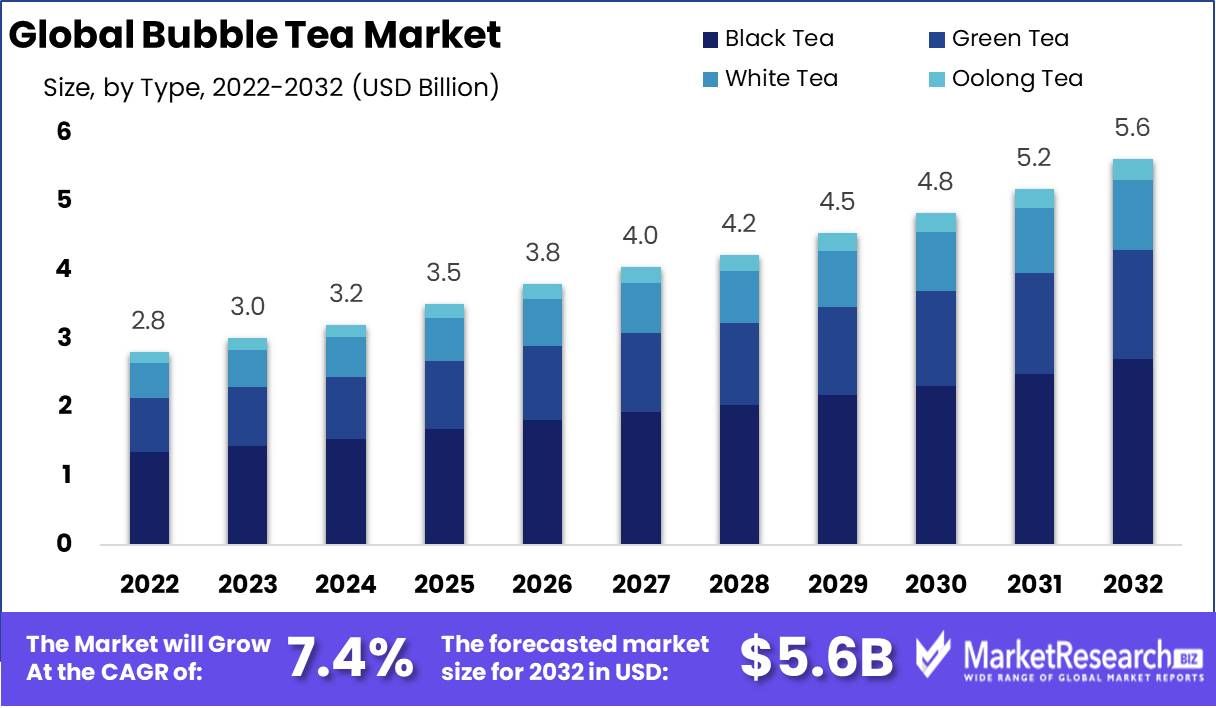
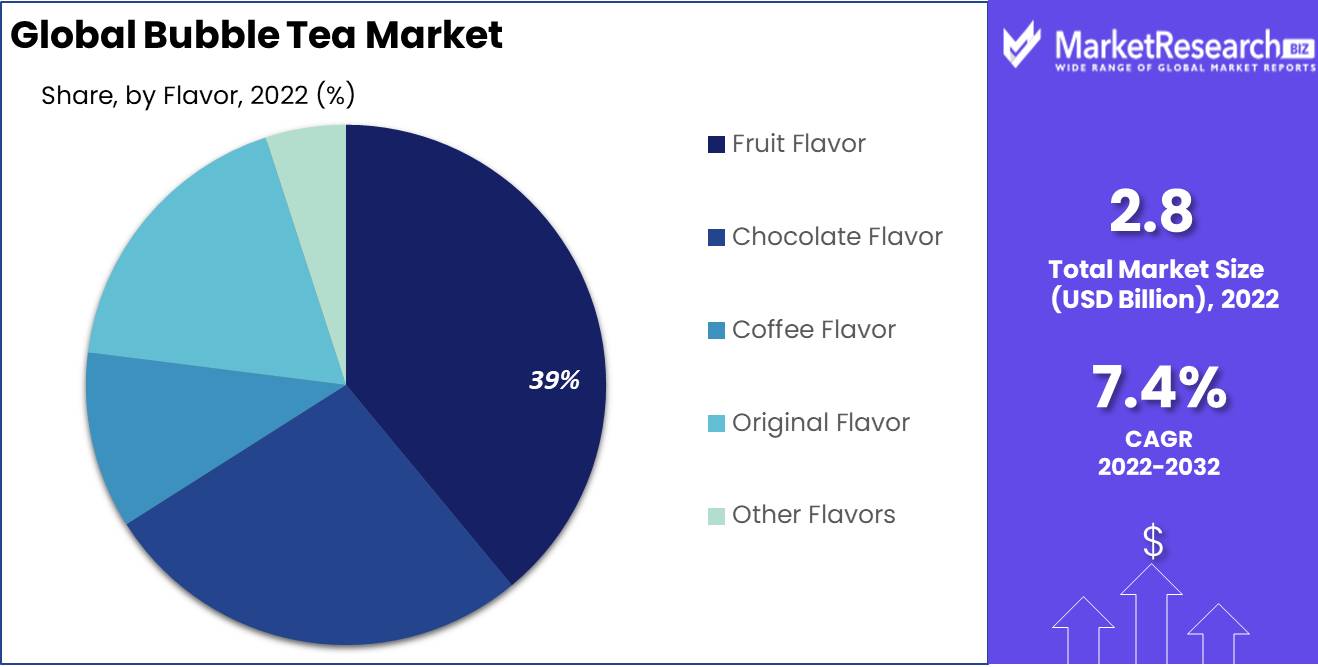
Global Bubble Tea market size is expected to be worth around USD 5.6 Bn by 2032 from USD 2.8 Bn in 2022, growing at a CAGR of 7.4%. during the forecast period from 2023 to 2032.
Bubble tea is a unique beverage that originated in Taichung, prepared by blending tea bases with milk, flavors, or sweeteners and then adding tapioca pearls. Bubble tea comes with zero fat and low-calorie contents, which boosts the demand for this beverage. Different ingredients are added to the bubble tea Market, making it available in a wide range of drinks.
The famous variety of bubble tea comes with bubble milk green tea with tapioca and bubble milk tea with tapioca balls. For giving different textures and flavors to the tea, different tapioca balls are used. Other flavors are Coffee Flavor, Fruit Flavor, Chocolate Flavor, and honeydew.
Type Analysis
Black tea dominated the market because of its health benefits.
Black tea Market dominated with the highest revenue share of 48% in 2022. The authentic natural flavor of black tea is increasing its growth. The segment growth is attributed due to health awareness and health benefits with its properties like strong antioxidant, antiaging, and anti-diabetic. Furthermore, the drink comes with zero fat and low-calorie content, which helps reduce bad cholesterol and blood sugar levels and improve gut health.
Followed by black tea, green tea held a significant market share in 2022, and this segment is expected to grow at the highest CAGR throughout the forecast period. The growth of the segment can be due to the rising awareness about the health benefits associated with the consumption of green tea. Healthy ingredients in green tea help prevent weight gain and also induce weight loss when consumed regularly.
Flavor Analysis
Fruit flavor dominated the market with high nutritional value
Based on flavor, the Bubble tea market is segmented into coffee, fruit, chocolate, original, and other flavors. The fruit flavor segment dominated the market with the largest revenue share of more than 39% in 2022 and is expected to uphold the top position over the forecast period. The high popularity of tea-based fruity beverages and their high nutritional value compared to other flavors dominated this segment. Flavor variants such as mango, lychee, peach, passion fruit, plum, strawberry, avocado, banana, lemon, grape, and kiwi are also in demand.
During the forecast period, chocolate-based drinks are expected to grow at the fastest rate because they are widely consumed by people of all ages. Due to the escalating demand for coffee as a healthy beverage, coffee flavor is also expected to hold a strong market share during the forecast period. In chocolate-flavored milk tea, chocolate powder is blended with milk to enhance its taste.
Component Analysis
Tapioca pearl dominated the market by providing the perfect texture.
Based on the components, the Bubble Tea market is segmented into creamer, sweetener, liquid, tapioca pearls, flavor, and other types. Tapioca pearl dominated the market due to its perfect texture. Having the perfect texture means not being too soft or too hard. The perfect chewiness is similar to that of a fresh gummy bear. Additionally, the drink should be tasty and smooth. It is important that cool beverages taste good and feel refreshing. It is important to serve warm beverages at the right temperature to keep one's body warm. There are a variety of flavors and textures available in bubble drinks.
Distribution Channel
Online Retailing Dominated the market by offering convenience to the consumer.
Based on the distribution channel, the Bubble Tea market is segmented into direct (B2B), direct (B2C), and Online Retail. The online retail segment dominated the market and is expected to grow at a CAGR of 12% during the forecast period. The online retail segment is growing due to consumer preference for the convenience it offers. Various bubble tea Market brands offer direct (B2B), and direct (B2C) product delivery that is arranged to be delivered at a specific time and pre-booked.
Key Market Segments
Type
- Green Tea
- Black Tea
- Oolong Tea
- White Tea
Flavor
- Original Flavor
- Coffee Flavor
- Fruit Flavor
- Chocolate Flavor
- Other Flavor
Component
- Creamer
- Sweetener
- Liquid
- Tapioca Pearls
- Flavor
- Other Types
Distribution Channel
- Direct (B2B)
- Direct (B2C)
- Online Retailing
Market Dynamics
Drivers
Increasing Adoption of Healthy Beverages is Driving the Market
Growing health awareness is inclining people towards healthy eating and drinking, adoption of healthy beverages such as black tea, green tea, white tea, and oolong tea among consumers is driving the market growth. The consumption of Bubble Tea market consumption helps to boost the energy and immune system, decline inflammation, and enhance cardiovascular health. The rise in the prevalence of diabetes, oral bacteria, and cardiovascular diseases is accelerating market growth.
Consumption of Tea
Tea has stimulating properties; hence it is consumed by the working-class population in large amounts to avoid sleep and increase concentration. The bubble Tea market comes with additional benefits, properties, and a variety of flavors than normal tea, so the preference for bubble tea is growing. Moreover, increased flavored bubble tea consumption among the young generation fuels the bubble tea market growth.
Restraints
High cost and coffee consumption trend
The trend of coffee consumption is expected to restrict the market growth. Bubble Tea market comes with lots of health benefits, but the excess sugar content in these drinks may not be preferable for diabetic patients. Also, the consumer preference towards organic beverages is supposed to hamper the market growth. The high cost of bubble tea components such as additives, preservatives, along sweeteners compared to normal tea is a challenge for market growth.
Opportunity
The Launch Of New Bubble Tea Flavors Anticipated To Create Enormous Growth Opportunities In Market
The emergence of new bubble tea flavors and the increasing preference of consumers for bubble tea create opportunities for market growth. The launch of new fruit flavors and blend versions is anticipated to create enormous growth opportunities in the market. Other flavors of bubble tea include ginger, almond, coffee, and others.
Moreover, different toppings such as ice cream, cookie crumbs, red bean, cheese cream, fresh fruit, and others can be added to the bubble tea. Various puddings such as caramel, barley, taro, mocha, rose, lavender, and others are available. All these factors are expected to create enormous growth opportunities in the upcoming years.
Trends
A positive outlook for the market is major growth in the global food and beverage industry. There is huge competition in restaurants and cafes. They are increasingly experimenting with food and beverages to provide their consumers with innovative variations of the beverage. An increase in the experiment of bubble tea with innovative flavor variations is on trend.
Other factors, such as consumers' rising expenditure capacities and the proliferation of social media, are predicted to drive market growth. Additionally, various product innovations, such as the launch of bubble teas in aesthetically appealing packaging and exotic flavors, are supporting the market growth.
Regional Analysis
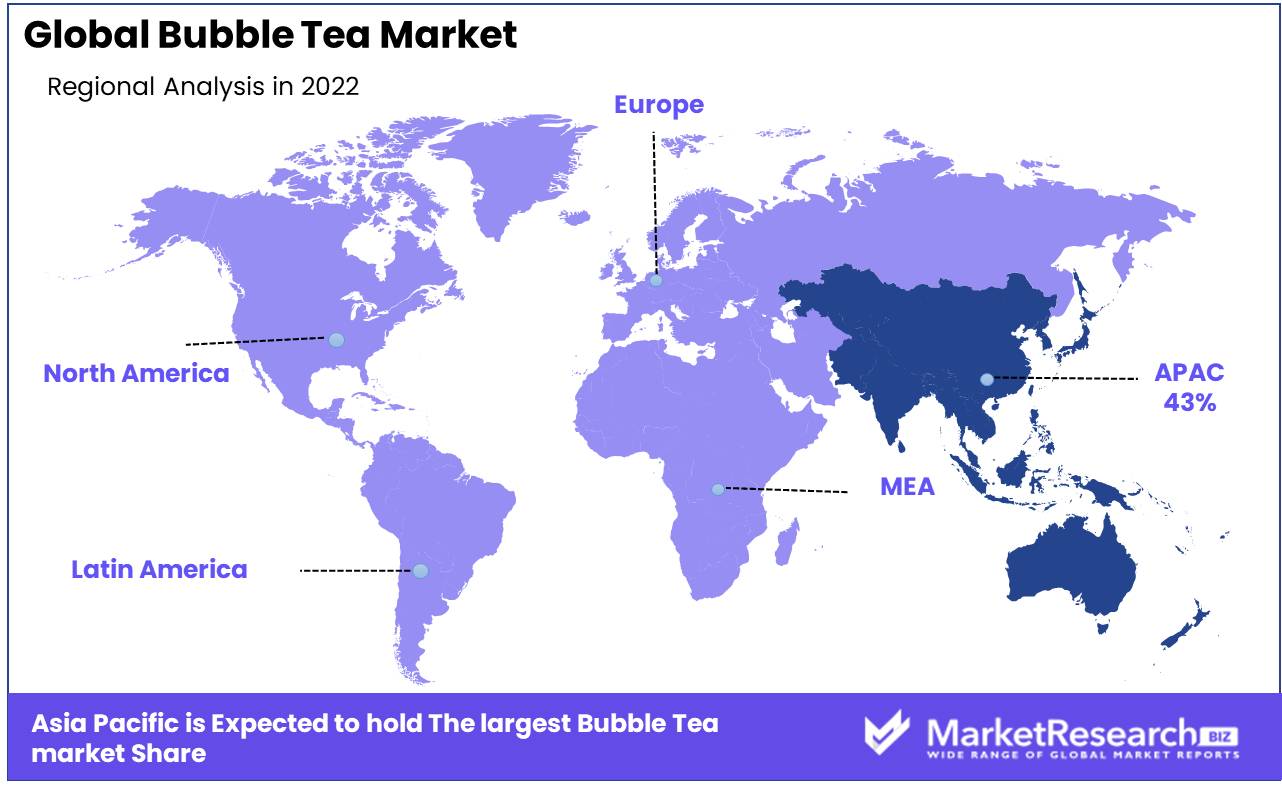
In 2022, APAC dominated the market with the largest revenue share of 43% and is anticipated to grow at a CAGR of 7.5% during the forecast period. There has been a rise in the number of tea consumers in APAC due to the rising millennial population and the growing popularity of bubble tea. Growth in the region is attributed to the high prevalence of tea culture in countries like India, Japan, China, South Korea, and others. Rising consumer awareness, consumer spending, and disposable income are anticipated to increase the market growth in this region.
North America holds the second-largest bubble tea market share in 2022. The growing health awareness about healthy eating and drinking, the popularity of fruity beverages, and the decline in carbonated demand will likely drive the demand for the Bubble Tea market in North America during the forecast period.
Key Regions
- North America
- The US
- Canada
- Mexico
- Western Europe
- Germany
- France
- The UK
- Spain
- Italy
- Portugal
- Ireland
- Austria
- Switzerland
- Benelux
- Nordic
- Rest of Western Europe
- Eastern Europe
- Russia
- Poland
- The Czech Republic
- Greece
- Rest of Eastern Europe
- APAC
- China
- Japan
- South Korea
- India
- Australia & New Zealand
- Indonesia
- Malaysia
- Philippines
- Singapore
- Thailand
- Vietnam
- Rest of APAC
- Latin America
- Brazil
- Colombia
- Chile
- Argentina
- Costa Rica
- Rest of Latin America
- Middle East & Africa
- Algeria
- Egypt
- Israel
- Kuwait
- Nigeria
- Saudi Arabia
- South Africa
- Turkey
- United Arab Emirates
- Rest of MEA
Key Players Analysis
Emerging key players are focused on a variety of strategic policies to develop their respective businesses in foreign markets. Several bubble tea market companies are concentrating on expanding their existing operations and R&D facilities.
In addition, several key players are now focusing on different marketing strategies, such as spreading awareness about natural ingredients, which is boosting the target products' growth.
Furthermore, companies are focusing on enhancing their product portfolio and business capacity, increasing competitive rivalry. Listed below are some of the most prominent Bubble Tea industry players.
Market Key Players
- Lollicup USA, Inc
- Bubble Tea Supply, Inc.
- Boba Loca USA Inc.
- Cuppotee
- BUBLUV, Inc.,
- Fokus Inc.
- Kung Fu Tea
- Kuaikeli Enterprise Co., Ltd.
- Fanale Drinks
- Sumos Sdn Bhd
- Boba Guys
- Coco Fresh
- Other key Players
Recent Developments
- In January 2023, beverage company BobaBam announced the launch of Milk Tea and Taro, its two new flavors. The specialty of these flavors is that they are completely gluten-free, vegan, and nut-free; they are also non-GMO.
- In April 2022, New York-based company, BUBLUV, Inc., announced the launch of BUBLUV Bubble Tea, which is the first ready-to-drink beverage of this company. The super refreshing and light sweet taste was the specialty of this beverage. This Bubble Tea is glutin-free and keto-friendly
Report Scope
Report Features Description Market Value (2022) US$ 2.8 Bn Forecast Revenue (2032) US$ 5.6 Bn CAGR (2023-2032) 7.4% Base Year for Estimation 2022 Historic Period 2016-2022 Forecast Period 2023-2032 Report Coverage Revenue Forecast, Market Dynamics, COVID-19 Impact, Competitive Landscape, Recent Developments Segments Covered By Type - Green Tea, Black Tea, Oolong Tea, and White Tea; By Flavor - Original Flavor, Coffee Flavor, Fruit Flavor, Chocolate Flavor, and Other Flavors; By Component- Creamer, Sweetener, Liquid, Tapioca Pearls, Flavor, and Other Types; By Distribution Channel- Direct (B2B), Direct (B2C), and Online Retailing Regional Analysis North America – The US, Canada, & Mexico; Western Europe – Germany, France, The UK, Spain, Italy, Portugal, Ireland, Austria, Switzerland, Benelux, Nordic, & Rest of Western Europe; Eastern Europe – Russia, Poland, The Czech Republic, Greece, & Rest of Eastern Europe; APAC – China, Japan, South Korea, India, Australia & New Zealand, Indonesia, Malaysia, Philippines, Singapore, Thailand, Vietnam, & Rest of APAC; Latin America – Brazil, Colombia, Chile, Argentina, Costa Rica, & Rest of Latin America; Middle East & Africa – Algeria, Egypt, Israel, Kuwait, Nigeria, Saudi Arabia, South Africa, Turkey, United Arab Emirates, & Rest of MEA Competitive Landscape Lollicup USA, Inc, Bubble Tea Supply, Inc., Boba Loca USA Inc., Cuppotee, BUBLUV, Inc., Fokus Inc., Kung Fu Tea, Kuaikeli Enterprise Co., Ltd., Fanale Drinks, Sumos Sdn Bhd, Boba Guys, Coco Fresh, and Other Key Players. Customization Scope Customization for segments, region/country-level will be provided. Moreover, additional customization can be done based on the requirements. Purchase Options We have three licenses to opt for: Single User License, Multi-User License (Up to 5 Users), Corporate Use License (Unlimited User and Printable PDF) -
- 1. Executive Summary
- 1.1. Definition
- 1.2. Taxonomy
- 1.3. Research Scope
- 1.4. Key Analysis
- 1.5. Key Findings by Major Segments
- 1.6. Top strategies by Major Players
- 2. Global Bubble Tea Market Overview
- 2.1. Bubble Tea Market Dynamics
- 2.1.1. Drivers
- 2.1.2. Opportunities
- 2.1.3. Restraints
- 2.1.4. Challenges
- 2.2. Macro-economic Factors
- 2.3. Regulatory Framework
- 2.4. Market Investment Feasibility Index
- 2.5. PEST Analysis
- 2.6. PORTER’S Five Force Analysis
- 2.7. Drivers & Restraints Impact Analysis
- 2.8. Industry Chain Analysis
- 2.9. Cost Structure Analysis
- 2.10. Marketing Strategy
- 2.11. Russia-Ukraine War Impact Analysis
- 2.12. Opportunity Map Analysis
- 2.13. Market Competition Scenario Analysis
- 2.14. Product Life Cycle Analysis
- 2.15. Opportunity Orbits
- 2.16. Manufacturer Intensity Map
- 2.17. Major Companies sales by Value & Volume
- 2.1. Bubble Tea Market Dynamics
- 3. Global Bubble Tea Market Analysis, Opportunity and Forecast, 2016-2032
- 3.1. Global Bubble Tea Market Analysis, 2016-2021
- 3.2. Global Bubble Tea Market Opportunity and Forecast, 2023-2032
- 3.3. Global Bubble Tea Market Analysis, Opportunity and Forecast, By Type, 2016-2032
- 3.3.1. Global Bubble Tea Market Analysis by Type: Introduction
- 3.3.2. Market Size Absolute $ Opportunity Analysis and Forecast, By Type, 2016-2032
- 3.3.3. Green Tea
- 3.3.4. Black Tea
- 3.3.5. Oolong Tea
- 3.3.6. White Tea
- 3.4. Global Bubble Tea Market Analysis, Opportunity and Forecast, By Flavour, 2016-2032
- 3.4.1. Global Bubble Tea Market Analysis by Flavour: Introduction
- 3.4.2. Market Size Absolute $ Opportunity Analysis and Forecast, By Flavour, 2016-2032
- 3.4.3. Original Flavour
- 3.4.4. Coffee Flavour
- 3.4.5. Fruit Flavour
- 3.4.6. Chocolate Flavour
- 3.4.7. Other Flavour
- 3.5. Global Bubble Tea Market Analysis, Opportunity and Forecast, By Component, 2016-2032
- 3.5.1. Global Bubble Tea Market Analysis by Component: Introduction
- 3.5.2. Market Size Absolute $ Opportunity Analysis and Forecast, By Component, 2016-2032
- 3.5.3. Creamer
- 3.5.4. Sweetener
- 3.5.5. Liquid
- 3.5.6. Tapioca Pearls
- 3.5.7. Flavour
- 3.5.8. Other Types
- 3.6. Global Bubble Tea Market Analysis, Opportunity and Forecast, By Distribution Channel, 2016-2032
- 3.6.1. Global Bubble Tea Market Analysis by Distribution Channel: Introduction
- 3.6.2. Market Size Absolute $ Opportunity Analysis and Forecast, By Distribution Channel, 2016-2032
- 3.6.3. Direct (B2B)
- 3.6.4. Direct (B2C)
- 3.6.5. Online Retailing
- 4. North America Bubble Tea Market Analysis, Opportunity and Forecast, 2016-2032
- 4.1. North America Bubble Tea Market Analysis, 2016-2021
- 4.2. North America Bubble Tea Market Opportunity and Forecast, 2023-2032
- 4.3. North America Bubble Tea Market Analysis, Opportunity and Forecast, By Type, 2016-2032
- 4.3.1. North America Bubble Tea Market Analysis by Type: Introduction
- 4.3.2. Market Size Absolute $ Opportunity Analysis and Forecast, By Type, 2016-2032
- 4.3.3. Green Tea
- 4.3.4. Black Tea
- 4.3.5. Oolong Tea
- 4.3.6. White Tea
- 4.4. North America Bubble Tea Market Analysis, Opportunity and Forecast, By Flavour, 2016-2032
- 4.4.1. North America Bubble Tea Market Analysis by Flavour: Introduction
- 4.4.2. Market Size Absolute $ Opportunity Analysis and Forecast, By Flavour, 2016-2032
- 4.4.3. Original Flavour
- 4.4.4. Coffee Flavour
- 4.4.5. Fruit Flavour
- 4.4.6. Chocolate Flavour
- 4.4.7. Other Flavour
- 4.5. North America Bubble Tea Market Analysis, Opportunity and Forecast, By Component, 2016-2032
- 4.5.1. North America Bubble Tea Market Analysis by Component: Introduction
- 4.5.2. Market Size Absolute $ Opportunity Analysis and Forecast, By Component, 2016-2032
- 4.5.3. Creamer
- 4.5.4. Sweetener
- 4.5.5. Liquid
- 4.5.6. Tapioca Pearls
- 4.5.7. Flavour
- 4.5.8. Other Types
- 4.6. North America Bubble Tea Market Analysis, Opportunity and Forecast, By Distribution Channel, 2016-2032
- 4.6.1. North America Bubble Tea Market Analysis by Distribution Channel: Introduction
- 4.6.2. Market Size Absolute $ Opportunity Analysis and Forecast, By Distribution Channel, 2016-2032
- 4.6.3. Direct (B2B)
- 4.6.4. Direct (B2C)
- 4.6.5. Online Retailing
- 4.7. North America Bubble Tea Market Analysis, Opportunity and Forecast, By Country , 2016-2032
- 4.7.1. North America Bubble Tea Market Analysis by Country : Introduction
- 4.7.2. Market Size Absolute $ Opportunity Analysis and Forecast, Country , 2016-2032
- 4.7.2.1. The US
- 4.7.2.2. Canada
- 4.7.2.3. Mexico
- 5. Western Europe Bubble Tea Market Analysis, Opportunity and Forecast, 2016-2032
- 5.1. Western Europe Bubble Tea Market Analysis, 2016-2021
- 5.2. Western Europe Bubble Tea Market Opportunity and Forecast, 2023-2032
- 5.3. Western Europe Bubble Tea Market Analysis, Opportunity and Forecast, By Type, 2016-2032
- 5.3.1. Western Europe Bubble Tea Market Analysis by Type: Introduction
- 5.3.2. Market Size Absolute $ Opportunity Analysis and Forecast, By Type, 2016-2032
- 5.3.3. Green Tea
- 5.3.4. Black Tea
- 5.3.5. Oolong Tea
- 5.3.6. White Tea
- 5.4. Western Europe Bubble Tea Market Analysis, Opportunity and Forecast, By Flavour, 2016-2032
- 5.4.1. Western Europe Bubble Tea Market Analysis by Flavour: Introduction
- 5.4.2. Market Size Absolute $ Opportunity Analysis and Forecast, By Flavour, 2016-2032
- 5.4.3. Original Flavour
- 5.4.4. Coffee Flavour
- 5.4.5. Fruit Flavour
- 5.4.6. Chocolate Flavour
- 5.4.7. Other Flavour
- 5.5. Western Europe Bubble Tea Market Analysis, Opportunity and Forecast, By Component, 2016-2032
- 5.5.1. Western Europe Bubble Tea Market Analysis by Component: Introduction
- 5.5.2. Market Size Absolute $ Opportunity Analysis and Forecast, By Component, 2016-2032
- 5.5.3. Creamer
- 5.5.4. Sweetener
- 5.5.5. Liquid
- 5.5.6. Tapioca Pearls
- 5.5.7. Flavour
- 5.5.8. Other Types
- 5.6. Western Europe Bubble Tea Market Analysis, Opportunity and Forecast, By Distribution Channel, 2016-2032
- 5.6.1. Western Europe Bubble Tea Market Analysis by Distribution Channel: Introduction
- 5.6.2. Market Size Absolute $ Opportunity Analysis and Forecast, By Distribution Channel, 2016-2032
- 5.6.3. Direct (B2B)
- 5.6.4. Direct (B2C)
- 5.6.5. Online Retailing
- 5.7. Western Europe Bubble Tea Market Analysis, Opportunity and Forecast, By Country , 2016-2032
- 5.7.1. Western Europe Bubble Tea Market Analysis by Country : Introduction
- 5.7.2. Market Size Absolute $ Opportunity Analysis and Forecast, Country , 2016-2032
- 5.7.2.1. Germany
- 5.7.2.2. France
- 5.7.2.3. The UK
- 5.7.2.4. Spain
- 5.7.2.5. Italy
- 5.7.2.6. Portugal
- 5.7.2.7. Ireland
- 5.7.2.8. Austria
- 5.7.2.9. Switzerland
- 5.7.2.10. Benelux
- 5.7.2.11. Nordic
- 5.7.2.12. Rest of Western Europe
- 6. Eastern Europe Bubble Tea Market Analysis, Opportunity and Forecast, 2016-2032
- 6.1. Eastern Europe Bubble Tea Market Analysis, 2016-2021
- 6.2. Eastern Europe Bubble Tea Market Opportunity and Forecast, 2023-2032
- 6.3. Eastern Europe Bubble Tea Market Analysis, Opportunity and Forecast, By Type, 2016-2032
- 6.3.1. Eastern Europe Bubble Tea Market Analysis by Type: Introduction
- 6.3.2. Market Size Absolute $ Opportunity Analysis and Forecast, By Type, 2016-2032
- 6.3.3. Green Tea
- 6.3.4. Black Tea
- 6.3.5. Oolong Tea
- 6.3.6. White Tea
- 6.4. Eastern Europe Bubble Tea Market Analysis, Opportunity and Forecast, By Flavour, 2016-2032
- 6.4.1. Eastern Europe Bubble Tea Market Analysis by Flavour: Introduction
- 6.4.2. Market Size Absolute $ Opportunity Analysis and Forecast, By Flavour, 2016-2032
- 6.4.3. Original Flavour
- 6.4.4. Coffee Flavour
- 6.4.5. Fruit Flavour
- 6.4.6. Chocolate Flavour
- 6.4.7. Other Flavour
- 6.5. Eastern Europe Bubble Tea Market Analysis, Opportunity and Forecast, By Component, 2016-2032
- 6.5.1. Eastern Europe Bubble Tea Market Analysis by Component: Introduction
- 6.5.2. Market Size Absolute $ Opportunity Analysis and Forecast, By Component, 2016-2032
- 6.5.3. Creamer
- 6.5.4. Sweetener
- 6.5.5. Liquid
- 6.5.6. Tapioca Pearls
- 6.5.7. Flavour
- 6.5.8. Other Types
- 6.6. Eastern Europe Bubble Tea Market Analysis, Opportunity and Forecast, By Distribution Channel, 2016-2032
- 6.6.1. Eastern Europe Bubble Tea Market Analysis by Distribution Channel: Introduction
- 6.6.2. Market Size Absolute $ Opportunity Analysis and Forecast, By Distribution Channel, 2016-2032
- 6.6.3. Direct (B2B)
- 6.6.4. Direct (B2C)
- 6.6.5. Online Retailing
- 6.7. Eastern Europe Bubble Tea Market Analysis, Opportunity and Forecast, By Country , 2016-2032
- 6.7.1. Eastern Europe Bubble Tea Market Analysis by Country : Introduction
- 6.7.2. Market Size Absolute $ Opportunity Analysis and Forecast, Country , 2016-2032
- 6.7.2.1. Russia
- 6.7.2.2. Poland
- 6.7.2.3. The Czech Republic
- 6.7.2.4. Greece
- 6.7.2.5. Rest of Eastern Europe
- 7. APAC Bubble Tea Market Analysis, Opportunity and Forecast, 2016-2032
- 7.1. APAC Bubble Tea Market Analysis, 2016-2021
- 7.2. APAC Bubble Tea Market Opportunity and Forecast, 2023-2032
- 7.3. APAC Bubble Tea Market Analysis, Opportunity and Forecast, By Type, 2016-2032
- 7.3.1. APAC Bubble Tea Market Analysis by Type: Introduction
- 7.3.2. Market Size Absolute $ Opportunity Analysis and Forecast, By Type, 2016-2032
- 7.3.3. Green Tea
- 7.3.4. Black Tea
- 7.3.5. Oolong Tea
- 7.3.6. White Tea
- 7.4. APAC Bubble Tea Market Analysis, Opportunity and Forecast, By Flavour, 2016-2032
- 7.4.1. APAC Bubble Tea Market Analysis by Flavour: Introduction
- 7.4.2. Market Size Absolute $ Opportunity Analysis and Forecast, By Flavour, 2016-2032
- 7.4.3. Original Flavour
- 7.4.4. Coffee Flavour
- 7.4.5. Fruit Flavour
- 7.4.6. Chocolate Flavour
- 7.4.7. Other Flavour
- 7.5. APAC Bubble Tea Market Analysis, Opportunity and Forecast, By Component, 2016-2032
- 7.5.1. APAC Bubble Tea Market Analysis by Component: Introduction
- 7.5.2. Market Size Absolute $ Opportunity Analysis and Forecast, By Component, 2016-2032
- 7.5.3. Creamer
- 7.5.4. Sweetener
- 7.5.5. Liquid
- 7.5.6. Tapioca Pearls
- 7.5.7. Flavour
- 7.5.8. Other Types
- 7.6. APAC Bubble Tea Market Analysis, Opportunity and Forecast, By Distribution Channel, 2016-2032
- 7.6.1. APAC Bubble Tea Market Analysis by Distribution Channel: Introduction
- 7.6.2. Market Size Absolute $ Opportunity Analysis and Forecast, By Distribution Channel, 2016-2032
- 7.6.3. Direct (B2B)
- 7.6.4. Direct (B2C)
- 7.6.5. Online Retailing
- 7.7. APAC Bubble Tea Market Analysis, Opportunity and Forecast, By Country , 2016-2032
- 7.7.1. APAC Bubble Tea Market Analysis by Country : Introduction
- 7.7.2. Market Size Absolute $ Opportunity Analysis and Forecast, Country , 2016-2032
- 7.7.2.1. China
- 7.7.2.2. Japan
- 7.7.2.3. South Korea
- 7.7.2.4. India
- 7.7.2.5. Australia & New Zeland
- 7.7.2.6. Indonesia
- 7.7.2.7. Malaysia
- 7.7.2.8. Philippines
- 7.7.2.9. Singapore
- 7.7.2.10. Thailand
- 7.7.2.11. Vietnam
- 7.7.2.12. Rest of APAC
- 8. Latin America Bubble Tea Market Analysis, Opportunity and Forecast, 2016-2032
- 8.1. Latin America Bubble Tea Market Analysis, 2016-2021
- 8.2. Latin America Bubble Tea Market Opportunity and Forecast, 2023-2032
- 8.3. Latin America Bubble Tea Market Analysis, Opportunity and Forecast, By Type, 2016-2032
- 8.3.1. Latin America Bubble Tea Market Analysis by Type: Introduction
- 8.3.2. Market Size Absolute $ Opportunity Analysis and Forecast, By Type, 2016-2032
- 8.3.3. Green Tea
- 8.3.4. Black Tea
- 8.3.5. Oolong Tea
- 8.3.6. White Tea
- 8.4. Latin America Bubble Tea Market Analysis, Opportunity and Forecast, By Flavour, 2016-2032
- 8.4.1. Latin America Bubble Tea Market Analysis by Flavour: Introduction
- 8.4.2. Market Size Absolute $ Opportunity Analysis and Forecast, By Flavour, 2016-2032
- 8.4.3. Original Flavour
- 8.4.4. Coffee Flavour
- 8.4.5. Fruit Flavour
- 8.4.6. Chocolate Flavour
- 8.4.7. Other Flavour
- 8.5. Latin America Bubble Tea Market Analysis, Opportunity and Forecast, By Component, 2016-2032
- 8.5.1. Latin America Bubble Tea Market Analysis by Component: Introduction
- 8.5.2. Market Size Absolute $ Opportunity Analysis and Forecast, By Component, 2016-2032
- 8.5.3. Creamer
- 8.5.4. Sweetener
- 8.5.5. Liquid
- 8.5.6. Tapioca Pearls
- 8.5.7. Flavour
- 8.5.8. Other Types
- 8.6. Latin America Bubble Tea Market Analysis, Opportunity and Forecast, By Distribution Channel, 2016-2032
- 8.6.1. Latin America Bubble Tea Market Analysis by Distribution Channel: Introduction
- 8.6.2. Market Size Absolute $ Opportunity Analysis and Forecast, By Distribution Channel, 2016-2032
- 8.6.3. Direct (B2B)
- 8.6.4. Direct (B2C)
- 8.6.5. Online Retailing
- 8.7. Latin America Bubble Tea Market Analysis, Opportunity and Forecast, By Country , 2016-2032
- 8.7.1. Latin America Bubble Tea Market Analysis by Country : Introduction
- 8.7.2. Market Size Absolute $ Opportunity Analysis and Forecast, Country , 2016-2032
- 8.7.2.1. Brazil
- 8.7.2.2. Colombia
- 8.7.2.3. Chile
- 8.7.2.4. Argentina
- 8.7.2.5. Costa Rica
- 8.7.2.6. Rest of Latin America
- 9. Middle East & Africa Bubble Tea Market Analysis, Opportunity and Forecast, 2016-2032
- 9.1. Middle East & Africa Bubble Tea Market Analysis, 2016-2021
- 9.2. Middle East & Africa Bubble Tea Market Opportunity and Forecast, 2023-2032
- 9.3. Middle East & Africa Bubble Tea Market Analysis, Opportunity and Forecast, By Type, 2016-2032
- 9.3.1. Middle East & Africa Bubble Tea Market Analysis by Type: Introduction
- 9.3.2. Market Size Absolute $ Opportunity Analysis and Forecast, By Type, 2016-2032
- 9.3.3. Green Tea
- 9.3.4. Black Tea
- 9.3.5. Oolong Tea
- 9.3.6. White Tea
- 9.4. Middle East & Africa Bubble Tea Market Analysis, Opportunity and Forecast, By Flavour, 2016-2032
- 9.4.1. Middle East & Africa Bubble Tea Market Analysis by Flavour: Introduction
- 9.4.2. Market Size Absolute $ Opportunity Analysis and Forecast, By Flavour, 2016-2032
- 9.4.3. Original Flavour
- 9.4.4. Coffee Flavour
- 9.4.5. Fruit Flavour
- 9.4.6. Chocolate Flavour
- 9.4.7. Other Flavour
- 9.5. Middle East & Africa Bubble Tea Market Analysis, Opportunity and Forecast, By Component, 2016-2032
- 9.5.1. Middle East & Africa Bubble Tea Market Analysis by Component: Introduction
- 9.5.2. Market Size Absolute $ Opportunity Analysis and Forecast, By Component, 2016-2032
- 9.5.3. Creamer
- 9.5.4. Sweetener
- 9.5.5. Liquid
- 9.5.6. Tapioca Pearls
- 9.5.7. Flavour
- 9.5.8. Other Types
- 9.6. Middle East & Africa Bubble Tea Market Analysis, Opportunity and Forecast, By Distribution Channel, 2016-2032
- 9.6.1. Middle East & Africa Bubble Tea Market Analysis by Distribution Channel: Introduction
- 9.6.2. Market Size Absolute $ Opportunity Analysis and Forecast, By Distribution Channel, 2016-2032
- 9.6.3. Direct (B2B)
- 9.6.4. Direct (B2C)
- 9.6.5. Online Retailing
- 9.7. Middle East & Africa Bubble Tea Market Analysis, Opportunity and Forecast, By Country , 2016-2032
- 9.7.1. Middle East & Africa Bubble Tea Market Analysis by Country : Introduction
- 9.7.2. Market Size Absolute $ Opportunity Analysis and Forecast, Country , 2016-2032
- 9.7.2.1. Algeria
- 9.7.2.2. Egypt
- 9.7.2.3. Israel
- 9.7.2.4. Kuwait
- 9.7.2.5. Nigeria
- 9.7.2.6. Saudi Arabia
- 9.7.2.7. South Africa
- 9.7.2.8. Turkey
- 9.7.2.9. The UAE
- 9.7.2.10. Rest of MEA
- 10. Global Bubble Tea Market Analysis, Opportunity and Forecast, By Region , 2016-2032
- 10.1. Global Bubble Tea Market Analysis by Region : Introduction
- 10.2. Market Size Absolute $ Opportunity Analysis and Forecast, By Region , 2016-2032
- 10.2.1. North America
- 10.2.2. Western Europe
- 10.2.3. Eastern Europe
- 10.2.4. APAC
- 10.2.5. Latin America
- 10.2.6. Middle East & Africa
- 11. Global Bubble Tea Market Competitive Landscape, Market Share Analysis, and Company Profiles
- 11.1. Market Share Analysis
- 11.2. Company Profiles
- 11.3. Lollicup USA, Inc
- 11.3.1. Company Overview
- 11.3.2. Financial Highlights
- 11.3.3. Product Portfolio
- 11.3.4. SWOT Analysis
- 11.3.5. Key Strategies and Developments
- 11.4. Bubble Tea Supply,Inc.
- 11.4.1. Company Overview
- 11.4.2. Financial Highlights
- 11.4.3. Product Portfolio
- 11.4.4. SWOT Analysis
- 11.4.5. Key Strategies and Developments
- 11.5. Boba Loca USA Inc.
- 11.5.1. Company Overview
- 11.5.2. Financial Highlights
- 11.5.3. Product Portfolio
- 11.5.4. SWOT Analysis
- 11.5.5. Key Strategies and Developments
- 11.6. Cuppotee
- 11.6.1. Company Overview
- 11.6.2. Financial Highlights
- 11.6.3. Product Portfolio
- 11.6.4. SWOT Analysis
- 11.6.5. Key Strategies and Developments
- 11.7. Fokus Inc.
- 11.7.1. Company Overview
- 11.7.2. Financial Highlights
- 11.7.3. Product Portfolio
- 11.7.4. SWOT Analysis
- 11.7.5. Key Strategies and Developments
- 11.8. Kung Fu Tea
- 11.8.1. Company Overview
- 11.8.2. Financial Highlights
- 11.8.3. Product Portfolio
- 11.8.4. SWOT Analysis
- 11.8.5. Key Strategies and Developments
- 11.9. Kuaikeli Enterprise co., Ltd.
- 11.9.1. Company Overview
- 11.9.2. Financial Highlights
- 11.9.3. Product Portfolio
- 11.9.4. SWOT Analysis
- 11.9.5. Key Strategies and Developments
- 11.10. Fanale Drinks
- 11.10.1. Company Overview
- 11.10.2. Financial Highlights
- 11.10.3. Product Portfolio
- 11.10.4. SWOT Analysis
- 11.10.5. Key Strategies and Developments
- 11.11. Sumos Sdn Bhd
- 11.11.1. Company Overview
- 11.11.2. Financial Highlights
- 11.11.3. Product Portfolio
- 11.11.4. SWOT Analysis
- 11.11.5. Key Strategies and Developments
- 11.12. Boba Guys
- 11.12.1. Company Overview
- 11.12.2. Financial Highlights
- 11.12.3. Product Portfolio
- 11.12.4. SWOT Analysis
- 11.12.5. Key Strategies and Developments
- 11.13. Coco Fresh
- 11.13.1. Company Overview
- 11.13.2. Financial Highlights
- 11.13.3. Product Portfolio
- 11.13.4. SWOT Analysis
- 11.13.5. Key Strategies and Developments
- 11.14. BUBLUV, Inc.,
- 11.14.1. Company Overview
- 11.14.2. Financial Highlights
- 11.14.3. Product Portfolio
- 11.14.4. SWOT Analysis
- 11.14.5. Key Strategies and Developments
- 11.15. Other key Players
- 11.15.1. Company Overview
- 11.15.2. Financial Highlights
- 11.15.3. Product Portfolio
- 11.15.4. SWOT Analysis
- 11.15.5. Key Strategies and Developments
- 12. Assumptions and Acronyms
- 13. Research Methodology
- 14. Contact
- List of Figures
- Figure 1: Global Bubble Tea Market Revenue (US$ Mn) Market Share by Type in 2022
- Figure 2: Global Bubble Tea Market Attractiveness Analysis by Type, 2016-2032
- Figure 3: Global Bubble Tea Market Revenue (US$ Mn) Market Share by Flavourin 2022
- Figure 4: Global Bubble Tea Market Attractiveness Analysis by Flavour, 2016-2032
- Figure 5: Global Bubble Tea Market Revenue (US$ Mn) Market Share by Componentin 2022
- Figure 6: Global Bubble Tea Market Attractiveness Analysis by Component, 2016-2032
- Figure 7: Global Bubble Tea Market Revenue (US$ Mn) Market Share by Distribution Channelin 2022
- Figure 8: Global Bubble Tea Market Attractiveness Analysis by Distribution Channel, 2016-2032
- Figure 9: Global Bubble Tea Market Revenue (US$ Mn) Market Share by Region in 2022
- Figure 10: Global Bubble Tea Market Attractiveness Analysis by Region, 2016-2032
- Figure 11: Global Bubble Tea Market Revenue (US$ Mn) (2016-2032)
- Figure 12: Global Bubble Tea Market Revenue (US$ Mn) Comparison by Region (2016-2032)
- Figure 13: Global Bubble Tea Market Revenue (US$ Mn) Comparison by Type (2016-2032)
- Figure 14: Global Bubble Tea Market Revenue (US$ Mn) Comparison by Flavour (2016-2032)
- Figure 15: Global Bubble Tea Market Revenue (US$ Mn) Comparison by Component (2016-2032)
- Figure 16: Global Bubble Tea Market Revenue (US$ Mn) Comparison by Distribution Channel (2016-2032)
- Figure 17: Global Bubble Tea Market Y-o-Y Growth Rate Comparison by Region (2016-2032)
- Figure 18: Global Bubble Tea Market Y-o-Y Growth Rate Comparison by Type (2016-2032)
- Figure 19: Global Bubble Tea Market Y-o-Y Growth Rate Comparison by Flavour (2016-2032)
- Figure 20: Global Bubble Tea Market Y-o-Y Growth Rate Comparison by Component (2016-2032)
- Figure 21: Global Bubble Tea Market Y-o-Y Growth Rate Comparison by Distribution Channel (2016-2032)
- Figure 22: Global Bubble Tea Market Share Comparison by Region (2016-2032)
- Figure 23: Global Bubble Tea Market Share Comparison by Type (2016-2032)
- Figure 24: Global Bubble Tea Market Share Comparison by Flavour (2016-2032)
- Figure 25: Global Bubble Tea Market Share Comparison by Component (2016-2032)
- Figure 26: Global Bubble Tea Market Share Comparison by Distribution Channel (2016-2032)
- Figure 27: North America Bubble Tea Market Revenue (US$ Mn) Market Share by Typein 2022
- Figure 28: North America Bubble Tea Market Attractiveness Analysis by Type, 2016-2032
- Figure 29: North America Bubble Tea Market Revenue (US$ Mn) Market Share by Flavourin 2022
- Figure 30: North America Bubble Tea Market Attractiveness Analysis by Flavour, 2016-2032
- Figure 31: North America Bubble Tea Market Revenue (US$ Mn) Market Share by Componentin 2022
- Figure 32: North America Bubble Tea Market Attractiveness Analysis by Component, 2016-2032
- Figure 33: North America Bubble Tea Market Revenue (US$ Mn) Market Share by Distribution Channelin 2022
- Figure 34: North America Bubble Tea Market Attractiveness Analysis by Distribution Channel, 2016-2032
- Figure 35: North America Bubble Tea Market Revenue (US$ Mn) Market Share by Country in 2022
- Figure 36: North America Bubble Tea Market Attractiveness Analysis by Country, 2016-2032
- Figure 37: North America Bubble Tea Market Revenue (US$ Mn) (2016-2032)
- Figure 38: North America Bubble Tea Market Revenue (US$ Mn) Comparison by Country (2016-2032)
- Figure 39: North America Bubble Tea Market Revenue (US$ Mn) Comparison by Type (2016-2032)
- Figure 40: North America Bubble Tea Market Revenue (US$ Mn) Comparison by Flavour (2016-2032)
- Figure 41: North America Bubble Tea Market Revenue (US$ Mn) Comparison by Component (2016-2032)
- Figure 42: North America Bubble Tea Market Revenue (US$ Mn) Comparison by Distribution Channel (2016-2032)
- Figure 43: North America Bubble Tea Market Y-o-Y Growth Rate Comparison by Country (2016-2032)
- Figure 44: North America Bubble Tea Market Y-o-Y Growth Rate Comparison by Type (2016-2032)
- Figure 45: North America Bubble Tea Market Y-o-Y Growth Rate Comparison by Flavour (2016-2032)
- Figure 46: North America Bubble Tea Market Y-o-Y Growth Rate Comparison by Component (2016-2032)
- Figure 47: North America Bubble Tea Market Y-o-Y Growth Rate Comparison by Distribution Channel (2016-2032)
- Figure 48: North America Bubble Tea Market Share Comparison by Country (2016-2032)
- Figure 49: North America Bubble Tea Market Share Comparison by Type (2016-2032)
- Figure 50: North America Bubble Tea Market Share Comparison by Flavour (2016-2032)
- Figure 51: North America Bubble Tea Market Share Comparison by Component (2016-2032)
- Figure 52: North America Bubble Tea Market Share Comparison by Distribution Channel (2016-2032)
- Figure 53: Western Europe Bubble Tea Market Revenue (US$ Mn) Market Share by Typein 2022
- Figure 54: Western Europe Bubble Tea Market Attractiveness Analysis by Type, 2016-2032
- Figure 55: Western Europe Bubble Tea Market Revenue (US$ Mn) Market Share by Flavourin 2022
- Figure 56: Western Europe Bubble Tea Market Attractiveness Analysis by Flavour, 2016-2032
- Figure 57: Western Europe Bubble Tea Market Revenue (US$ Mn) Market Share by Componentin 2022
- Figure 58: Western Europe Bubble Tea Market Attractiveness Analysis by Component, 2016-2032
- Figure 59: Western Europe Bubble Tea Market Revenue (US$ Mn) Market Share by Distribution Channelin 2022
- Figure 60: Western Europe Bubble Tea Market Attractiveness Analysis by Distribution Channel, 2016-2032
- Figure 61: Western Europe Bubble Tea Market Revenue (US$ Mn) Market Share by Country in 2022
- Figure 62: Western Europe Bubble Tea Market Attractiveness Analysis by Country, 2016-2032
- Figure 63: Western Europe Bubble Tea Market Revenue (US$ Mn) (2016-2032)
- Figure 64: Western Europe Bubble Tea Market Revenue (US$ Mn) Comparison by Country (2016-2032)
- Figure 65: Western Europe Bubble Tea Market Revenue (US$ Mn) Comparison by Type (2016-2032)
- Figure 66: Western Europe Bubble Tea Market Revenue (US$ Mn) Comparison by Flavour (2016-2032)
- Figure 67: Western Europe Bubble Tea Market Revenue (US$ Mn) Comparison by Component (2016-2032)
- Figure 68: Western Europe Bubble Tea Market Revenue (US$ Mn) Comparison by Distribution Channel (2016-2032)
- Figure 69: Western Europe Bubble Tea Market Y-o-Y Growth Rate Comparison by Country (2016-2032)
- Figure 70: Western Europe Bubble Tea Market Y-o-Y Growth Rate Comparison by Type (2016-2032)
- Figure 71: Western Europe Bubble Tea Market Y-o-Y Growth Rate Comparison by Flavour (2016-2032)
- Figure 72: Western Europe Bubble Tea Market Y-o-Y Growth Rate Comparison by Component (2016-2032)
- Figure 73: Western Europe Bubble Tea Market Y-o-Y Growth Rate Comparison by Distribution Channel (2016-2032)
- Figure 74: Western Europe Bubble Tea Market Share Comparison by Country (2016-2032)
- Figure 75: Western Europe Bubble Tea Market Share Comparison by Type (2016-2032)
- Figure 76: Western Europe Bubble Tea Market Share Comparison by Flavour (2016-2032)
- Figure 77: Western Europe Bubble Tea Market Share Comparison by Component (2016-2032)
- Figure 78: Western Europe Bubble Tea Market Share Comparison by Distribution Channel (2016-2032)
- Figure 79: Eastern Europe Bubble Tea Market Revenue (US$ Mn) Market Share by Typein 2022
- Figure 80: Eastern Europe Bubble Tea Market Attractiveness Analysis by Type, 2016-2032
- Figure 81: Eastern Europe Bubble Tea Market Revenue (US$ Mn) Market Share by Flavourin 2022
- Figure 82: Eastern Europe Bubble Tea Market Attractiveness Analysis by Flavour, 2016-2032
- Figure 83: Eastern Europe Bubble Tea Market Revenue (US$ Mn) Market Share by Componentin 2022
- Figure 84: Eastern Europe Bubble Tea Market Attractiveness Analysis by Component, 2016-2032
- Figure 85: Eastern Europe Bubble Tea Market Revenue (US$ Mn) Market Share by Distribution Channelin 2022
- Figure 86: Eastern Europe Bubble Tea Market Attractiveness Analysis by Distribution Channel, 2016-2032
- Figure 87: Eastern Europe Bubble Tea Market Revenue (US$ Mn) Market Share by Country in 2022
- Figure 88: Eastern Europe Bubble Tea Market Attractiveness Analysis by Country, 2016-2032
- Figure 89: Eastern Europe Bubble Tea Market Revenue (US$ Mn) (2016-2032)
- Figure 90: Eastern Europe Bubble Tea Market Revenue (US$ Mn) Comparison by Country (2016-2032)
- Figure 91: Eastern Europe Bubble Tea Market Revenue (US$ Mn) Comparison by Type (2016-2032)
- Figure 92: Eastern Europe Bubble Tea Market Revenue (US$ Mn) Comparison by Flavour (2016-2032)
- Figure 93: Eastern Europe Bubble Tea Market Revenue (US$ Mn) Comparison by Component (2016-2032)
- Figure 94: Eastern Europe Bubble Tea Market Revenue (US$ Mn) Comparison by Distribution Channel (2016-2032)
- Figure 95: Eastern Europe Bubble Tea Market Y-o-Y Growth Rate Comparison by Country (2016-2032)
- Figure 96: Eastern Europe Bubble Tea Market Y-o-Y Growth Rate Comparison by Type (2016-2032)
- Figure 97: Eastern Europe Bubble Tea Market Y-o-Y Growth Rate Comparison by Flavour (2016-2032)
- Figure 98: Eastern Europe Bubble Tea Market Y-o-Y Growth Rate Comparison by Component (2016-2032)
- Figure 99: Eastern Europe Bubble Tea Market Y-o-Y Growth Rate Comparison by Distribution Channel (2016-2032)
- Figure 100: Eastern Europe Bubble Tea Market Share Comparison by Country (2016-2032)
- Figure 101: Eastern Europe Bubble Tea Market Share Comparison by Type (2016-2032)
- Figure 102: Eastern Europe Bubble Tea Market Share Comparison by Flavour (2016-2032)
- Figure 103: Eastern Europe Bubble Tea Market Share Comparison by Component (2016-2032)
- Figure 104: Eastern Europe Bubble Tea Market Share Comparison by Distribution Channel (2016-2032)
- Figure 105: APAC Bubble Tea Market Revenue (US$ Mn) Market Share by Typein 2022
- Figure 106: APAC Bubble Tea Market Attractiveness Analysis by Type, 2016-2032
- Figure 107: APAC Bubble Tea Market Revenue (US$ Mn) Market Share by Flavourin 2022
- Figure 108: APAC Bubble Tea Market Attractiveness Analysis by Flavour, 2016-2032
- Figure 109: APAC Bubble Tea Market Revenue (US$ Mn) Market Share by Componentin 2022
- Figure 110: APAC Bubble Tea Market Attractiveness Analysis by Component, 2016-2032
- Figure 111: APAC Bubble Tea Market Revenue (US$ Mn) Market Share by Distribution Channelin 2022
- Figure 112: APAC Bubble Tea Market Attractiveness Analysis by Distribution Channel, 2016-2032
- Figure 113: APAC Bubble Tea Market Revenue (US$ Mn) Market Share by Country in 2022
- Figure 114: APAC Bubble Tea Market Attractiveness Analysis by Country, 2016-2032
- Figure 115: APAC Bubble Tea Market Revenue (US$ Mn) (2016-2032)
- Figure 116: APAC Bubble Tea Market Revenue (US$ Mn) Comparison by Country (2016-2032)
- Figure 117: APAC Bubble Tea Market Revenue (US$ Mn) Comparison by Type (2016-2032)
- Figure 118: APAC Bubble Tea Market Revenue (US$ Mn) Comparison by Flavour (2016-2032)
- Figure 119: APAC Bubble Tea Market Revenue (US$ Mn) Comparison by Component (2016-2032)
- Figure 120: APAC Bubble Tea Market Revenue (US$ Mn) Comparison by Distribution Channel (2016-2032)
- Figure 121: APAC Bubble Tea Market Y-o-Y Growth Rate Comparison by Country (2016-2032)
- Figure 122: APAC Bubble Tea Market Y-o-Y Growth Rate Comparison by Type (2016-2032)
- Figure 123: APAC Bubble Tea Market Y-o-Y Growth Rate Comparison by Flavour (2016-2032)
- Figure 124: APAC Bubble Tea Market Y-o-Y Growth Rate Comparison by Component (2016-2032)
- Figure 125: APAC Bubble Tea Market Y-o-Y Growth Rate Comparison by Distribution Channel (2016-2032)
- Figure 126: APAC Bubble Tea Market Share Comparison by Country (2016-2032)
- Figure 127: APAC Bubble Tea Market Share Comparison by Type (2016-2032)
- Figure 128: APAC Bubble Tea Market Share Comparison by Flavour (2016-2032)
- Figure 129: APAC Bubble Tea Market Share Comparison by Component (2016-2032)
- Figure 130: APAC Bubble Tea Market Share Comparison by Distribution Channel (2016-2032)
- Figure 131: Latin America Bubble Tea Market Revenue (US$ Mn) Market Share by Typein 2022
- Figure 132: Latin America Bubble Tea Market Attractiveness Analysis by Type, 2016-2032
- Figure 133: Latin America Bubble Tea Market Revenue (US$ Mn) Market Share by Flavourin 2022
- Figure 134: Latin America Bubble Tea Market Attractiveness Analysis by Flavour, 2016-2032
- Figure 135: Latin America Bubble Tea Market Revenue (US$ Mn) Market Share by Componentin 2022
- Figure 136: Latin America Bubble Tea Market Attractiveness Analysis by Component, 2016-2032
- Figure 137: Latin America Bubble Tea Market Revenue (US$ Mn) Market Share by Distribution Channelin 2022
- Figure 138: Latin America Bubble Tea Market Attractiveness Analysis by Distribution Channel, 2016-2032
- Figure 139: Latin America Bubble Tea Market Revenue (US$ Mn) Market Share by Country in 2022
- Figure 140: Latin America Bubble Tea Market Attractiveness Analysis by Country, 2016-2032
- Figure 141: Latin America Bubble Tea Market Revenue (US$ Mn) (2016-2032)
- Figure 142: Latin America Bubble Tea Market Revenue (US$ Mn) Comparison by Country (2016-2032)
- Figure 143: Latin America Bubble Tea Market Revenue (US$ Mn) Comparison by Type (2016-2032)
- Figure 144: Latin America Bubble Tea Market Revenue (US$ Mn) Comparison by Flavour (2016-2032)
- Figure 145: Latin America Bubble Tea Market Revenue (US$ Mn) Comparison by Component (2016-2032)
- Figure 146: Latin America Bubble Tea Market Revenue (US$ Mn) Comparison by Distribution Channel (2016-2032)
- Figure 147: Latin America Bubble Tea Market Y-o-Y Growth Rate Comparison by Country (2016-2032)
- Figure 148: Latin America Bubble Tea Market Y-o-Y Growth Rate Comparison by Type (2016-2032)
- Figure 149: Latin America Bubble Tea Market Y-o-Y Growth Rate Comparison by Flavour (2016-2032)
- Figure 150: Latin America Bubble Tea Market Y-o-Y Growth Rate Comparison by Component (2016-2032)
- Figure 151: Latin America Bubble Tea Market Y-o-Y Growth Rate Comparison by Distribution Channel (2016-2032)
- Figure 152: Latin America Bubble Tea Market Share Comparison by Country (2016-2032)
- Figure 153: Latin America Bubble Tea Market Share Comparison by Type (2016-2032)
- Figure 154: Latin America Bubble Tea Market Share Comparison by Flavour (2016-2032)
- Figure 155: Latin America Bubble Tea Market Share Comparison by Component (2016-2032)
- Figure 156: Latin America Bubble Tea Market Share Comparison by Distribution Channel (2016-2032)
- Figure 157: Middle East & Africa Bubble Tea Market Revenue (US$ Mn) Market Share by Typein 2022
- Figure 158: Middle East & Africa Bubble Tea Market Attractiveness Analysis by Type, 2016-2032
- Figure 159: Middle East & Africa Bubble Tea Market Revenue (US$ Mn) Market Share by Flavourin 2022
- Figure 160: Middle East & Africa Bubble Tea Market Attractiveness Analysis by Flavour, 2016-2032
- Figure 161: Middle East & Africa Bubble Tea Market Revenue (US$ Mn) Market Share by Componentin 2022
- Figure 162: Middle East & Africa Bubble Tea Market Attractiveness Analysis by Component, 2016-2032
- Figure 163: Middle East & Africa Bubble Tea Market Revenue (US$ Mn) Market Share by Distribution Channelin 2022
- Figure 164: Middle East & Africa Bubble Tea Market Attractiveness Analysis by Distribution Channel, 2016-2032
- Figure 165: Middle East & Africa Bubble Tea Market Revenue (US$ Mn) Market Share by Country in 2022
- Figure 166: Middle East & Africa Bubble Tea Market Attractiveness Analysis by Country, 2016-2032
- Figure 167: Middle East & Africa Bubble Tea Market Revenue (US$ Mn) (2016-2032)
- Figure 168: Middle East & Africa Bubble Tea Market Revenue (US$ Mn) Comparison by Country (2016-2032)
- Figure 169: Middle East & Africa Bubble Tea Market Revenue (US$ Mn) Comparison by Type (2016-2032)
- Figure 170: Middle East & Africa Bubble Tea Market Revenue (US$ Mn) Comparison by Flavour (2016-2032)
- Figure 171: Middle East & Africa Bubble Tea Market Revenue (US$ Mn) Comparison by Component (2016-2032)
- Figure 172: Middle East & Africa Bubble Tea Market Revenue (US$ Mn) Comparison by Distribution Channel (2016-2032)
- Figure 173: Middle East & Africa Bubble Tea Market Y-o-Y Growth Rate Comparison by Country (2016-2032)
- Figure 174: Middle East & Africa Bubble Tea Market Y-o-Y Growth Rate Comparison by Type (2016-2032)
- Figure 175: Middle East & Africa Bubble Tea Market Y-o-Y Growth Rate Comparison by Flavour (2016-2032)
- Figure 176: Middle East & Africa Bubble Tea Market Y-o-Y Growth Rate Comparison by Component (2016-2032)
- Figure 177: Middle East & Africa Bubble Tea Market Y-o-Y Growth Rate Comparison by Distribution Channel (2016-2032)
- Figure 178: Middle East & Africa Bubble Tea Market Share Comparison by Country (2016-2032)
- Figure 179: Middle East & Africa Bubble Tea Market Share Comparison by Type (2016-2032)
- Figure 180: Middle East & Africa Bubble Tea Market Share Comparison by Flavour (2016-2032)
- Figure 181: Middle East & Africa Bubble Tea Market Share Comparison by Component (2016-2032)
- Figure 182: Middle East & Africa Bubble Tea Market Share Comparison by Distribution Channel (2016-2032)
List of Tables
- Table 1: Global Bubble Tea Market Comparison by Type (2016-2032)
- Table 2: Global Bubble Tea Market Comparison by Flavour (2016-2032)
- Table 3: Global Bubble Tea Market Comparison by Component (2016-2032)
- Table 4: Global Bubble Tea Market Comparison by Distribution Channel (2016-2032)
- Table 5: Global Bubble Tea Market Revenue (US$ Mn) Comparison by Region (2016-2032)
- Table 6: Global Bubble Tea Market Revenue (US$ Mn) (2016-2032)
- Table 7: Global Bubble Tea Market Revenue (US$ Mn) Comparison by Region (2016-2032)
- Table 8: Global Bubble Tea Market Revenue (US$ Mn) Comparison by Type (2016-2032)
- Table 9: Global Bubble Tea Market Revenue (US$ Mn) Comparison by Flavour (2016-2032)
- Table 10: Global Bubble Tea Market Revenue (US$ Mn) Comparison by Component (2016-2032)
- Table 11: Global Bubble Tea Market Revenue (US$ Mn) Comparison by Distribution Channel (2016-2032)
- Table 12: Global Bubble Tea Market Y-o-Y Growth Rate Comparison by Region (2016-2032)
- Table 13: Global Bubble Tea Market Y-o-Y Growth Rate Comparison by Type (2016-2032)
- Table 14: Global Bubble Tea Market Y-o-Y Growth Rate Comparison by Flavour (2016-2032)
- Table 15: Global Bubble Tea Market Y-o-Y Growth Rate Comparison by Component (2016-2032)
- Table 16: Global Bubble Tea Market Y-o-Y Growth Rate Comparison by Distribution Channel (2016-2032)
- Table 17: Global Bubble Tea Market Share Comparison by Region (2016-2032)
- Table 18: Global Bubble Tea Market Share Comparison by Type (2016-2032)
- Table 19: Global Bubble Tea Market Share Comparison by Flavour (2016-2032)
- Table 20: Global Bubble Tea Market Share Comparison by Component (2016-2032)
- Table 21: Global Bubble Tea Market Share Comparison by Distribution Channel (2016-2032)
- Table 22: North America Bubble Tea Market Comparison by Flavour (2016-2032)
- Table 23: North America Bubble Tea Market Comparison by Component (2016-2032)
- Table 24: North America Bubble Tea Market Comparison by Distribution Channel (2016-2032)
- Table 25: North America Bubble Tea Market Revenue (US$ Mn) Comparison by Country (2016-2032)
- Table 26: North America Bubble Tea Market Revenue (US$ Mn) (2016-2032)
- Table 27: North America Bubble Tea Market Revenue (US$ Mn) Comparison by Country (2016-2032)
- Table 28: North America Bubble Tea Market Revenue (US$ Mn) Comparison by Type (2016-2032)
- Table 29: North America Bubble Tea Market Revenue (US$ Mn) Comparison by Flavour (2016-2032)
- Table 30: North America Bubble Tea Market Revenue (US$ Mn) Comparison by Component (2016-2032)
- Table 31: North America Bubble Tea Market Revenue (US$ Mn) Comparison by Distribution Channel (2016-2032)
- Table 32: North America Bubble Tea Market Y-o-Y Growth Rate Comparison by Country (2016-2032)
- Table 33: North America Bubble Tea Market Y-o-Y Growth Rate Comparison by Type (2016-2032)
- Table 34: North America Bubble Tea Market Y-o-Y Growth Rate Comparison by Flavour (2016-2032)
- Table 35: North America Bubble Tea Market Y-o-Y Growth Rate Comparison by Component (2016-2032)
- Table 36: North America Bubble Tea Market Y-o-Y Growth Rate Comparison by Distribution Channel (2016-2032)
- Table 37: North America Bubble Tea Market Share Comparison by Country (2016-2032)
- Table 38: North America Bubble Tea Market Share Comparison by Type (2016-2032)
- Table 39: North America Bubble Tea Market Share Comparison by Flavour (2016-2032)
- Table 40: North America Bubble Tea Market Share Comparison by Component (2016-2032)
- Table 41: North America Bubble Tea Market Share Comparison by Distribution Channel (2016-2032)
- Table 42: Western Europe Bubble Tea Market Comparison by Type (2016-2032)
- Table 43: Western Europe Bubble Tea Market Comparison by Flavour (2016-2032)
- Table 44: Western Europe Bubble Tea Market Comparison by Component (2016-2032)
- Table 45: Western Europe Bubble Tea Market Comparison by Distribution Channel (2016-2032)
- Table 46: Western Europe Bubble Tea Market Revenue (US$ Mn) Comparison by Country (2016-2032)
- Table 47: Western Europe Bubble Tea Market Revenue (US$ Mn) (2016-2032)
- Table 48: Western Europe Bubble Tea Market Revenue (US$ Mn) Comparison by Country (2016-2032)
- Table 49: Western Europe Bubble Tea Market Revenue (US$ Mn) Comparison by Type (2016-2032)
- Table 50: Western Europe Bubble Tea Market Revenue (US$ Mn) Comparison by Flavour (2016-2032)
- Table 51: Western Europe Bubble Tea Market Revenue (US$ Mn) Comparison by Component (2016-2032)
- Table 52: Western Europe Bubble Tea Market Revenue (US$ Mn) Comparison by Distribution Channel (2016-2032)
- Table 53: Western Europe Bubble Tea Market Y-o-Y Growth Rate Comparison by Country (2016-2032)
- Table 54: Western Europe Bubble Tea Market Y-o-Y Growth Rate Comparison by Type (2016-2032)
- Table 55: Western Europe Bubble Tea Market Y-o-Y Growth Rate Comparison by Flavour (2016-2032)
- Table 56: Western Europe Bubble Tea Market Y-o-Y Growth Rate Comparison by Component (2016-2032)
- Table 57: Western Europe Bubble Tea Market Y-o-Y Growth Rate Comparison by Distribution Channel (2016-2032)
- Table 58: Western Europe Bubble Tea Market Share Comparison by Country (2016-2032)
- Table 59: Western Europe Bubble Tea Market Share Comparison by Type (2016-2032)
- Table 60: Western Europe Bubble Tea Market Share Comparison by Flavour (2016-2032)
- Table 61: Western Europe Bubble Tea Market Share Comparison by Component (2016-2032)
- Table 62: Western Europe Bubble Tea Market Share Comparison by Distribution Channel (2016-2032)
- Table 63: Eastern Europe Bubble Tea Market Comparison by Type (2016-2032)
- Table 64: Eastern Europe Bubble Tea Market Comparison by Flavour (2016-2032)
- Table 65: Eastern Europe Bubble Tea Market Comparison by Component (2016-2032)
- Table 66: Eastern Europe Bubble Tea Market Comparison by Distribution Channel (2016-2032)
- Table 67: Eastern Europe Bubble Tea Market Revenue (US$ Mn) Comparison by Country (2016-2032)
- Table 68: Eastern Europe Bubble Tea Market Revenue (US$ Mn) (2016-2032)
- Table 69: Eastern Europe Bubble Tea Market Revenue (US$ Mn) Comparison by Country (2016-2032)
- Table 70: Eastern Europe Bubble Tea Market Revenue (US$ Mn) Comparison by Type (2016-2032)
- Table 71: Eastern Europe Bubble Tea Market Revenue (US$ Mn) Comparison by Flavour (2016-2032)
- Table 72: Eastern Europe Bubble Tea Market Revenue (US$ Mn) Comparison by Component (2016-2032)
- Table 73: Eastern Europe Bubble Tea Market Revenue (US$ Mn) Comparison by Distribution Channel (2016-2032)
- Table 74: Eastern Europe Bubble Tea Market Y-o-Y Growth Rate Comparison by Country (2016-2032)
- Table 75: Eastern Europe Bubble Tea Market Y-o-Y Growth Rate Comparison by Type (2016-2032)
- Table 76: Eastern Europe Bubble Tea Market Y-o-Y Growth Rate Comparison by Flavour (2016-2032)
- Table 77: Eastern Europe Bubble Tea Market Y-o-Y Growth Rate Comparison by Component (2016-2032)
- Table 78: Eastern Europe Bubble Tea Market Y-o-Y Growth Rate Comparison by Distribution Channel (2016-2032)
- Table 79: Eastern Europe Bubble Tea Market Share Comparison by Country (2016-2032)
- Table 80: Eastern Europe Bubble Tea Market Share Comparison by Type (2016-2032)
- Table 81: Eastern Europe Bubble Tea Market Share Comparison by Flavour (2016-2032)
- Table 82: Eastern Europe Bubble Tea Market Share Comparison by Component (2016-2032)
- Table 83: Eastern Europe Bubble Tea Market Share Comparison by Distribution Channel (2016-2032)
- Table 84: APAC Bubble Tea Market Comparison by Type (2016-2032)
- Table 85: APAC Bubble Tea Market Comparison by Flavour (2016-2032)
- Table 86: APAC Bubble Tea Market Comparison by Component (2016-2032)
- Table 87: APAC Bubble Tea Market Comparison by Distribution Channel (2016-2032)
- Table 88: APAC Bubble Tea Market Revenue (US$ Mn) Comparison by Country (2016-2032)
- Table 89: APAC Bubble Tea Market Revenue (US$ Mn) (2016-2032)
- Table 90: APAC Bubble Tea Market Revenue (US$ Mn) Comparison by Country (2016-2032)
- Table 91: APAC Bubble Tea Market Revenue (US$ Mn) Comparison by Type (2016-2032)
- Table 92: APAC Bubble Tea Market Revenue (US$ Mn) Comparison by Flavour (2016-2032)
- Table 93: APAC Bubble Tea Market Revenue (US$ Mn) Comparison by Component (2016-2032)
- Table 94: APAC Bubble Tea Market Revenue (US$ Mn) Comparison by Distribution Channel (2016-2032)
- Table 95: APAC Bubble Tea Market Y-o-Y Growth Rate Comparison by Country (2016-2032)
- Table 96: APAC Bubble Tea Market Y-o-Y Growth Rate Comparison by Type (2016-2032)
- Table 97: APAC Bubble Tea Market Y-o-Y Growth Rate Comparison by Flavour (2016-2032)
- Table 98: APAC Bubble Tea Market Y-o-Y Growth Rate Comparison by Component (2016-2032)
- Table 99: APAC Bubble Tea Market Y-o-Y Growth Rate Comparison by Distribution Channel (2016-2032)
- Table 100: APAC Bubble Tea Market Share Comparison by Country (2016-2032)
- Table 101: APAC Bubble Tea Market Share Comparison by Type (2016-2032)
- Table 102: APAC Bubble Tea Market Share Comparison by Flavour (2016-2032)
- Table 103: APAC Bubble Tea Market Share Comparison by Component (2016-2032)
- Table 104: APAC Bubble Tea Market Share Comparison by Distribution Channel (2016-2032)
- Table 105: Latin America Bubble Tea Market Comparison by Type (2016-2032)
- Table 106: Latin America Bubble Tea Market Comparison by Flavour (2016-2032)
- Table 107: Latin America Bubble Tea Market Comparison by Component (2016-2032)
- Table 108: Latin America Bubble Tea Market Comparison by Distribution Channel (2016-2032)
- Table 109: Latin America Bubble Tea Market Revenue (US$ Mn) Comparison by Country (2016-2032)
- Table 110: Latin America Bubble Tea Market Revenue (US$ Mn) (2016-2032)
- Table 111: Latin America Bubble Tea Market Revenue (US$ Mn) Comparison by Country (2016-2032)
- Table 112: Latin America Bubble Tea Market Revenue (US$ Mn) Comparison by Type (2016-2032)
- Table 113: Latin America Bubble Tea Market Revenue (US$ Mn) Comparison by Flavour (2016-2032)
- Table 114: Latin America Bubble Tea Market Revenue (US$ Mn) Comparison by Component (2016-2032)
- Table 115: Latin America Bubble Tea Market Revenue (US$ Mn) Comparison by Distribution Channel (2016-2032)
- Table 116: Latin America Bubble Tea Market Y-o-Y Growth Rate Comparison by Country (2016-2032)
- Table 117: Latin America Bubble Tea Market Y-o-Y Growth Rate Comparison by Type (2016-2032)
- Table 118: Latin America Bubble Tea Market Y-o-Y Growth Rate Comparison by Flavour (2016-2032)
- Table 119: Latin America Bubble Tea Market Y-o-Y Growth Rate Comparison by Component (2016-2032)
- Table 120: Latin America Bubble Tea Market Y-o-Y Growth Rate Comparison by Distribution Channel (2016-2032)
- Table 121: Latin America Bubble Tea Market Share Comparison by Country (2016-2032)
- Table 122: Latin America Bubble Tea Market Share Comparison by Type (2016-2032)
- Table 123: Latin America Bubble Tea Market Share Comparison by Flavour (2016-2032)
- Table 124: Latin America Bubble Tea Market Share Comparison by Component (2016-2032)
- Table 125: Latin America Bubble Tea Market Share Comparison by Distribution Channel (2016-2032)
- Table 126: Middle East & Africa Bubble Tea Market Comparison by Type (2016-2032)
- Table 127: Middle East & Africa Bubble Tea Market Comparison by Flavour (2016-2032)
- Table 128: Middle East & Africa Bubble Tea Market Comparison by Component (2016-2032)
- Table 129: Middle East & Africa Bubble Tea Market Comparison by Distribution Channel (2016-2032)
- Table 130: Middle East & Africa Bubble Tea Market Revenue (US$ Mn) Comparison by Country (2016-2032)
- Table 131: Middle East & Africa Bubble Tea Market Revenue (US$ Mn) (2016-2032)
- Table 132: Middle East & Africa Bubble Tea Market Revenue (US$ Mn) Comparison by Country (2016-2032)
- Table 133: Middle East & Africa Bubble Tea Market Revenue (US$ Mn) Comparison by Type (2016-2032)
- Table 134: Middle East & Africa Bubble Tea Market Revenue (US$ Mn) Comparison by Flavour (2016-2032)
- Table 135: Middle East & Africa Bubble Tea Market Revenue (US$ Mn) Comparison by Component (2016-2032)
- Table 136: Middle East & Africa Bubble Tea Market Revenue (US$ Mn) Comparison by Distribution Channel (2016-2032)
- Table 137: Middle East & Africa Bubble Tea Market Y-o-Y Growth Rate Comparison by Country (2016-2032)
- Table 138: Middle East & Africa Bubble Tea Market Y-o-Y Growth Rate Comparison by Type (2016-2032)
- Table 139: Middle East & Africa Bubble Tea Market Y-o-Y Growth Rate Comparison by Flavour (2016-2032)
- Table 140: Middle East & Africa Bubble Tea Market Y-o-Y Growth Rate Comparison by Component (2016-2032)
- Table 141: Middle East & Africa Bubble Tea Market Y-o-Y Growth Rate Comparison by Distribution Channel (2016-2032)
- Table 142: Middle East & Africa Bubble Tea Market Share Comparison by Country (2016-2032)
- Table 143: Middle East & Africa Bubble Tea Market Share Comparison by Type (2016-2032)
- Table 144: Middle East & Africa Bubble Tea Market Share Comparison by Flavour (2016-2032)
- Table 145: Middle East & Africa Bubble Tea Market Share Comparison by Component (2016-2032)
- Table 146: Middle East & Africa Bubble Tea Market Share Comparison by Distribution Channel (2016-2032)
- 1. Executive Summary
-
- Lollicup USA, Inc
- Bubble Tea Supply, Inc.
- Boba Loca USA Inc.
- Cuppotee
- BUBLUV, Inc.,
- Fokus Inc.
- Kung Fu Tea
- Kuaikeli Enterprise Co., Ltd.
- Fanale Drinks
- Sumos Sdn Bhd
- Boba Guys
- Coco Fresh
- Other key Players
Our Clients


View Our Licence Options
