
Bioremediation Market Report By Type of Bioremediation (Microbial Bioremediation, Phytoremediation, Mycoremediation, Bioaugmentation, Biostimulation, Rhizofiltration, Others), By Contaminant Type (Hydrocarbons, Heavy Metals, Organic Compounds, Radioactive Substances, PCBs, Others), By Application (Soil Bioremediation, Water Bioremediation, Others), By End User Industry, By Region and Companies - Industry Segment Outlook, Market Assessment, Competition Scenario, Trends and Forecast 2024-2033
-
46690
-
May 2024
-
324
-


-
This report was compiled by Trishita Deb Trishita Deb is an experienced market research and consulting professional with over 7 years of expertise across healthcare, consumer goods, and materials, contributing to over 400 healthcare-related reports. Correspondence Team Lead- Healthcare Linkedin | Detailed Market research Methodology Our methodology involves a mix of primary research, including interviews with leading mental health experts, and secondary research from reputable medical journals and databases. View Detailed Methodology Page
-
Quick Navigation
Report Overview
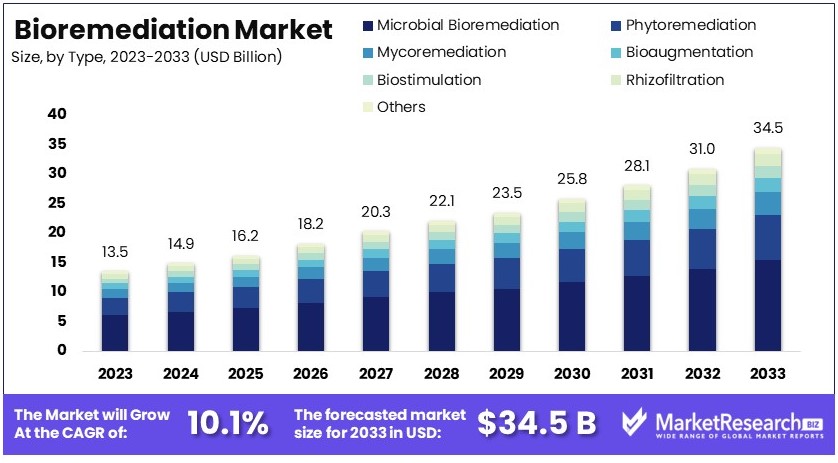
The Global Bioremediation Market size is expected to be worth around USD 34.5 Billion by 2033, from USD 13.5 Billion in 2023, growing at a CAGR of 10.1% during the forecast period from 2024 to 2033.
The Bioremediation Market involves the use of biological processes to clean up contaminated environments. This market includes technologies that leverage microorganisms, plants, and enzymes to degrade pollutants in soil, water, and air. Industries such as oil and gas, agriculture, and waste management utilize bioremediation to address environmental contamination.
Market growth is driven by increasing environmental regulations and the need for sustainable remediation solutions. Advances in biotechnology and genetic engineering are enhancing bioremediation efficiency. The bioremediation market plays a critical role in environmental conservation and pollution control efforts globally.
The Bioremediation Market is positioned for robust growth, driven by increasing environmental concerns and the need for effective pollution management solutions. Ambient particulate matter pollution, particularly PM 2.5, has caused significant health impacts among OECD countries, with approximately 29 deaths per 100,000 people in 2019. Countries like the Slovak Republic, Hungary, and Poland experienced death rates exceeding 60 per 100,000, while Sweden, New Zealand, and Iceland reported fewer than 7 deaths per 100,000.
Globally, land degradation is a pressing issue, affecting 3.2 billion people, particularly in rural areas and among smallholder farmers and the very poor. Currently, a quarter of the world’s land area is classified as degraded, impacting the lives of 1.5 billion people. Annually, 15 billion tons of fertile soil are lost due to human activities and climate change. These factors underscore the urgent need for effective bioremediation solutions.
Bioremediation, which utilizes biological processes to treat contaminated environments, offers a sustainable and cost-effective approach to managing pollution and land degradation. As the global community becomes increasingly aware of the environmental and health impacts of pollution, the demand for bioremediation technologies is expected to rise.
Market participants are likely to focus on developing innovative bioremediation methods to address diverse environmental challenges. The expansion of regulatory frameworks aimed at reducing pollution and promoting sustainable land management practices will further drive the market. Overall, the Bioremediation Market presents significant growth opportunities, driven by the escalating need for environmental restoration and the adoption of eco-friendly technologies.
Key Takeaways
- Market Value: The Global Bioremediation Market is forecasted to reach USD 34.5 billion by 2033, up from USD 13.5 billion in 2023, growing at a CAGR of 10.1%.
- Type of Bioremediation Analysis: Microbial bioremediation dominates with 45%; versatile and effective.
- Contaminant Type Analysis: Hydrocarbons dominate with 40%; extensive industrial contamination.
- Application Analysis: Soil bioremediation dominates with 35%; widespread soil contamination issues.
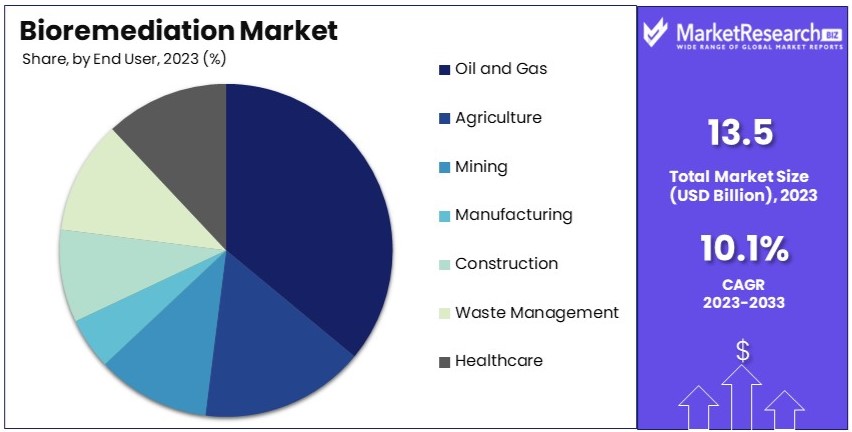
- End User Industry Analysis: Oil and gas dominate with 30%; high contamination risk and regulatory pressure.
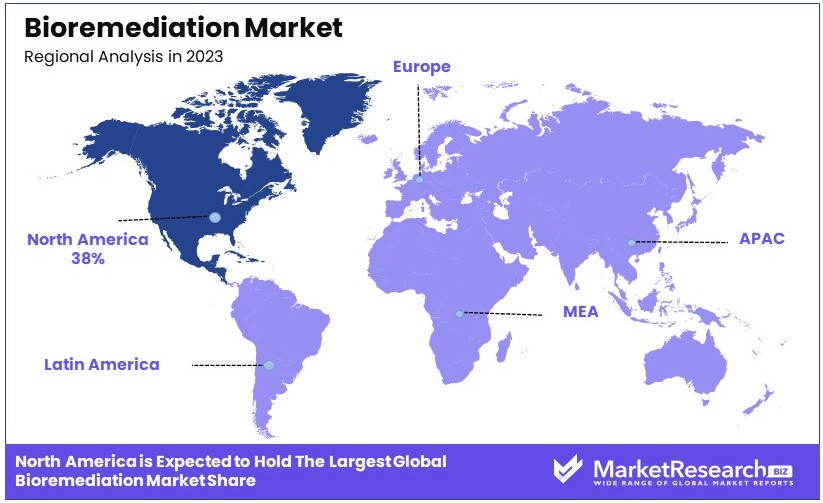
- Dominant Region: North America with 38%; stringent environmental regulations.
- High Growth Region: Europe; increasing environmental awareness and regulations.
- Analyst Viewpoint: The market is growing rapidly with increasing adoption of sustainable practices. Future predictions include technological advancements enhancing effectiveness.
- Growth Opportunities: Opportunities lie in developing specialized bioremediation solutions for various contaminants and expanding applications in different industries.
Driving Factors
Stringent Environmental Regulations Drive Market Growth
Governments worldwide are implementing stricter environmental regulations to combat pollution and promote sustainable practices. These regulations are driving the demand for bioremediation technologies, which offer eco-friendly solutions for soil, water, and air remediation. For instance, the U.S. Environmental Protection Agency (EPA) has set stringent guidelines for the cleanup of contaminated sites, promoting the use of bioremediation techniques.
Compliance with these regulations requires industries to adopt bioremediation methods, thus fueling market growth. The interaction between regulatory pressure and the need for sustainable practices is creating a favorable environment for the expansion of the bioremediation market. This synergy is expected to continue driving market growth as regulations become even more stringent.
Rising Awareness of Environmental Sustainability Drives Market Growth
There is a growing global awareness about the importance of environmental sustainability and the need to reduce the ecological footprint of human activities. Bioremediation techniques are seen as a sustainable and cost-effective alternative to traditional chemical-based remediation methods. Companies are increasingly adopting bioremediation solutions to demonstrate their commitment to environmental stewardship and gain a competitive edge. Bio based platform chemicals are essential in reducing the reliance on fossil fuels for industrial processes.
This shift is reflected in the market's projected growth, with significant investments being made in bioremediation research and development. The bioremediation market is expected to witness substantial growth as more companies and governments prioritize sustainable practices. The interaction between rising environmental awareness and corporate social responsibility is driving the adoption of bioremediation, contributing to market expansion.
Increasing Industrial Activities and Accidental Spills Drive Market Growth
The expansion of industries such as oil and gas, mining, and manufacturing has led to an increased risk of accidental spills and environmental contamination. Bioremediation techniques offer efficient and targeted solutions for cleaning up these spills, minimizing the environmental impact. For instance, bioremediation has been widely used in the cleanup of oil spills, such as the Deepwater Horizon oil spill in the Gulf of Mexico.
The growing industrial activities are directly linked to the rising demand for effective remediation technologies. The interaction between industrial expansion and environmental safety measures is creating a strong demand for bioremediation services, thereby driving market growth.
Restraining Factors
Limited Applicability and Site-Specific Challenges Restrain Market Growth
Bioremediation techniques are not universally applicable to all types of contaminants and environmental conditions. Some contaminants, such as heavy metals, are resistant to biodegradation. Additionally, site conditions may not always be favorable for the growth and activity of the required microorganisms.
For example, bioremediation may be less effective in extremely cold or arid environments. This limitation restricts the widespread adoption of bioremediation technologies. According to industry reports, these challenges can slow market growth, as solutions need to be tailored to specific conditions, increasing costs and complexity. The need for precise conditions and specific microbial activity limits the scalability of bioremediation, creating a significant barrier to market expansion.
Regulatory Hurdles and Public Perception Restrain Market Growth
Despite the eco-friendly nature of bioremediation, regulatory bodies and the public may have concerns about using microorganisms for remediation. There are apprehensions about potential risks and unintended consequences, leading to stringent regulations and public opposition. For example, the use of genetically modified organisms (GMOs) in bioremediation faces resistance due to concerns about environmental impact.
These regulatory and perception issues can delay project approvals and increase compliance costs. The market growth is hampered as companies navigate these hurdles, slowing down the adoption of bioremediation technologies. According to recent surveys, public opposition and regulatory barriers can significantly limit market expansion, impacting the overall growth trajectory of the bioremediation industry.
Type of Bioremediation Analysis
Microbial Bioremediation dominates with 45% due to its versatility and effectiveness in various environments.
Microbial bioremediation is the dominant segment in the bioremediation market, holding approximately 45% of the market share. This method uses microorganisms such as bacteria, fungi, and yeast to degrade and neutralize pollutants in soil, water, and air. The versatility and adaptability of microbial bioremediation make it effective across a wide range of contaminants and environmental conditions. This approach is particularly effective for hydrocarbons, organic compounds, and some heavy metals. Microbial bioremediation is favored due to its cost-effectiveness and minimal environmental impact compared to traditional chemical and physical remediation methods.
Research indicates that the global microbial bioremediation market is projected to grow significantly, driven by increasing environmental regulations and the need for sustainable pollution management solutions. For example, the use of microbial bioremediation in oil spill cleanups has proven successful, as seen in the aftermath of the Deepwater Horizon oil spill. Additionally, advancements in biotechnology have enhanced the efficiency and scope of microbial bioremediation, further solidifying its market dominance.
Other segments within the type of bioremediation include phytoremediation, mycoremediation, bioaugmentation, biostimulation, rhizofiltration, and others. Phytoremediation uses plants to absorb and degrade contaminants, making it suitable for large-scale soil and water remediation. Mycoremediation employs fungi to break down pollutants, particularly effective for organic compounds and heavy metals. Bioaugmentation involves the introduction of specialized microorganisms to enhance the degradation process, while biostimulation stimulates the existing microbial population through nutrient addition. Rhizofiltration uses plant roots to filter contaminants from water.
Each of these methods contributes to the growth of the bioremediation market by offering specific advantages for different types of pollutants and environmental conditions. However, their combined market share remains lower than microbial bioremediation due to limitations in applicability, scalability, and effectiveness in certain environments.
Contaminant Type Analysis
Hydrocarbons dominate with 40% due to extensive industrial contamination and successful remediation cases.
The hydrocarbon segment, including petroleum, diesel, and gasoline, is the dominant sub-segment in the bioremediation market, holding approximately 40% of the market share. The extensive use of hydrocarbons in industries such as oil and gas, transportation, and manufacturing leads to frequent contamination of soil and water. Bioremediation techniques, particularly microbial bioremediation, have proven highly effective in degrading hydrocarbons, making this sub-segment a significant driver of market growth.
Bioremediation of hydrocarbons is essential for mitigating the environmental impact of accidental spills and leaks. The successful application of bioremediation in high-profile cases, such as the Deepwater Horizon oil spill, has demonstrated its effectiveness and increased its adoption. Research shows that the global bioremediation market for hydrocarbons is expected to continue growing as industries and governments seek sustainable and cost-effective methods for pollution management.
Other contaminant types in the bioremediation market include heavy metals (lead, mercury, cadmium), organic compounds (chlorinated solvents, pesticides), radioactive substances, PCBs (polychlorinated biphenyls), and others. Heavy metal contamination poses significant challenges due to the persistence and toxicity of these elements. Bioremediation techniques such as phytoremediation and mycoremediation are often used to address heavy metal pollution. Organic compounds, including chlorinated solvents and pesticides, are targeted by microbial and phytoremediation methods. Radioactive substances and PCBs require specialized bioremediation approaches due to their hazardous nature.
Each of these contaminant types plays a role in the overall growth of the bioremediation market by addressing specific pollution challenges across various industries. The development of tailored bioremediation solutions for these contaminants is crucial for expanding the market's reach and effectiveness.
Application Analysis
Soil Bioremediation dominates with 35% due to widespread soil contamination issues.
Soil bioremediation is the dominant segment within the bioremediation market, accounting for approximately 35% of the market share. This method focuses on the degradation of contaminants in the soil using various bioremediation techniques such as microbial bioremediation, phytoremediation, and bioaugmentation. Soil contamination is a widespread issue caused by industrial activities, agricultural practices, and accidental spills. Effective soil bioremediation is essential for restoring soil health, ensuring food safety, and protecting ecosystems. Hydroponics can incorporate bioremediation strategies to clean water and recycle nutrients effectively.
The growing concern for soil pollution and the need for sustainable land management practices drive the demand for soil bioremediation. Research indicates that soil bioremediation technologies are continually evolving, with advancements in microbial consortia and plant-based remediation enhancing their effectiveness. The global market for soil bioremediation is projected to grow steadily as environmental regulations become more stringent and public awareness of soil health increases.
Other application segments in the bioremediation market include water bioremediation, air bioremediation, sediment bioremediation, surface bioremediation, groundwater bioremediation, and others. Water bioremediation addresses the contamination of water bodies, including lakes, rivers, and oceans, using microbial and phytoremediation techniques. Air bioremediation targets the removal of airborne pollutants through biofiltration and other methods. Sediment bioremediation focuses on the remediation of contaminated sediments in aquatic environments. Surface and groundwater bioremediation are critical for addressing pollution in drinking water sources and aquifers.
Each application segment contributes to the overall growth of the bioremediation market by addressing specific environmental challenges. The development of integrated bioremediation solutions that combine multiple techniques is essential for enhancing the efficiency and scope of remediation efforts.
End User Industry Analysis
Oil and Gas dominate with 30% due to high contamination risk and regulatory pressure.
The oil and gas industry is the dominant end-user segment in the bioremediation market, accounting for approximately 30% of the market share. This industry is a significant contributor to environmental pollution due to frequent spills, leaks, and accidents. Bioremediation offers effective solutions for the cleanup of hydrocarbon contaminants, making it a preferred choice for oil and gas companies. Regulatory pressure to adhere to environmental standards and mitigate pollution further drives the adoption of bioremediation in this industry.
Research shows that the global bioremediation market for the oil and gas sector is expected to grow as companies invest in sustainable pollution management practices. High-profile incidents like the Deepwater Horizon oil spill have highlighted the need for efficient remediation technologies, boosting the demand for bioremediation.
Other end-user industries in the bioremediation market include agriculture, mining, manufacturing, construction, waste management, healthcare, and others. The agriculture sector uses bioremediation to manage soil health and reduce pesticide contamination. The mining industry addresses heavy metal pollution through bioremediation techniques. Manufacturing and construction industries focus on mitigating the environmental impact of their operations. Waste management companies employ bioremediation to treat hazardous waste, while the healthcare sector uses it for pharmaceutical and medical waste management.
Each end-user industry contributes to the growth of the bioremediation market by adopting these technologies to address specific environmental challenges. The development of industry-specific bioremediation solutions is crucial for expanding the market and enhancing the effectiveness of pollution management efforts.
Key Market Segments
By Type of Bioremediation
- Microbial Bioremediation
- Phytoremediation
- Mycoremediation
- Bioaugmentation
- Biostimulation
- Rhizofiltration
- Others
By Contaminant Type
- Hydrocarbons
- Heavy Metals
- Organic Compounds
- Radioactive Substances
- PCBs
- Others
By Application
- Soil Bioremediation
- Water Bioremediation
- Air Bioremediation
- Sediment Bioremediation
- Surface Bioremediation
- Groundwater Bioremediation
- Others
By End User Industry
- Oil and Gas
- Agriculture
- Mining
- Manufacturing
- Construction
- Waste Management
- Healthcare
- Others
Growth Opportunities
Development of Advanced Bioremediation Technologies Offers Growth Opportunity
The development of advanced bioremediation technologies presents a significant growth opportunity. These innovations include the engineering of specialized microbial strains, the use of nanotechnology for targeted delivery of microorganisms, and the creation of innovative bioreactor systems.
For instance, researchers at the University of California, Berkeley, have developed a nanobioremediation approach using nanoparticles to deliver degradative enzymes to specific contaminant sites, enhancing the bioremediation process. These advancements can address a wider range of contaminants and environmental conditions, making bioremediation more effective and efficient. The global market for advanced bioremediation technologies is projected to grow as these new methods become commercially viable, driving market expansion and offering sustainable solutions for pollution management.
Expansion into Emerging Markets Offers Growth Opportunity
The bioremediation market has significant growth potential in emerging economies where industrialization and urbanization are rapidly increasing. Countries like China, India, and Brazil are experiencing a surge in industrial activities, leading to environmental pollution and a growing demand for sustainable remediation solutions.
Establishing a strong presence in these emerging markets allows bioremediation companies to capitalize on untapped opportunities and contribute to environmental conservation efforts. The market in these regions is expected to grow as industries and governments seek effective and eco-friendly remediation technologies. This expansion into emerging markets offers substantial growth prospects for bioremediation firms, enhancing their global footprint and revenue potential.
Trending Factors
Integration of Biotechnology and Bioremediation Are Trending Factors
The integration of biotechnology and bioremediation is a trending factor in the market. Advances in synthetic biology, genetic engineering, and metabolic engineering enable the creation of genetically modified microorganisms with enhanced bioremediation capabilities. These engineered microbes can target specific contaminants more effectively, leading to improved remediation outcomes.
For example, researchers at the University of Minnesota have developed genetically engineered bacteria capable of breaking down polychlorinated biphenyls (PCBs), a persistent environmental pollutant. The application of biotechnology in bioremediation enhances the efficiency and scope of pollutant degradation, making it a key trend driving market growth.
Bioaugmentation and Biostimulation Approaches Are Trending Factors
Bioaugmentation and biostimulation are gaining traction as effective bioremediation strategies. Bioaugmentation involves introducing specific microbial cultures into a contaminated environment, while biostimulation stimulates indigenous microbial populations by adding nutrients or other amendments. These approaches optimize the remediation process, enabling targeted and efficient degradation of contaminants.
For instance, bioaugmentation has been successfully employed in the bioremediation of hydrocarbon-contaminated soils in the oil and gas industry. The growing adoption of these methods reflects their effectiveness in enhancing bioremediation outcomes. As a result, bioaugmentation and biostimulation are trending factors that significantly contribute to the growth and evolution of the bioremediation market.
Regional Analysis
North America Dominates with 38% Market Share
North America holds a 38% share of the bioremediation market. This dominance is driven by stringent environmental regulations, advanced bioremediation technologies, and strong industry presence. The U.S. Environmental Protection Agency (EPA) enforces strict guidelines for pollution control, boosting demand for bioremediation solutions. The region benefits from significant investments in research and development, leading to innovations in microbial and nanobioremediation techniques. High awareness and adoption of sustainable practices among industries also contribute to North America's leading position in the market.
North America's high market share is influenced by stringent environmental regulations and strong governmental support. The EPA’s strict guidelines for pollution control push industries to adopt bioremediation technologies. Additionally, substantial investment in R&D drives innovation in bioremediation methods. The presence of key market players and the adoption of advanced technologies like nanobioremediation and genetically engineered microorganisms further bolster the market. The region's focus on sustainability and environmental stewardship also plays a crucial role.
Europe – 25% Market Share
Europe holds a 25% share of the bioremediation market. Strict environmental laws and a strong emphasis on sustainability drive market growth. The European Union’s regulations on pollution control and waste management push industries towards bioremediation solutions. Germany, France, and the UK are key contributors due to their advanced industrial sectors and environmental initiatives. Europe’s market is expected to grow as green technologies and sustainable practices become more prevalent.
Asia Pacific – 20% Market Share
Asia Pacific accounts for 20% of the bioremediation market. Rapid industrialization and urbanization in countries like China, India, and Japan increase the need for effective pollution control. Government initiatives and rising awareness about environmental protection boost market demand. The region’s market share is anticipated to grow significantly, driven by increased investments in sustainable technologies and stricter environmental regulations.
Middle East & Africa – 10% Market Share
The Middle East & Africa region holds a 10% share of the bioremediation market. The market is driven by the oil and gas industry’s need for efficient spill cleanup and pollution control. Increasing industrial activities and environmental awareness contribute to market growth. However, the market share is limited by the slower adoption of advanced technologies. The region is expected to see moderate growth as environmental regulations tighten and bioremediation solutions become more accessible.
Latin America – 7% Market Share
Latin America has a 7% share of the bioremediation market. The region’s market is driven by agriculture and mining industries, which require effective pollution management solutions. Brazil and Mexico are key contributors due to their large industrial bases. Government initiatives promoting environmental sustainability and the adoption of bioremediation technologies support market growth. The market share is projected to increase as environmental regulations and sustainability practices become more prominent.
Key Regions and Countries
- North America
- The US
- Canada
- Mexico
- Western Europe
- Germany
- France
- The UK
- Spain
- Italy
- Portugal
- Ireland
- Austria
- Switzerland
- Benelux
- Nordic
- Rest of Western Europe
- Eastern Europe
- Russia
- Poland
- The Czech Republic
- Greece
- Rest of Eastern Europe
- APAC
- China
- Japan
- South Korea
- India
- Australia & New Zealand
- Indonesia
- Malaysia
- Philippines
- Singapore
- Thailand
- Vietnam
- Rest of APAC
- Latin America
- Brazil
- Colombia
- Chile
- Argentina
- Costa Rica
- Rest of Latin America
- Middle East & Africa
- Algeria
- Egypt
- Israel
- Kuwait
- Nigeria
- Saudi Arabia
- South Africa
- Turkey
- United Arab Emirates
- Rest of MEA
Key Players Analysis
The Bioremediation market is characterized by a range of influential companies that play pivotal roles in advancing environmental restoration technologies. REGENESIS, Envirogen Technologies, Inc., and EOS Remediation, LLC are key players known for their innovative approaches in site-specific remediation solutions. These firms are leaders in developing and implementing technologies that effectively address soil and groundwater contamination.
BioSolve Group and Sevenson Environmental Services, Inc. specialize in providing remedial services that ensure compliance with environmental regulations, enhancing their strategic market positioning. Their focus on safety and efficiency makes them crucial in sectors requiring stringent environmental standards.
Large multinational corporations such as Xylem Inc., SUEZ, and Veolia Environment S.A. leverage their extensive resources and global networks to dominate the market. Their capabilities in handling large-scale projects and their commitment to sustainable practices significantly influence industry standards and practices.
Emerging players like Altogen Labs and Microgen Biotech Ltd. focus on niche markets by offering bioremediation services that utilize advanced biotechnologies. These companies are instrumental in pushing the boundaries of bioremediation to include agricultural applications and heavy metal removal.
Thermo Fisher Scientific Inc. and Aquatech International LLC contribute through their expertise in providing analytical instruments and engineered systems, respectively, which support the bioremediation process and ensure environmental compliance.
Overall, the key players in the Bioremediation market drive the industry forward through technological innovation, strategic market initiatives, and a strong focus on sustainability. Their combined efforts are crucial for meeting the growing global demand for environmentally friendly remediation solutions.
Market Key Players
- REGENESIS
- BioSolve Group
- Sevenson Environmental Services, Inc.
- Xylem Inc.
- Altogen Labs
- SUEZ
- Veolia Environment S.A.
- Probiosphere Inc.
- Envirogen Technologies, Inc.
- Microgen Biotech Ltd.
- Aquatech International LLC
- Thermo Fisher Scientific Inc.
- Environmental Consulting & Technology, Inc. (ECT)
- InSitu Remediation Services Ltd.
- EOS Remediation, LLC
Recent Developments
- April 2024: Danielle Stevenson, a researcher at the University of California, Riverside, investigates bioremediation using native California plants and fungi to clean up contaminated brownfield sites. Her study suggests promising potential for environmentally friendly and cost-effective soil decontamination methods.
- March 2024: ITS Professor Harmin Sulistiyaning Titah ST MT PhD pioneers bioremediation and phytoremediation technologies to restore environmental quality in Indonesia, focusing on sustainable and cost-effective methods to mitigate organic and inorganic pollutants.
- January 2024: Legacy waste bioremediation at Jamalpur garbage dump in Ludhiana, initially slated for completion by January 31, faces delay until June due to extended monsoon season impacting progress.
Report Scope
Report Features Description Market Value (2023) USD 13.5 Billion Forecast Revenue (2033) USD 34.5 Billion CAGR (2024-2033) 10.1% Base Year for Estimation 2023 Historic Period 2018-2023 Forecast Period 2024-2033 Report Coverage Revenue Forecast, Market Dynamics, Competitive Landscape, Recent Developments Segments Covered By Type of Bioremediation (Microbial Bioremediation, Phytoremediation, Mycoremediation, Bioaugmentation, Biostimulation, Rhizofiltration, Others), By Contaminant Type (Hydrocarbons, Heavy Metals, Organic Compounds, Radioactive Substances, PCBs, Others), By Application (Soil Bioremediation, Water Bioremediation, Air Bioremediation, Sediment Bioremediation, Surface Bioremediation, Groundwater Bioremediation, Others), By End User Industry (Oil and Gas, Agriculture, Mining, Manufacturing, Construction, Waste Management, Healthcare, Others) Regional Analysis North America - The US, Canada, & Mexico; Western Europe - Germany, France, The UK, Spain, Italy, Portugal, Ireland, Austria, Switzerland, Benelux, Nordic, & Rest of Western Europe; Eastern Europe - Russia, Poland, The Czech Republic, Greece, & Rest of Eastern Europe; APAC - China, Japan, South Korea, India, Australia & New Zealand, Indonesia, Malaysia, Philippines, Singapore, Thailand, Vietnam, & Rest of APAC; Latin America - Brazil, Colombia, Chile, Argentina, Costa Rica, & Rest of Latin America; Middle East & Africa - Algeria, Egypt, Israel, Kuwait, Nigeria, Saudi Arabia, South Africa, Turkey, United Arab Emirates, & Rest of MEA Competitive Landscape REGENESIS, BioSolve Group, Sevenson Environmental Services, Inc., Xylem Inc., Altogen Labs, SUEZ, Veolia Environment S.A., Probiosphere Inc., Envirogen Technologies, Inc., Microgen Biotech Ltd., Aquatech International LLC, Thermo Fisher Scientific Inc., Environmental Consulting & Technology, Inc. (ECT), InSitu Remediation Services Ltd., EOS Remediation, LLC Customization Scope Customization for segments, region/country-level will be provided. Moreover, additional customization can be done based on the requirements. Purchase Options We have three licenses to opt for: Single User License, Multi-User License (Up to 5 Users), Corporate Use License (Unlimited User and Printable PDF) -
- 1. Executive Summary
- 1.1. Definition
- 1.2. Taxonomy
- 1.3. Research Scope
- 1.4. Key Analysis
- 1.5. Key Findings by Major Segments
- 1.6. Top strategies by Major Players
- 2. Global Bioremediation Market Overview
- 2.1. Bioremediation Market Dynamics
- 2.1.1. Drivers
- 2.1.2. Opportunities
- 2.1.3. Restraints
- 2.1.4. Challenges
- 2.2. Macro-economic Factors
- 2.3. Regulatory Framework
- 2.4. Market Investment Feasibility Index
- 2.5. PEST Analysis
- 2.6. PORTER’S Five Force Analysis
- 2.7. Drivers & Restraints Impact Analysis
- 2.8. Industry Chain Analysis
- 2.9. Cost Structure Analysis
- 2.10. Marketing Strategy
- 2.11. Russia-Ukraine War Impact Analysis
- 2.12. Opportunity Map Analysis
- 2.13. Market Competition Scenario Analysis
- 2.14. Product Life Cycle Analysis
- 2.15. Opportunity Orbits
- 2.16. Manufacturer Intensity Map
- 2.17. Major Companies sales by Value & Volume
- 2.1. Bioremediation Market Dynamics
- 3. Global Bioremediation Market Analysis, Opportunity and Forecast, 2016-2032
- 3.1. Global Bioremediation Market Analysis, 2016-2021
- 3.2. Global Bioremediation Market Opportunity and Forecast, 2023-2032
- 3.3. Global Bioremediation Market Analysis, Opportunity and Forecast, By Type of Bioremediation, 2016-2032
- 3.3.1. Global Bioremediation Market Analysis by Type of Bioremediation: Introduction
- 3.3.2. Market Size Absolute $ Opportunity Analysis and Forecast, By Type of Bioremediation, 2016-2032
- 3.3.3. Microbial Bioremediation
- 3.3.4. Phytoremediation
- 3.3.5. Mycoremediation
- 3.3.6. Bioaugmentation
- 3.3.7. Biostimulation
- 3.3.8. Rhizofiltration
- 3.3.9. Others
- 3.4. Global Bioremediation Market Analysis, Opportunity and Forecast, By Contaminant Type, 2016-2032
- 3.4.1. Global Bioremediation Market Analysis by Contaminant Type: Introduction
- 3.4.2. Market Size Absolute $ Opportunity Analysis and Forecast, By Contaminant Type, 2016-2032
- 3.4.3. Hydrocarbons
- 3.4.4. Heavy Metals
- 3.4.5. Organic Compounds
- 3.4.6. Radioactive Substances
- 3.4.7. PCBs
- 3.4.8. Others
- 3.5. Global Bioremediation Market Analysis, Opportunity and Forecast, By Application, 2016-2032
- 3.5.1. Global Bioremediation Market Analysis by Application: Introduction
- 3.5.2. Market Size Absolute $ Opportunity Analysis and Forecast, By Application, 2016-2032
- 3.5.3. Soil Bioremediation
- 3.5.4. Water Bioremediation
- 3.5.5. Air Bioremediation
- 3.5.6. Sediment Bioremediation
- 3.5.7. Surface Bioremediation
- 3.5.8. Groundwater Bioremediation
- 3.5.9. Others
- 3.6. Global Bioremediation Market Analysis, Opportunity and Forecast, By End User Industry, 2016-2032
- 3.6.1. Global Bioremediation Market Analysis by End User Industry: Introduction
- 3.6.2. Market Size Absolute $ Opportunity Analysis and Forecast, By End User Industry, 2016-2032
- 3.6.3. Oil and Gas
- 3.6.4. Agriculture
- 3.6.5. Mining
- 3.6.6. Manufacturing
- 3.6.7. Construction
- 3.6.8. Waste Management
- 3.6.9. Healthcare
- 3.6.10. Others
- 4. North America Bioremediation Market Analysis, Opportunity and Forecast, 2016-2032
- 4.1. North America Bioremediation Market Analysis, 2016-2021
- 4.2. North America Bioremediation Market Opportunity and Forecast, 2023-2032
- 4.3. North America Bioremediation Market Analysis, Opportunity and Forecast, By Type of Bioremediation, 2016-2032
- 4.3.1. North America Bioremediation Market Analysis by Type of Bioremediation: Introduction
- 4.3.2. Market Size Absolute $ Opportunity Analysis and Forecast, By Type of Bioremediation, 2016-2032
- 4.3.3. Microbial Bioremediation
- 4.3.4. Phytoremediation
- 4.3.5. Mycoremediation
- 4.3.6. Bioaugmentation
- 4.3.7. Biostimulation
- 4.3.8. Rhizofiltration
- 4.3.9. Others
- 4.4. North America Bioremediation Market Analysis, Opportunity and Forecast, By Contaminant Type, 2016-2032
- 4.4.1. North America Bioremediation Market Analysis by Contaminant Type: Introduction
- 4.4.2. Market Size Absolute $ Opportunity Analysis and Forecast, By Contaminant Type, 2016-2032
- 4.4.3. Hydrocarbons
- 4.4.4. Heavy Metals
- 4.4.5. Organic Compounds
- 4.4.6. Radioactive Substances
- 4.4.7. PCBs
- 4.4.8. Others
- 4.5. North America Bioremediation Market Analysis, Opportunity and Forecast, By Application, 2016-2032
- 4.5.1. North America Bioremediation Market Analysis by Application: Introduction
- 4.5.2. Market Size Absolute $ Opportunity Analysis and Forecast, By Application, 2016-2032
- 4.5.3. Soil Bioremediation
- 4.5.4. Water Bioremediation
- 4.5.5. Air Bioremediation
- 4.5.6. Sediment Bioremediation
- 4.5.7. Surface Bioremediation
- 4.5.8. Groundwater Bioremediation
- 4.5.9. Others
- 4.6. North America Bioremediation Market Analysis, Opportunity and Forecast, By End User Industry, 2016-2032
- 4.6.1. North America Bioremediation Market Analysis by End User Industry: Introduction
- 4.6.2. Market Size Absolute $ Opportunity Analysis and Forecast, By End User Industry, 2016-2032
- 4.6.3. Oil and Gas
- 4.6.4. Agriculture
- 4.6.5. Mining
- 4.6.6. Manufacturing
- 4.6.7. Construction
- 4.6.8. Waste Management
- 4.6.9. Healthcare
- 4.6.10. Others
- 4.7. North America Bioremediation Market Analysis, Opportunity and Forecast, By Country , 2016-2032
- 4.7.1. North America Bioremediation Market Analysis by Country : Introduction
- 4.7.2. Market Size Absolute $ Opportunity Analysis and Forecast, Country , 2016-2032
- 4.7.2.1. The US
- 4.7.2.2. Canada
- 4.7.2.3. Mexico
- 5. Western Europe Bioremediation Market Analysis, Opportunity and Forecast, 2016-2032
- 5.1. Western Europe Bioremediation Market Analysis, 2016-2021
- 5.2. Western Europe Bioremediation Market Opportunity and Forecast, 2023-2032
- 5.3. Western Europe Bioremediation Market Analysis, Opportunity and Forecast, By Type of Bioremediation, 2016-2032
- 5.3.1. Western Europe Bioremediation Market Analysis by Type of Bioremediation: Introduction
- 5.3.2. Market Size Absolute $ Opportunity Analysis and Forecast, By Type of Bioremediation, 2016-2032
- 5.3.3. Microbial Bioremediation
- 5.3.4. Phytoremediation
- 5.3.5. Mycoremediation
- 5.3.6. Bioaugmentation
- 5.3.7. Biostimulation
- 5.3.8. Rhizofiltration
- 5.3.9. Others
- 5.4. Western Europe Bioremediation Market Analysis, Opportunity and Forecast, By Contaminant Type, 2016-2032
- 5.4.1. Western Europe Bioremediation Market Analysis by Contaminant Type: Introduction
- 5.4.2. Market Size Absolute $ Opportunity Analysis and Forecast, By Contaminant Type, 2016-2032
- 5.4.3. Hydrocarbons
- 5.4.4. Heavy Metals
- 5.4.5. Organic Compounds
- 5.4.6. Radioactive Substances
- 5.4.7. PCBs
- 5.4.8. Others
- 5.5. Western Europe Bioremediation Market Analysis, Opportunity and Forecast, By Application, 2016-2032
- 5.5.1. Western Europe Bioremediation Market Analysis by Application: Introduction
- 5.5.2. Market Size Absolute $ Opportunity Analysis and Forecast, By Application, 2016-2032
- 5.5.3. Soil Bioremediation
- 5.5.4. Water Bioremediation
- 5.5.5. Air Bioremediation
- 5.5.6. Sediment Bioremediation
- 5.5.7. Surface Bioremediation
- 5.5.8. Groundwater Bioremediation
- 5.5.9. Others
- 5.6. Western Europe Bioremediation Market Analysis, Opportunity and Forecast, By End User Industry, 2016-2032
- 5.6.1. Western Europe Bioremediation Market Analysis by End User Industry: Introduction
- 5.6.2. Market Size Absolute $ Opportunity Analysis and Forecast, By End User Industry, 2016-2032
- 5.6.3. Oil and Gas
- 5.6.4. Agriculture
- 5.6.5. Mining
- 5.6.6. Manufacturing
- 5.6.7. Construction
- 5.6.8. Waste Management
- 5.6.9. Healthcare
- 5.6.10. Others
- 5.7. Western Europe Bioremediation Market Analysis, Opportunity and Forecast, By Country , 2016-2032
- 5.7.1. Western Europe Bioremediation Market Analysis by Country : Introduction
- 5.7.2. Market Size Absolute $ Opportunity Analysis and Forecast, Country , 2016-2032
- 5.7.2.1. Germany
- 5.7.2.2. France
- 5.7.2.3. The UK
- 5.7.2.4. Spain
- 5.7.2.5. Italy
- 5.7.2.6. Portugal
- 5.7.2.7. Ireland
- 5.7.2.8. Austria
- 5.7.2.9. Switzerland
- 5.7.2.10. Benelux
- 5.7.2.11. Nordic
- 5.7.2.12. Rest of Western Europe
- 6. Eastern Europe Bioremediation Market Analysis, Opportunity and Forecast, 2016-2032
- 6.1. Eastern Europe Bioremediation Market Analysis, 2016-2021
- 6.2. Eastern Europe Bioremediation Market Opportunity and Forecast, 2023-2032
- 6.3. Eastern Europe Bioremediation Market Analysis, Opportunity and Forecast, By Type of Bioremediation, 2016-2032
- 6.3.1. Eastern Europe Bioremediation Market Analysis by Type of Bioremediation: Introduction
- 6.3.2. Market Size Absolute $ Opportunity Analysis and Forecast, By Type of Bioremediation, 2016-2032
- 6.3.3. Microbial Bioremediation
- 6.3.4. Phytoremediation
- 6.3.5. Mycoremediation
- 6.3.6. Bioaugmentation
- 6.3.7. Biostimulation
- 6.3.8. Rhizofiltration
- 6.3.9. Others
- 6.4. Eastern Europe Bioremediation Market Analysis, Opportunity and Forecast, By Contaminant Type, 2016-2032
- 6.4.1. Eastern Europe Bioremediation Market Analysis by Contaminant Type: Introduction
- 6.4.2. Market Size Absolute $ Opportunity Analysis and Forecast, By Contaminant Type, 2016-2032
- 6.4.3. Hydrocarbons
- 6.4.4. Heavy Metals
- 6.4.5. Organic Compounds
- 6.4.6. Radioactive Substances
- 6.4.7. PCBs
- 6.4.8. Others
- 6.5. Eastern Europe Bioremediation Market Analysis, Opportunity and Forecast, By Application, 2016-2032
- 6.5.1. Eastern Europe Bioremediation Market Analysis by Application: Introduction
- 6.5.2. Market Size Absolute $ Opportunity Analysis and Forecast, By Application, 2016-2032
- 6.5.3. Soil Bioremediation
- 6.5.4. Water Bioremediation
- 6.5.5. Air Bioremediation
- 6.5.6. Sediment Bioremediation
- 6.5.7. Surface Bioremediation
- 6.5.8. Groundwater Bioremediation
- 6.5.9. Others
- 6.6. Eastern Europe Bioremediation Market Analysis, Opportunity and Forecast, By End User Industry, 2016-2032
- 6.6.1. Eastern Europe Bioremediation Market Analysis by End User Industry: Introduction
- 6.6.2. Market Size Absolute $ Opportunity Analysis and Forecast, By End User Industry, 2016-2032
- 6.6.3. Oil and Gas
- 6.6.4. Agriculture
- 6.6.5. Mining
- 6.6.6. Manufacturing
- 6.6.7. Construction
- 6.6.8. Waste Management
- 6.6.9. Healthcare
- 6.6.10. Others
- 6.7. Eastern Europe Bioremediation Market Analysis, Opportunity and Forecast, By Country , 2016-2032
- 6.7.1. Eastern Europe Bioremediation Market Analysis by Country : Introduction
- 6.7.2. Market Size Absolute $ Opportunity Analysis and Forecast, Country , 2016-2032
- 6.7.2.1. Russia
- 6.7.2.2. Poland
- 6.7.2.3. The Czech Republic
- 6.7.2.4. Greece
- 6.7.2.5. Rest of Eastern Europe
- 7. APAC Bioremediation Market Analysis, Opportunity and Forecast, 2016-2032
- 7.1. APAC Bioremediation Market Analysis, 2016-2021
- 7.2. APAC Bioremediation Market Opportunity and Forecast, 2023-2032
- 7.3. APAC Bioremediation Market Analysis, Opportunity and Forecast, By Type of Bioremediation, 2016-2032
- 7.3.1. APAC Bioremediation Market Analysis by Type of Bioremediation: Introduction
- 7.3.2. Market Size Absolute $ Opportunity Analysis and Forecast, By Type of Bioremediation, 2016-2032
- 7.3.3. Microbial Bioremediation
- 7.3.4. Phytoremediation
- 7.3.5. Mycoremediation
- 7.3.6. Bioaugmentation
- 7.3.7. Biostimulation
- 7.3.8. Rhizofiltration
- 7.3.9. Others
- 7.4. APAC Bioremediation Market Analysis, Opportunity and Forecast, By Contaminant Type, 2016-2032
- 7.4.1. APAC Bioremediation Market Analysis by Contaminant Type: Introduction
- 7.4.2. Market Size Absolute $ Opportunity Analysis and Forecast, By Contaminant Type, 2016-2032
- 7.4.3. Hydrocarbons
- 7.4.4. Heavy Metals
- 7.4.5. Organic Compounds
- 7.4.6. Radioactive Substances
- 7.4.7. PCBs
- 7.4.8. Others
- 7.5. APAC Bioremediation Market Analysis, Opportunity and Forecast, By Application, 2016-2032
- 7.5.1. APAC Bioremediation Market Analysis by Application: Introduction
- 7.5.2. Market Size Absolute $ Opportunity Analysis and Forecast, By Application, 2016-2032
- 7.5.3. Soil Bioremediation
- 7.5.4. Water Bioremediation
- 7.5.5. Air Bioremediation
- 7.5.6. Sediment Bioremediation
- 7.5.7. Surface Bioremediation
- 7.5.8. Groundwater Bioremediation
- 7.5.9. Others
- 7.6. APAC Bioremediation Market Analysis, Opportunity and Forecast, By End User Industry, 2016-2032
- 7.6.1. APAC Bioremediation Market Analysis by End User Industry: Introduction
- 7.6.2. Market Size Absolute $ Opportunity Analysis and Forecast, By End User Industry, 2016-2032
- 7.6.3. Oil and Gas
- 7.6.4. Agriculture
- 7.6.5. Mining
- 7.6.6. Manufacturing
- 7.6.7. Construction
- 7.6.8. Waste Management
- 7.6.9. Healthcare
- 7.6.10. Others
- 7.7. APAC Bioremediation Market Analysis, Opportunity and Forecast, By Country , 2016-2032
- 7.7.1. APAC Bioremediation Market Analysis by Country : Introduction
- 7.7.2. Market Size Absolute $ Opportunity Analysis and Forecast, Country , 2016-2032
- 7.7.2.1. China
- 7.7.2.2. Japan
- 7.7.2.3. South Korea
- 7.7.2.4. India
- 7.7.2.5. Australia & New Zeland
- 7.7.2.6. Indonesia
- 7.7.2.7. Malaysia
- 7.7.2.8. Philippines
- 7.7.2.9. Singapore
- 7.7.2.10. Thailand
- 7.7.2.11. Vietnam
- 7.7.2.12. Rest of APAC
- 8. Latin America Bioremediation Market Analysis, Opportunity and Forecast, 2016-2032
- 8.1. Latin America Bioremediation Market Analysis, 2016-2021
- 8.2. Latin America Bioremediation Market Opportunity and Forecast, 2023-2032
- 8.3. Latin America Bioremediation Market Analysis, Opportunity and Forecast, By Type of Bioremediation, 2016-2032
- 8.3.1. Latin America Bioremediation Market Analysis by Type of Bioremediation: Introduction
- 8.3.2. Market Size Absolute $ Opportunity Analysis and Forecast, By Type of Bioremediation, 2016-2032
- 8.3.3. Microbial Bioremediation
- 8.3.4. Phytoremediation
- 8.3.5. Mycoremediation
- 8.3.6. Bioaugmentation
- 8.3.7. Biostimulation
- 8.3.8. Rhizofiltration
- 8.3.9. Others
- 8.4. Latin America Bioremediation Market Analysis, Opportunity and Forecast, By Contaminant Type, 2016-2032
- 8.4.1. Latin America Bioremediation Market Analysis by Contaminant Type: Introduction
- 8.4.2. Market Size Absolute $ Opportunity Analysis and Forecast, By Contaminant Type, 2016-2032
- 8.4.3. Hydrocarbons
- 8.4.4. Heavy Metals
- 8.4.5. Organic Compounds
- 8.4.6. Radioactive Substances
- 8.4.7. PCBs
- 8.4.8. Others
- 8.5. Latin America Bioremediation Market Analysis, Opportunity and Forecast, By Application, 2016-2032
- 8.5.1. Latin America Bioremediation Market Analysis by Application: Introduction
- 8.5.2. Market Size Absolute $ Opportunity Analysis and Forecast, By Application, 2016-2032
- 8.5.3. Soil Bioremediation
- 8.5.4. Water Bioremediation
- 8.5.5. Air Bioremediation
- 8.5.6. Sediment Bioremediation
- 8.5.7. Surface Bioremediation
- 8.5.8. Groundwater Bioremediation
- 8.5.9. Others
- 8.6. Latin America Bioremediation Market Analysis, Opportunity and Forecast, By End User Industry, 2016-2032
- 8.6.1. Latin America Bioremediation Market Analysis by End User Industry: Introduction
- 8.6.2. Market Size Absolute $ Opportunity Analysis and Forecast, By End User Industry, 2016-2032
- 8.6.3. Oil and Gas
- 8.6.4. Agriculture
- 8.6.5. Mining
- 8.6.6. Manufacturing
- 8.6.7. Construction
- 8.6.8. Waste Management
- 8.6.9. Healthcare
- 8.6.10. Others
- 8.7. Latin America Bioremediation Market Analysis, Opportunity and Forecast, By Country , 2016-2032
- 8.7.1. Latin America Bioremediation Market Analysis by Country : Introduction
- 8.7.2. Market Size Absolute $ Opportunity Analysis and Forecast, Country , 2016-2032
- 8.7.2.1. Brazil
- 8.7.2.2. Colombia
- 8.7.2.3. Chile
- 8.7.2.4. Argentina
- 8.7.2.5. Costa Rica
- 8.7.2.6. Rest of Latin America
- 9. Middle East & Africa Bioremediation Market Analysis, Opportunity and Forecast, 2016-2032
- 9.1. Middle East & Africa Bioremediation Market Analysis, 2016-2021
- 9.2. Middle East & Africa Bioremediation Market Opportunity and Forecast, 2023-2032
- 9.3. Middle East & Africa Bioremediation Market Analysis, Opportunity and Forecast, By Type of Bioremediation, 2016-2032
- 9.3.1. Middle East & Africa Bioremediation Market Analysis by Type of Bioremediation: Introduction
- 9.3.2. Market Size Absolute $ Opportunity Analysis and Forecast, By Type of Bioremediation, 2016-2032
- 9.3.3. Microbial Bioremediation
- 9.3.4. Phytoremediation
- 9.3.5. Mycoremediation
- 9.3.6. Bioaugmentation
- 9.3.7. Biostimulation
- 9.3.8. Rhizofiltration
- 9.3.9. Others
- 9.4. Middle East & Africa Bioremediation Market Analysis, Opportunity and Forecast, By Contaminant Type, 2016-2032
- 9.4.1. Middle East & Africa Bioremediation Market Analysis by Contaminant Type: Introduction
- 9.4.2. Market Size Absolute $ Opportunity Analysis and Forecast, By Contaminant Type, 2016-2032
- 9.4.3. Hydrocarbons
- 9.4.4. Heavy Metals
- 9.4.5. Organic Compounds
- 9.4.6. Radioactive Substances
- 9.4.7. PCBs
- 9.4.8. Others
- 9.5. Middle East & Africa Bioremediation Market Analysis, Opportunity and Forecast, By Application, 2016-2032
- 9.5.1. Middle East & Africa Bioremediation Market Analysis by Application: Introduction
- 9.5.2. Market Size Absolute $ Opportunity Analysis and Forecast, By Application, 2016-2032
- 9.5.3. Soil Bioremediation
- 9.5.4. Water Bioremediation
- 9.5.5. Air Bioremediation
- 9.5.6. Sediment Bioremediation
- 9.5.7. Surface Bioremediation
- 9.5.8. Groundwater Bioremediation
- 9.5.9. Others
- 9.6. Middle East & Africa Bioremediation Market Analysis, Opportunity and Forecast, By End User Industry, 2016-2032
- 9.6.1. Middle East & Africa Bioremediation Market Analysis by End User Industry: Introduction
- 9.6.2. Market Size Absolute $ Opportunity Analysis and Forecast, By End User Industry, 2016-2032
- 9.6.3. Oil and Gas
- 9.6.4. Agriculture
- 9.6.5. Mining
- 9.6.6. Manufacturing
- 9.6.7. Construction
- 9.6.8. Waste Management
- 9.6.9. Healthcare
- 9.6.10. Others
- 9.7. Middle East & Africa Bioremediation Market Analysis, Opportunity and Forecast, By Country , 2016-2032
- 9.7.1. Middle East & Africa Bioremediation Market Analysis by Country : Introduction
- 9.7.2. Market Size Absolute $ Opportunity Analysis and Forecast, Country , 2016-2032
- 9.7.2.1. Algeria
- 9.7.2.2. Egypt
- 9.7.2.3. Israel
- 9.7.2.4. Kuwait
- 9.7.2.5. Nigeria
- 9.7.2.6. Saudi Arabia
- 9.7.2.7. South Africa
- 9.7.2.8. Turkey
- 9.7.2.9. The UAE
- 9.7.2.10. Rest of MEA
- 10. Global Bioremediation Market Analysis, Opportunity and Forecast, By Region , 2016-2032
- 10.1. Global Bioremediation Market Analysis by Region : Introduction
- 10.2. Market Size Absolute $ Opportunity Analysis and Forecast, By Region , 2016-2032
- 10.2.1. North America
- 10.2.2. Western Europe
- 10.2.3. Eastern Europe
- 10.2.4. APAC
- 10.2.5. Latin America
- 10.2.6. Middle East & Africa
- 11. Global Bioremediation Market Competitive Landscape, Market Share Analysis, and Company Profiles
- 11.1. Market Share Analysis
- 11.2. Company Profiles
- 11.3. REGENESIS
- 11.3.1. Company Overview
- 11.3.2. Financial Highlights
- 11.3.3. Product Portfolio
- 11.3.4. SWOT Analysis
- 11.3.5. Key Strategies and Developments
- 11.4. BioSolve Group
- 11.4.1. Company Overview
- 11.4.2. Financial Highlights
- 11.4.3. Product Portfolio
- 11.4.4. SWOT Analysis
- 11.4.5. Key Strategies and Developments
- 11.5. Sevenson Environmental Services, Inc.
- 11.5.1. Company Overview
- 11.5.2. Financial Highlights
- 11.5.3. Product Portfolio
- 11.5.4. SWOT Analysis
- 11.5.5. Key Strategies and Developments
- 11.6. Xylem Inc.
- 11.6.1. Company Overview
- 11.6.2. Financial Highlights
- 11.6.3. Product Portfolio
- 11.6.4. SWOT Analysis
- 11.6.5. Key Strategies and Developments
- 11.7. Altogen Labs
- 11.7.1. Company Overview
- 11.7.2. Financial Highlights
- 11.7.3. Product Portfolio
- 11.7.4. SWOT Analysis
- 11.7.5. Key Strategies and Developments
- 11.8. SUEZ
- 11.8.1. Company Overview
- 11.8.2. Financial Highlights
- 11.8.3. Product Portfolio
- 11.8.4. SWOT Analysis
- 11.8.5. Key Strategies and Developments
- 11.9. Veolia Environment S.A.
- 11.9.1. Company Overview
- 11.9.2. Financial Highlights
- 11.9.3. Product Portfolio
- 11.9.4. SWOT Analysis
- 11.9.5. Key Strategies and Developments
- 11.10. Probiosphere Inc.
- 11.10.1. Company Overview
- 11.10.2. Financial Highlights
- 11.10.3. Product Portfolio
- 11.10.4. SWOT Analysis
- 11.10.5. Key Strategies and Developments
- 11.11. Envirogen Technologies, Inc.
- 11.11.1. Company Overview
- 11.11.2. Financial Highlights
- 11.11.3. Product Portfolio
- 11.11.4. SWOT Analysis
- 11.11.5. Key Strategies and Developments
- 11.12. Microgen Biotech Ltd.
- 11.12.1. Company Overview
- 11.12.2. Financial Highlights
- 11.12.3. Product Portfolio
- 11.12.4. SWOT Analysis
- 11.12.5. Key Strategies and Developments
- 11.13.1. Company Overview
- 11.13.2. Financial Highlights
- 11.13.3. Product Portfolio
- 11.13.4. SWOT Analysis
- 11.13.5. Key Strategies and Developments
- 11.14. Aquatech International LLC
- 11.14.1. Company Overview
- 11.14.2. Financial Highlights
- 11.14.3. Product Portfolio
- 11.14.4. SWOT Analysis
- 11.14.5. Key Strategies and Developments
- 11.15. Environmental Consulting & Technology, Inc. (ECT)
- 11.15.1. Company Overview
- 11.15.2. Financial Highlights
- 11.15.3. Product Portfolio
- 11.15.4. SWOT Analysis
- 11.15.5. Key Strategies and Developments
- 11.16. InSitu Remediation Services Ltd.
- 11.16.1. Company Overview
- 11.16.2. Financial Highlights
- 11.16.3. Product Portfolio
- 11.16.4. SWOT Analysis
- 11.16.5. Key Strategies and Developments
- 11.17. EOS Remediation, LLC
- 11.17.1. Company Overview
- 11.17.2. Financial Highlights
- 11.17.3. Product Portfolio
- 11.17.4. SWOT Analysis
- 11.17.5. Key Strategies and Developments
- 12. Assumptions and Acronyms
- 13. Research Methodology
- 14. Contact
- List of Figures
- Figure 1: Global Bioremediation Market Revenue (US$ Mn) Market Share by Type of Bioremediation in 2022
- Figure 2: Global Bioremediation Market Attractiveness Analysis by Type of Bioremediation, 2016-2032
- Figure 3: Global Bioremediation Market Revenue (US$ Mn) Market Share by Contaminant Typein 2022
- Figure 4: Global Bioremediation Market Attractiveness Analysis by Contaminant Type, 2016-2032
- Figure 5: Global Bioremediation Market Revenue (US$ Mn) Market Share by Applicationin 2022
- Figure 6: Global Bioremediation Market Attractiveness Analysis by Application, 2016-2032
- Figure 7: Global Bioremediation Market Revenue (US$ Mn) Market Share by End User Industryin 2022
- Figure 8: Global Bioremediation Market Attractiveness Analysis by End User Industry, 2016-2032
- Figure 9: Global Bioremediation Market Revenue (US$ Mn) Market Share by Region in 2022
- Figure 10: Global Bioremediation Market Attractiveness Analysis by Region, 2016-2032
- Figure 11: Global Bioremediation Market Revenue (US$ Mn) (2016-2032)
- Figure 12: Global Bioremediation Market Revenue (US$ Mn) Comparison by Region (2016-2032)
- Figure 13: Global Bioremediation Market Revenue (US$ Mn) Comparison by Type of Bioremediation (2016-2032)
- Figure 14: Global Bioremediation Market Revenue (US$ Mn) Comparison by Contaminant Type (2016-2032)
- Figure 15: Global Bioremediation Market Revenue (US$ Mn) Comparison by Application (2016-2032)
- Figure 16: Global Bioremediation Market Revenue (US$ Mn) Comparison by End User Industry (2016-2032)
- Figure 17: Global Bioremediation Market Y-o-Y Growth Rate Comparison by Region (2016-2032)
- Figure 18: Global Bioremediation Market Y-o-Y Growth Rate Comparison by Type of Bioremediation (2016-2032)
- Figure 19: Global Bioremediation Market Y-o-Y Growth Rate Comparison by Contaminant Type (2016-2032)
- Figure 20: Global Bioremediation Market Y-o-Y Growth Rate Comparison by Application (2016-2032)
- Figure 21: Global Bioremediation Market Y-o-Y Growth Rate Comparison by End User Industry (2016-2032)
- Figure 22: Global Bioremediation Market Share Comparison by Region (2016-2032)
- Figure 23: Global Bioremediation Market Share Comparison by Type of Bioremediation (2016-2032)
- Figure 24: Global Bioremediation Market Share Comparison by Contaminant Type (2016-2032)
- Figure 25: Global Bioremediation Market Share Comparison by Application (2016-2032)
- Figure 26: Global Bioremediation Market Share Comparison by End User Industry (2016-2032)
- Figure 27: North America Bioremediation Market Revenue (US$ Mn) Market Share by Type of Bioremediationin 2022
- Figure 28: North America Bioremediation Market Attractiveness Analysis by Type of Bioremediation, 2016-2032
- Figure 29: North America Bioremediation Market Revenue (US$ Mn) Market Share by Contaminant Typein 2022
- Figure 30: North America Bioremediation Market Attractiveness Analysis by Contaminant Type, 2016-2032
- Figure 31: North America Bioremediation Market Revenue (US$ Mn) Market Share by Applicationin 2022
- Figure 32: North America Bioremediation Market Attractiveness Analysis by Application, 2016-2032
- Figure 33: North America Bioremediation Market Revenue (US$ Mn) Market Share by End User Industryin 2022
- Figure 34: North America Bioremediation Market Attractiveness Analysis by End User Industry, 2016-2032
- Figure 35: North America Bioremediation Market Revenue (US$ Mn) Market Share by Country in 2022
- Figure 36: North America Bioremediation Market Attractiveness Analysis by Country, 2016-2032
- Figure 37: North America Bioremediation Market Revenue (US$ Mn) (2016-2032)
- Figure 38: North America Bioremediation Market Revenue (US$ Mn) Comparison by Country (2016-2032)
- Figure 39: North America Bioremediation Market Revenue (US$ Mn) Comparison by Type of Bioremediation (2016-2032)
- Figure 40: North America Bioremediation Market Revenue (US$ Mn) Comparison by Contaminant Type (2016-2032)
- Figure 41: North America Bioremediation Market Revenue (US$ Mn) Comparison by Application (2016-2032)
- Figure 42: North America Bioremediation Market Revenue (US$ Mn) Comparison by End User Industry (2016-2032)
- Figure 43: North America Bioremediation Market Y-o-Y Growth Rate Comparison by Country (2016-2032)
- Figure 44: North America Bioremediation Market Y-o-Y Growth Rate Comparison by Type of Bioremediation (2016-2032)
- Figure 45: North America Bioremediation Market Y-o-Y Growth Rate Comparison by Contaminant Type (2016-2032)
- Figure 46: North America Bioremediation Market Y-o-Y Growth Rate Comparison by Application (2016-2032)
- Figure 47: North America Bioremediation Market Y-o-Y Growth Rate Comparison by End User Industry (2016-2032)
- Figure 48: North America Bioremediation Market Share Comparison by Country (2016-2032)
- Figure 49: North America Bioremediation Market Share Comparison by Type of Bioremediation (2016-2032)
- Figure 50: North America Bioremediation Market Share Comparison by Contaminant Type (2016-2032)
- Figure 51: North America Bioremediation Market Share Comparison by Application (2016-2032)
- Figure 52: North America Bioremediation Market Share Comparison by End User Industry (2016-2032)
- Figure 53: Western Europe Bioremediation Market Revenue (US$ Mn) Market Share by Type of Bioremediationin 2022
- Figure 54: Western Europe Bioremediation Market Attractiveness Analysis by Type of Bioremediation, 2016-2032
- Figure 55: Western Europe Bioremediation Market Revenue (US$ Mn) Market Share by Contaminant Typein 2022
- Figure 56: Western Europe Bioremediation Market Attractiveness Analysis by Contaminant Type, 2016-2032
- Figure 57: Western Europe Bioremediation Market Revenue (US$ Mn) Market Share by Applicationin 2022
- Figure 58: Western Europe Bioremediation Market Attractiveness Analysis by Application, 2016-2032
- Figure 59: Western Europe Bioremediation Market Revenue (US$ Mn) Market Share by End User Industryin 2022
- Figure 60: Western Europe Bioremediation Market Attractiveness Analysis by End User Industry, 2016-2032
- Figure 61: Western Europe Bioremediation Market Revenue (US$ Mn) Market Share by Country in 2022
- Figure 62: Western Europe Bioremediation Market Attractiveness Analysis by Country, 2016-2032
- Figure 63: Western Europe Bioremediation Market Revenue (US$ Mn) (2016-2032)
- Figure 64: Western Europe Bioremediation Market Revenue (US$ Mn) Comparison by Country (2016-2032)
- Figure 65: Western Europe Bioremediation Market Revenue (US$ Mn) Comparison by Type of Bioremediation (2016-2032)
- Figure 66: Western Europe Bioremediation Market Revenue (US$ Mn) Comparison by Contaminant Type (2016-2032)
- Figure 67: Western Europe Bioremediation Market Revenue (US$ Mn) Comparison by Application (2016-2032)
- Figure 68: Western Europe Bioremediation Market Revenue (US$ Mn) Comparison by End User Industry (2016-2032)
- Figure 69: Western Europe Bioremediation Market Y-o-Y Growth Rate Comparison by Country (2016-2032)
- Figure 70: Western Europe Bioremediation Market Y-o-Y Growth Rate Comparison by Type of Bioremediation (2016-2032)
- Figure 71: Western Europe Bioremediation Market Y-o-Y Growth Rate Comparison by Contaminant Type (2016-2032)
- Figure 72: Western Europe Bioremediation Market Y-o-Y Growth Rate Comparison by Application (2016-2032)
- Figure 73: Western Europe Bioremediation Market Y-o-Y Growth Rate Comparison by End User Industry (2016-2032)
- Figure 74: Western Europe Bioremediation Market Share Comparison by Country (2016-2032)
- Figure 75: Western Europe Bioremediation Market Share Comparison by Type of Bioremediation (2016-2032)
- Figure 76: Western Europe Bioremediation Market Share Comparison by Contaminant Type (2016-2032)
- Figure 77: Western Europe Bioremediation Market Share Comparison by Application (2016-2032)
- Figure 78: Western Europe Bioremediation Market Share Comparison by End User Industry (2016-2032)
- Figure 79: Eastern Europe Bioremediation Market Revenue (US$ Mn) Market Share by Type of Bioremediationin 2022
- Figure 80: Eastern Europe Bioremediation Market Attractiveness Analysis by Type of Bioremediation, 2016-2032
- Figure 81: Eastern Europe Bioremediation Market Revenue (US$ Mn) Market Share by Contaminant Typein 2022
- Figure 82: Eastern Europe Bioremediation Market Attractiveness Analysis by Contaminant Type, 2016-2032
- Figure 83: Eastern Europe Bioremediation Market Revenue (US$ Mn) Market Share by Applicationin 2022
- Figure 84: Eastern Europe Bioremediation Market Attractiveness Analysis by Application, 2016-2032
- Figure 85: Eastern Europe Bioremediation Market Revenue (US$ Mn) Market Share by End User Industryin 2022
- Figure 86: Eastern Europe Bioremediation Market Attractiveness Analysis by End User Industry, 2016-2032
- Figure 87: Eastern Europe Bioremediation Market Revenue (US$ Mn) Market Share by Country in 2022
- Figure 88: Eastern Europe Bioremediation Market Attractiveness Analysis by Country, 2016-2032
- Figure 89: Eastern Europe Bioremediation Market Revenue (US$ Mn) (2016-2032)
- Figure 90: Eastern Europe Bioremediation Market Revenue (US$ Mn) Comparison by Country (2016-2032)
- Figure 91: Eastern Europe Bioremediation Market Revenue (US$ Mn) Comparison by Type of Bioremediation (2016-2032)
- Figure 92: Eastern Europe Bioremediation Market Revenue (US$ Mn) Comparison by Contaminant Type (2016-2032)
- Figure 93: Eastern Europe Bioremediation Market Revenue (US$ Mn) Comparison by Application (2016-2032)
- Figure 94: Eastern Europe Bioremediation Market Revenue (US$ Mn) Comparison by End User Industry (2016-2032)
- Figure 95: Eastern Europe Bioremediation Market Y-o-Y Growth Rate Comparison by Country (2016-2032)
- Figure 96: Eastern Europe Bioremediation Market Y-o-Y Growth Rate Comparison by Type of Bioremediation (2016-2032)
- Figure 97: Eastern Europe Bioremediation Market Y-o-Y Growth Rate Comparison by Contaminant Type (2016-2032)
- Figure 98: Eastern Europe Bioremediation Market Y-o-Y Growth Rate Comparison by Application (2016-2032)
- Figure 99: Eastern Europe Bioremediation Market Y-o-Y Growth Rate Comparison by End User Industry (2016-2032)
- Figure 100: Eastern Europe Bioremediation Market Share Comparison by Country (2016-2032)
- Figure 101: Eastern Europe Bioremediation Market Share Comparison by Type of Bioremediation (2016-2032)
- Figure 102: Eastern Europe Bioremediation Market Share Comparison by Contaminant Type (2016-2032)
- Figure 103: Eastern Europe Bioremediation Market Share Comparison by Application (2016-2032)
- Figure 104: Eastern Europe Bioremediation Market Share Comparison by End User Industry (2016-2032)
- Figure 105: APAC Bioremediation Market Revenue (US$ Mn) Market Share by Type of Bioremediationin 2022
- Figure 106: APAC Bioremediation Market Attractiveness Analysis by Type of Bioremediation, 2016-2032
- Figure 107: APAC Bioremediation Market Revenue (US$ Mn) Market Share by Contaminant Typein 2022
- Figure 108: APAC Bioremediation Market Attractiveness Analysis by Contaminant Type, 2016-2032
- Figure 109: APAC Bioremediation Market Revenue (US$ Mn) Market Share by Applicationin 2022
- Figure 110: APAC Bioremediation Market Attractiveness Analysis by Application, 2016-2032
- Figure 111: APAC Bioremediation Market Revenue (US$ Mn) Market Share by End User Industryin 2022
- Figure 112: APAC Bioremediation Market Attractiveness Analysis by End User Industry, 2016-2032
- Figure 113: APAC Bioremediation Market Revenue (US$ Mn) Market Share by Country in 2022
- Figure 114: APAC Bioremediation Market Attractiveness Analysis by Country, 2016-2032
- Figure 115: APAC Bioremediation Market Revenue (US$ Mn) (2016-2032)
- Figure 116: APAC Bioremediation Market Revenue (US$ Mn) Comparison by Country (2016-2032)
- Figure 117: APAC Bioremediation Market Revenue (US$ Mn) Comparison by Type of Bioremediation (2016-2032)
- Figure 118: APAC Bioremediation Market Revenue (US$ Mn) Comparison by Contaminant Type (2016-2032)
- Figure 119: APAC Bioremediation Market Revenue (US$ Mn) Comparison by Application (2016-2032)
- Figure 120: APAC Bioremediation Market Revenue (US$ Mn) Comparison by End User Industry (2016-2032)
- Figure 121: APAC Bioremediation Market Y-o-Y Growth Rate Comparison by Country (2016-2032)
- Figure 122: APAC Bioremediation Market Y-o-Y Growth Rate Comparison by Type of Bioremediation (2016-2032)
- Figure 123: APAC Bioremediation Market Y-o-Y Growth Rate Comparison by Contaminant Type (2016-2032)
- Figure 124: APAC Bioremediation Market Y-o-Y Growth Rate Comparison by Application (2016-2032)
- Figure 125: APAC Bioremediation Market Y-o-Y Growth Rate Comparison by End User Industry (2016-2032)
- Figure 126: APAC Bioremediation Market Share Comparison by Country (2016-2032)
- Figure 127: APAC Bioremediation Market Share Comparison by Type of Bioremediation (2016-2032)
- Figure 128: APAC Bioremediation Market Share Comparison by Contaminant Type (2016-2032)
- Figure 129: APAC Bioremediation Market Share Comparison by Application (2016-2032)
- Figure 130: APAC Bioremediation Market Share Comparison by End User Industry (2016-2032)
- Figure 131: Latin America Bioremediation Market Revenue (US$ Mn) Market Share by Type of Bioremediationin 2022
- Figure 132: Latin America Bioremediation Market Attractiveness Analysis by Type of Bioremediation, 2016-2032
- Figure 133: Latin America Bioremediation Market Revenue (US$ Mn) Market Share by Contaminant Typein 2022
- Figure 134: Latin America Bioremediation Market Attractiveness Analysis by Contaminant Type, 2016-2032
- Figure 135: Latin America Bioremediation Market Revenue (US$ Mn) Market Share by Applicationin 2022
- Figure 136: Latin America Bioremediation Market Attractiveness Analysis by Application, 2016-2032
- Figure 137: Latin America Bioremediation Market Revenue (US$ Mn) Market Share by End User Industryin 2022
- Figure 138: Latin America Bioremediation Market Attractiveness Analysis by End User Industry, 2016-2032
- Figure 139: Latin America Bioremediation Market Revenue (US$ Mn) Market Share by Country in 2022
- Figure 140: Latin America Bioremediation Market Attractiveness Analysis by Country, 2016-2032
- Figure 141: Latin America Bioremediation Market Revenue (US$ Mn) (2016-2032)
- Figure 142: Latin America Bioremediation Market Revenue (US$ Mn) Comparison by Country (2016-2032)
- Figure 143: Latin America Bioremediation Market Revenue (US$ Mn) Comparison by Type of Bioremediation (2016-2032)
- Figure 144: Latin America Bioremediation Market Revenue (US$ Mn) Comparison by Contaminant Type (2016-2032)
- Figure 145: Latin America Bioremediation Market Revenue (US$ Mn) Comparison by Application (2016-2032)
- Figure 146: Latin America Bioremediation Market Revenue (US$ Mn) Comparison by End User Industry (2016-2032)
- Figure 147: Latin America Bioremediation Market Y-o-Y Growth Rate Comparison by Country (2016-2032)
- Figure 148: Latin America Bioremediation Market Y-o-Y Growth Rate Comparison by Type of Bioremediation (2016-2032)
- Figure 149: Latin America Bioremediation Market Y-o-Y Growth Rate Comparison by Contaminant Type (2016-2032)
- Figure 150: Latin America Bioremediation Market Y-o-Y Growth Rate Comparison by Application (2016-2032)
- Figure 151: Latin America Bioremediation Market Y-o-Y Growth Rate Comparison by End User Industry (2016-2032)
- Figure 152: Latin America Bioremediation Market Share Comparison by Country (2016-2032)
- Figure 153: Latin America Bioremediation Market Share Comparison by Type of Bioremediation (2016-2032)
- Figure 154: Latin America Bioremediation Market Share Comparison by Contaminant Type (2016-2032)
- Figure 155: Latin America Bioremediation Market Share Comparison by Application (2016-2032)
- Figure 156: Latin America Bioremediation Market Share Comparison by End User Industry (2016-2032)
- Figure 157: Middle East & Africa Bioremediation Market Revenue (US$ Mn) Market Share by Type of Bioremediationin 2022
- Figure 158: Middle East & Africa Bioremediation Market Attractiveness Analysis by Type of Bioremediation, 2016-2032
- Figure 159: Middle East & Africa Bioremediation Market Revenue (US$ Mn) Market Share by Contaminant Typein 2022
- Figure 160: Middle East & Africa Bioremediation Market Attractiveness Analysis by Contaminant Type, 2016-2032
- Figure 161: Middle East & Africa Bioremediation Market Revenue (US$ Mn) Market Share by Applicationin 2022
- Figure 162: Middle East & Africa Bioremediation Market Attractiveness Analysis by Application, 2016-2032
- Figure 163: Middle East & Africa Bioremediation Market Revenue (US$ Mn) Market Share by End User Industryin 2022
- Figure 164: Middle East & Africa Bioremediation Market Attractiveness Analysis by End User Industry, 2016-2032
- Figure 165: Middle East & Africa Bioremediation Market Revenue (US$ Mn) Market Share by Country in 2022
- Figure 166: Middle East & Africa Bioremediation Market Attractiveness Analysis by Country, 2016-2032
- Figure 167: Middle East & Africa Bioremediation Market Revenue (US$ Mn) (2016-2032)
- Figure 168: Middle East & Africa Bioremediation Market Revenue (US$ Mn) Comparison by Country (2016-2032)
- Figure 169: Middle East & Africa Bioremediation Market Revenue (US$ Mn) Comparison by Type of Bioremediation (2016-2032)
- Figure 170: Middle East & Africa Bioremediation Market Revenue (US$ Mn) Comparison by Contaminant Type (2016-2032)
- Figure 171: Middle East & Africa Bioremediation Market Revenue (US$ Mn) Comparison by Application (2016-2032)
- Figure 172: Middle East & Africa Bioremediation Market Revenue (US$ Mn) Comparison by End User Industry (2016-2032)
- Figure 173: Middle East & Africa Bioremediation Market Y-o-Y Growth Rate Comparison by Country (2016-2032)
- Figure 174: Middle East & Africa Bioremediation Market Y-o-Y Growth Rate Comparison by Type of Bioremediation (2016-2032)
- Figure 175: Middle East & Africa Bioremediation Market Y-o-Y Growth Rate Comparison by Contaminant Type (2016-2032)
- Figure 176: Middle East & Africa Bioremediation Market Y-o-Y Growth Rate Comparison by Application (2016-2032)
- Figure 177: Middle East & Africa Bioremediation Market Y-o-Y Growth Rate Comparison by End User Industry (2016-2032)
- Figure 178: Middle East & Africa Bioremediation Market Share Comparison by Country (2016-2032)
- Figure 179: Middle East & Africa Bioremediation Market Share Comparison by Type of Bioremediation (2016-2032)
- Figure 180: Middle East & Africa Bioremediation Market Share Comparison by Contaminant Type (2016-2032)
- Figure 181: Middle East & Africa Bioremediation Market Share Comparison by Application (2016-2032)
- Figure 182: Middle East & Africa Bioremediation Market Share Comparison by End User Industry (2016-2032)
- List of Tables
- Table 1: Global Bioremediation Market Comparison by Type of Bioremediation (2016-2032)
- Table 2: Global Bioremediation Market Comparison by Contaminant Type (2016-2032)
- Table 3: Global Bioremediation Market Comparison by Application (2016-2032)
- Table 4: Global Bioremediation Market Comparison by End User Industry (2016-2032)
- Table 5: Global Bioremediation Market Revenue (US$ Mn) Comparison by Region (2016-2032)
- Table 6: Global Bioremediation Market Revenue (US$ Mn) (2016-2032)
- Table 7: Global Bioremediation Market Revenue (US$ Mn) Comparison by Region (2016-2032)
- Table 8: Global Bioremediation Market Revenue (US$ Mn) Comparison by Type of Bioremediation (2016-2032)
- Table 9: Global Bioremediation Market Revenue (US$ Mn) Comparison by Contaminant Type (2016-2032)
- Table 10: Global Bioremediation Market Revenue (US$ Mn) Comparison by Application (2016-2032)
- Table 11: Global Bioremediation Market Revenue (US$ Mn) Comparison by End User Industry (2016-2032)
- Table 12: Global Bioremediation Market Y-o-Y Growth Rate Comparison by Region (2016-2032)
- Table 13: Global Bioremediation Market Y-o-Y Growth Rate Comparison by Type of Bioremediation (2016-2032)
- Table 14: Global Bioremediation Market Y-o-Y Growth Rate Comparison by Contaminant Type (2016-2032)
- Table 15: Global Bioremediation Market Y-o-Y Growth Rate Comparison by Application (2016-2032)
- Table 16: Global Bioremediation Market Y-o-Y Growth Rate Comparison by End User Industry (2016-2032)
- Table 17: Global Bioremediation Market Share Comparison by Region (2016-2032)
- Table 18: Global Bioremediation Market Share Comparison by Type of Bioremediation (2016-2032)
- Table 19: Global Bioremediation Market Share Comparison by Contaminant Type (2016-2032)
- Table 20: Global Bioremediation Market Share Comparison by Application (2016-2032)
- Table 21: Global Bioremediation Market Share Comparison by End User Industry (2016-2032)
- Table 22: North America Bioremediation Market Comparison by Contaminant Type (2016-2032)
- Table 23: North America Bioremediation Market Comparison by Application (2016-2032)
- Table 24: North America Bioremediation Market Comparison by End User Industry (2016-2032)
- Table 25: North America Bioremediation Market Revenue (US$ Mn) Comparison by Country (2016-2032)
- Table 26: North America Bioremediation Market Revenue (US$ Mn) (2016-2032)
- Table 27: North America Bioremediation Market Revenue (US$ Mn) Comparison by Country (2016-2032)
- Table 28: North America Bioremediation Market Revenue (US$ Mn) Comparison by Type of Bioremediation (2016-2032)
- Table 29: North America Bioremediation Market Revenue (US$ Mn) Comparison by Contaminant Type (2016-2032)
- Table 30: North America Bioremediation Market Revenue (US$ Mn) Comparison by Application (2016-2032)
- Table 31: North America Bioremediation Market Revenue (US$ Mn) Comparison by End User Industry (2016-2032)
- Table 32: North America Bioremediation Market Y-o-Y Growth Rate Comparison by Country (2016-2032)
- Table 33: North America Bioremediation Market Y-o-Y Growth Rate Comparison by Type of Bioremediation (2016-2032)
- Table 34: North America Bioremediation Market Y-o-Y Growth Rate Comparison by Contaminant Type (2016-2032)
- Table 35: North America Bioremediation Market Y-o-Y Growth Rate Comparison by Application (2016-2032)
- Table 36: North America Bioremediation Market Y-o-Y Growth Rate Comparison by End User Industry (2016-2032)
- Table 37: North America Bioremediation Market Share Comparison by Country (2016-2032)
- Table 38: North America Bioremediation Market Share Comparison by Type of Bioremediation (2016-2032)
- Table 39: North America Bioremediation Market Share Comparison by Contaminant Type (2016-2032)
- Table 40: North America Bioremediation Market Share Comparison by Application (2016-2032)
- Table 41: North America Bioremediation Market Share Comparison by End User Industry (2016-2032)
- Table 42: Western Europe Bioremediation Market Comparison by Type of Bioremediation (2016-2032)
- Table 43: Western Europe Bioremediation Market Comparison by Contaminant Type (2016-2032)
- Table 44: Western Europe Bioremediation Market Comparison by Application (2016-2032)
- Table 45: Western Europe Bioremediation Market Comparison by End User Industry (2016-2032)
- Table 46: Western Europe Bioremediation Market Revenue (US$ Mn) Comparison by Country (2016-2032)
- Table 47: Western Europe Bioremediation Market Revenue (US$ Mn) (2016-2032)
- Table 48: Western Europe Bioremediation Market Revenue (US$ Mn) Comparison by Country (2016-2032)
- Table 49: Western Europe Bioremediation Market Revenue (US$ Mn) Comparison by Type of Bioremediation (2016-2032)
- Table 50: Western Europe Bioremediation Market Revenue (US$ Mn) Comparison by Contaminant Type (2016-2032)
- Table 51: Western Europe Bioremediation Market Revenue (US$ Mn) Comparison by Application (2016-2032)
- Table 52: Western Europe Bioremediation Market Revenue (US$ Mn) Comparison by End User Industry (2016-2032)
- Table 53: Western Europe Bioremediation Market Y-o-Y Growth Rate Comparison by Country (2016-2032)
- Table 54: Western Europe Bioremediation Market Y-o-Y Growth Rate Comparison by Type of Bioremediation (2016-2032)
- Table 55: Western Europe Bioremediation Market Y-o-Y Growth Rate Comparison by Contaminant Type (2016-2032)
- Table 56: Western Europe Bioremediation Market Y-o-Y Growth Rate Comparison by Application (2016-2032)
- Table 57: Western Europe Bioremediation Market Y-o-Y Growth Rate Comparison by End User Industry (2016-2032)
- Table 58: Western Europe Bioremediation Market Share Comparison by Country (2016-2032)
- Table 59: Western Europe Bioremediation Market Share Comparison by Type of Bioremediation (2016-2032)
- Table 60: Western Europe Bioremediation Market Share Comparison by Contaminant Type (2016-2032)
- Table 61: Western Europe Bioremediation Market Share Comparison by Application (2016-2032)
- Table 62: Western Europe Bioremediation Market Share Comparison by End User Industry (2016-2032)
- Table 63: Eastern Europe Bioremediation Market Comparison by Type of Bioremediation (2016-2032)
- Table 64: Eastern Europe Bioremediation Market Comparison by Contaminant Type (2016-2032)
- Table 65: Eastern Europe Bioremediation Market Comparison by Application (2016-2032)
- Table 66: Eastern Europe Bioremediation Market Comparison by End User Industry (2016-2032)
- Table 67: Eastern Europe Bioremediation Market Revenue (US$ Mn) Comparison by Country (2016-2032)
- Table 68: Eastern Europe Bioremediation Market Revenue (US$ Mn) (2016-2032)
- Table 69: Eastern Europe Bioremediation Market Revenue (US$ Mn) Comparison by Country (2016-2032)
- Table 70: Eastern Europe Bioremediation Market Revenue (US$ Mn) Comparison by Type of Bioremediation (2016-2032)
- Table 71: Eastern Europe Bioremediation Market Revenue (US$ Mn) Comparison by Contaminant Type (2016-2032)
- Table 72: Eastern Europe Bioremediation Market Revenue (US$ Mn) Comparison by Application (2016-2032)
- Table 73: Eastern Europe Bioremediation Market Revenue (US$ Mn) Comparison by End User Industry (2016-2032)
- Table 74: Eastern Europe Bioremediation Market Y-o-Y Growth Rate Comparison by Country (2016-2032)
- Table 75: Eastern Europe Bioremediation Market Y-o-Y Growth Rate Comparison by Type of Bioremediation (2016-2032)
- Table 76: Eastern Europe Bioremediation Market Y-o-Y Growth Rate Comparison by Contaminant Type (2016-2032)
- Table 77: Eastern Europe Bioremediation Market Y-o-Y Growth Rate Comparison by Application (2016-2032)
- Table 78: Eastern Europe Bioremediation Market Y-o-Y Growth Rate Comparison by End User Industry (2016-2032)
- Table 79: Eastern Europe Bioremediation Market Share Comparison by Country (2016-2032)
- Table 80: Eastern Europe Bioremediation Market Share Comparison by Type of Bioremediation (2016-2032)
- Table 81: Eastern Europe Bioremediation Market Share Comparison by Contaminant Type (2016-2032)
- Table 82: Eastern Europe Bioremediation Market Share Comparison by Application (2016-2032)
- Table 83: Eastern Europe Bioremediation Market Share Comparison by End User Industry (2016-2032)
- Table 84: APAC Bioremediation Market Comparison by Type of Bioremediation (2016-2032)
- Table 85: APAC Bioremediation Market Comparison by Contaminant Type (2016-2032)
- Table 86: APAC Bioremediation Market Comparison by Application (2016-2032)
- Table 87: APAC Bioremediation Market Comparison by End User Industry (2016-2032)
- Table 88: APAC Bioremediation Market Revenue (US$ Mn) Comparison by Country (2016-2032)
- Table 89: APAC Bioremediation Market Revenue (US$ Mn) (2016-2032)
- Table 90: APAC Bioremediation Market Revenue (US$ Mn) Comparison by Country (2016-2032)
- Table 91: APAC Bioremediation Market Revenue (US$ Mn) Comparison by Type of Bioremediation (2016-2032)
- Table 92: APAC Bioremediation Market Revenue (US$ Mn) Comparison by Contaminant Type (2016-2032)
- Table 93: APAC Bioremediation Market Revenue (US$ Mn) Comparison by Application (2016-2032)
- Table 94: APAC Bioremediation Market Revenue (US$ Mn) Comparison by End User Industry (2016-2032)
- Table 95: APAC Bioremediation Market Y-o-Y Growth Rate Comparison by Country (2016-2032)
- Table 96: APAC Bioremediation Market Y-o-Y Growth Rate Comparison by Type of Bioremediation (2016-2032)
- Table 97: APAC Bioremediation Market Y-o-Y Growth Rate Comparison by Contaminant Type (2016-2032)
- Table 98: APAC Bioremediation Market Y-o-Y Growth Rate Comparison by Application (2016-2032)
- Table 99: APAC Bioremediation Market Y-o-Y Growth Rate Comparison by End User Industry (2016-2032)
- Table 100: APAC Bioremediation Market Share Comparison by Country (2016-2032)
- Table 101: APAC Bioremediation Market Share Comparison by Type of Bioremediation (2016-2032)
- Table 102: APAC Bioremediation Market Share Comparison by Contaminant Type (2016-2032)
- Table 103: APAC Bioremediation Market Share Comparison by Application (2016-2032)
- Table 104: APAC Bioremediation Market Share Comparison by End User Industry (2016-2032)
- Table 105: Latin America Bioremediation Market Comparison by Type of Bioremediation (2016-2032)
- Table 106: Latin America Bioremediation Market Comparison by Contaminant Type (2016-2032)
- Table 107: Latin America Bioremediation Market Comparison by Application (2016-2032)
- Table 108: Latin America Bioremediation Market Comparison by End User Industry (2016-2032)
- Table 109: Latin America Bioremediation Market Revenue (US$ Mn) Comparison by Country (2016-2032)
- Table 110: Latin America Bioremediation Market Revenue (US$ Mn) (2016-2032)
- Table 111: Latin America Bioremediation Market Revenue (US$ Mn) Comparison by Country (2016-2032)
- Table 112: Latin America Bioremediation Market Revenue (US$ Mn) Comparison by Type of Bioremediation (2016-2032)
- Table 113: Latin America Bioremediation Market Revenue (US$ Mn) Comparison by Contaminant Type (2016-2032)
- Table 114: Latin America Bioremediation Market Revenue (US$ Mn) Comparison by Application (2016-2032)
- Table 115: Latin America Bioremediation Market Revenue (US$ Mn) Comparison by End User Industry (2016-2032)
- Table 116: Latin America Bioremediation Market Y-o-Y Growth Rate Comparison by Country (2016-2032)
- Table 117: Latin America Bioremediation Market Y-o-Y Growth Rate Comparison by Type of Bioremediation (2016-2032)
- Table 118: Latin America Bioremediation Market Y-o-Y Growth Rate Comparison by Contaminant Type (2016-2032)
- Table 119: Latin America Bioremediation Market Y-o-Y Growth Rate Comparison by Application (2016-2032)
- Table 120: Latin America Bioremediation Market Y-o-Y Growth Rate Comparison by End User Industry (2016-2032)
- Table 121: Latin America Bioremediation Market Share Comparison by Country (2016-2032)
- Table 122: Latin America Bioremediation Market Share Comparison by Type of Bioremediation (2016-2032)
- Table 123: Latin America Bioremediation Market Share Comparison by Contaminant Type (2016-2032)
- Table 124: Latin America Bioremediation Market Share Comparison by Application (2016-2032)
- Table 125: Latin America Bioremediation Market Share Comparison by End User Industry (2016-2032)
- Table 126: Middle East & Africa Bioremediation Market Comparison by Type of Bioremediation (2016-2032)
- Table 127: Middle East & Africa Bioremediation Market Comparison by Contaminant Type (2016-2032)
- Table 128: Middle East & Africa Bioremediation Market Comparison by Application (2016-2032)
- Table 129: Middle East & Africa Bioremediation Market Comparison by End User Industry (2016-2032)
- Table 130: Middle East & Africa Bioremediation Market Revenue (US$ Mn) Comparison by Country (2016-2032)
- Table 131: Middle East & Africa Bioremediation Market Revenue (US$ Mn) (2016-2032)
- Table 132: Middle East & Africa Bioremediation Market Revenue (US$ Mn) Comparison by Country (2016-2032)
- Table 133: Middle East & Africa Bioremediation Market Revenue (US$ Mn) Comparison by Type of Bioremediation (2016-2032)
- Table 134: Middle East & Africa Bioremediation Market Revenue (US$ Mn) Comparison by Contaminant Type (2016-2032)
- Table 135: Middle East & Africa Bioremediation Market Revenue (US$ Mn) Comparison by Application (2016-2032)
- Table 136: Middle East & Africa Bioremediation Market Revenue (US$ Mn) Comparison by End User Industry (2016-2032)
- Table 137: Middle East & Africa Bioremediation Market Y-o-Y Growth Rate Comparison by Country (2016-2032)
- Table 138: Middle East & Africa Bioremediation Market Y-o-Y Growth Rate Comparison by Type of Bioremediation (2016-2032)
- Table 139: Middle East & Africa Bioremediation Market Y-o-Y Growth Rate Comparison by Contaminant Type (2016-2032)
- Table 140: Middle East & Africa Bioremediation Market Y-o-Y Growth Rate Comparison by Application (2016-2032)
- Table 141: Middle East & Africa Bioremediation Market Y-o-Y Growth Rate Comparison by End User Industry (2016-2032)
- Table 142: Middle East & Africa Bioremediation Market Share Comparison by Country (2016-2032)
- Table 143: Middle East & Africa Bioremediation Market Share Comparison by Type of Bioremediation (2016-2032)
- Table 144: Middle East & Africa Bioremediation Market Share Comparison by Contaminant Type (2016-2032)
- Table 145: Middle East & Africa Bioremediation Market Share Comparison by Application (2016-2032)
- Table 146: Middle East & Africa Bioremediation Market Share Comparison by End User Industry (2016-2032)
- 1. Executive Summary
-
- REGENESIS
- BioSolve Group
- Sevenson Environmental Services, Inc.
- Xylem Inc.
- Altogen Labs
- SUEZ
- Veolia Environment S.A.
- Probiosphere Inc.
- Envirogen Technologies, Inc.
- Microgen Biotech Ltd.
- Aquatech International LLC
- Thermo Fisher Scientific Inc.
- Environmental Consulting & Technology, Inc. (ECT)
- InSitu Remediation Services Ltd.
- EOS Remediation, LLC
Our Clients


View Our Licence Options
