
Bio Based Platform Chemicals Market By Type (Sugar, Syngas, Biogas, Oil, Algae), By Source (Pentose Sugar, Xylose, Arabinose), By End-Use (Polymers, Plastic Formulation, Bio Fuel, Cosmetics, Paint & Coatings, Solvent, Pharmaceuticals, Other End-Uses), By Region And Companies - Industry Segment Outlook, Market Assessment, Competition Scenario, Trends, And Forecast 2023-2032
-
13037
-
July 2023
-
170
-


-
This report was compiled by Shreyas Rokade Shreyas Rokade is a seasoned Research Analyst with CMFE, bringing extensive expertise in market research and consulting, with a strong background in Chemical Engineering. Correspondence Team Lead-CMFE Linkedin | Detailed Market research Methodology Our methodology involves a mix of primary research, including interviews with leading mental health experts, and secondary research from reputable medical journals and databases. View Detailed Methodology Page
-
Quick Navigation
Report Overview
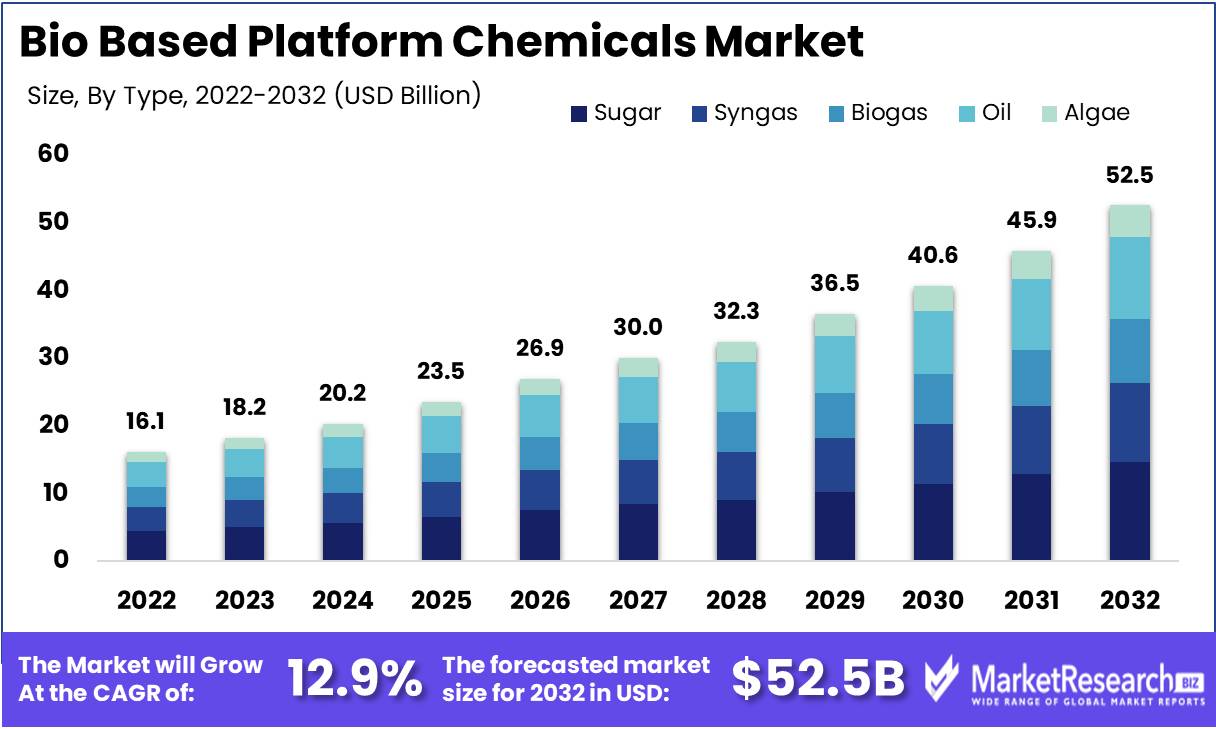
Bio Based Platform Chemicals Market size is expected to be worth around USD 52.5 Bn by 2032 from USD 16.1 Bn in 2022, growing at a CAGR of 12.9% during the forecast period from 2023 to 2032.
In recent years, there has been a surge in interest in the bio-based platform chemicals market, capturing the focus of both industry experts and researchers. These chemicals, which are derived from renewable resources such as biomass, play a crucial role in the production of a vast array of chemicals and materials.
Defining bio-based platform chemicals as remarkably versatile chemical intermediates derived from an abundance of biomass feedstocks, such as sugar, starch, and lignocellulose, merely scratches the surface of their complexity. These chemical miracles serve as the foundation for the synthesis of a vast array of materials and products, exemplifying the primary objective of the bio-based platform chemicals market, which is to displace petroleum-based alternatives with renewable alternatives.
It is a herculean undertaking to establish the significance of the bio-based platform chemicals market, as its significance transcends conventional boundaries. By incorporating renewable feedstocks, the production of bio-based platform chemicals becomes a formidable force capable of reducing carbon dioxide emissions, fostering sustainable development, and mitigating the chemical industry's environmental impact. Bio-based platform chemicals have numerous advantages over their petrochemical counterparts, including reduced toxicity, increased eco-efficiency, enhanced biodegradability, and seamless integration into existing infrastructure frameworks and production processes.
As the landscape of the bio-based platform chemicals market evolves, enticing innovations emerge, beguiling industry stakeholders with their limitless potential. Researchers and businesses, driven by an unwavering dedication to progress, have pioneered cutting-edge technologies that facilitate the metamorphosis of biomass into priceless platform chemicals. In addition, the pursuit of sustainable feedstocks while avoiding overlap with food production has emerged as a central theme, with lignocellulosic biomass playing a prominent role in this narrative.
Nonetheless, as the bio-based platform chemicals market assumes center stage, it unwittingly unfurls an intricate tapestry of ethical dilemmas. The production and use of these remarkable chemicals in a responsible manner is the linchpin of their sustainability promise. Transparency, explicability, and accountability must permeate every aspect of the value chain, serving as unwavering defenders of integrity. To this end, companies must assume responsibility by ensuring the traceability of feedstocks, orchestrating a symphony of measures intended at minimizing environmental repercussions, and protecting the rights of workers who navigate this complex domain.
Driving Factors
Increasing Awareness of Climate Change and Environmental Impact
Individuals, businesses, and governments have taken action in response to growing concerns about climate change and its devastating consequences. This increased awareness has increased the demand for environmentally friendly practices and products, including substances. Conventional chemical manufacturing processes frequently rely on fossil fuels and produce significant greenhouse gas emissions. As they are derived from renewable resources such as biomass, agricultural waste, and organic materials, bio-based platform chemicals offer a more environmentally favorable alternative.
Advancements in Biotechnology and Feedstock
The continuous development of bio-based technology and the availability of feedstock are two other key factors propelling the market for bio-based platform chemicals. Breakthroughs in technology have facilitated the development of more efficient and cost-effective bio-based chemical production processes. Not only have these developments increased the overall competitiveness of bio-based compounds, but they have also broadened the options available to industries seeking sustainable alternatives.
The expansion of government regulations and incentives
Government regulations and incentives play a crucial role in shaping the bio-based platform chemicals market's trajectory. As global environmental concerns intensify, governments around the world have enacted stringent regulations to encourage the adoption of sustainable practices and the use of bio-based alternatives. These regulations create favorable market conditions for bio-based chemicals relative to their conventional counterparts, thereby increasing demand.
Increasing Adoption of Bio-Based Products by Industries
Diverse industries are beginning to recognize the benefits of implementing bio-based platform chemicals. The versatility and compatibility of these chemicals with existing processes and applications make them a viable option for manufacturers seeking environmentally friendly substitutes. Bio-based platform chemicals are used in a variety of consumer goods, such as cosmetics, detergents, plastics, and textiles, which has prompted these industries to implement them.
Restraining Factors
Cost Competitiveness Compared to Conventional Petrochemicals
When compared to conventional petrochemicals, cost competitiveness is a significant challenge for the bio-based platform chemicals market. In spite of the expanding demand for sustainable and renewable alternatives, the production processes and feedstock sourcing for bio-based chemicals are frequently more expensive than those for petrochemicals. Various factors, including the need for specialized equipment, additional purification stages, and limited economies of scale, contribute to this price difference. However, technological advancements, the development of efficient production processes, and increased adoption of bio-based platform chemicals can overcome these cost barriers.
Limited Scalability of Bio-based Production Processes
The limited scalability of production processes is an additional major factor restraining the bio-based platform chemicals market. Currently, numerous bio-based platform chemicals are produced on a limited scale, primarily in research and pilot facilities. Due to the complexity of maintaining product consistency, assuring cost-effective supply chains, and managing quality control, it can be difficult to scale up these production processes to meet commercial demands. Investing in innovation, process optimization, and partnerships with stakeholders across the value chain can assist in overcoming these limitations and driving market expansion.
Potential Technical and Performance Limitations
In comparison to their conventional counterparts, bio-based platform compounds may exhibit technical and performance limitations. This largely relates to the molecular structure, properties, and functional characteristics of bio-based compounds. The attainment of comparable performance characteristics, compatibility with existing processes, and compliance with industry standards and regulations are essential factors that must be addressed. Collaboration between researchers, industry participants, and regulatory bodies can facilitate the development of bio-based compounds with enhanced technical and performance characteristics, thereby enhancing their market competitiveness.
Potential Compatibility and Integration Challenges with Existing Infrastructure
Compatibility and integration of bio-based platform compounds with existing infrastructure present substantial difficulties. The petrochemical industry has an infrastructure that facilitates the production, transport, and storage of conventional chemicals. Integration of bio-based chemicals into this infrastructure necessitates cautious planning, investment, and coordination between multiple stakeholders. These obstacles can be overcome and the adoption of bio-based platform chemicals accelerated by addressing compatibility issues, leveraging existing distribution networks, and developing flexible supply chain models.
Type Evaluation
The sugar-based feedstock type tends to dominate the bio-based platform chemicals market, based on current trends and market analysis.
In the production of bio-based platform chemicals, sugar-based feedstocks such as sugarcane, maize, and sugar beet are commonly used. These feedstocks are abundant in carbohydrates, which can be converted through fermentation and other bioprocesses into numerous valuable chemicals. For the production of organic acids such as lactic acid, succinic acid, and citric acid, as well as alcohols such as ethanol and glycerol, sugar-based feedstocks are widely employed.
While other feedstock categories such as syngas, biogas, oil, and algae have their own applications and potential in the bio-based platform chemicals market, sugar-based feedstocks have gained traction due to their accessibility, versatility, and established processing technologies.
It is important to note that market dynamics can change over time as new feedstocks and technologies arise, leading to shifts in the bio-based platform chemicals market's position of dominance. Consequently, it is essential to closely monitor the market for the most recent developments and trends.
End Use Analysis
In recent years, the bio-based platform chemicals market has experienced significant expansion, with the polymer segment emerging as the market leader. This dominance can be attributed to a number of factors, including the growing demand for sustainable and eco-friendly products, the rising awareness of environmental issues, and the rapid industrialization of emergent economies.
Emerging economies' economic growth is a critical factor in the adoption of the polymer segment of the bio-based platform chemicals market. Rapid industrialization and urbanization in countries such as China, India, and Brazil has led to a surge in demand for polymer-based products. The growing middle class in these nations has also contributed to the rise in polymer-based product consumption.
The economic growth in these emerging economies has altered consumer preferences and behavior. Consumers are becoming increasingly aware of their impact on the environment and are actively pursuing sustainable alternatives. This has created favorable market conditions for bio-based platform chemicals, particularly in the polymer segment.
The global emphasis on reducing carbon emissions and combating climate change has prompted governments to implement strict carbon reduction regulations and targets. These regulations have provided incentives for industries to adopt sustainable practices and invest in bio-based substitutes. Consequently, the demand for bio-based polymer-based platform chemicals is anticipated to increase exponentially.
Key Market Segments
By Type
- Sugar
- Syngas
- Biogas
- Oil
- Algae
By Source
- Pentose Sugar
- Xylose
- Arabinose
Product Type
- Pentanediol
- Ethanol
- Furfural
- Hydroxymethylfurfural
- 2,5-Furandicarboxylic Acid
- Glycerol
- Isoprene
- Succinic Acid
- 3-Hydroxypropionic Acid/Aldehyde
- Levulinic Acid
- Lactic Acid
- Sorbitol
- Xylitol
By End-Use
- Polymers
- Plastic Formulation
- Bio Fuel
- Cosmetics
- Paint & Coatings
- Solvent
- Pharmaceuticals
- Othe End-Uses
Growth Opportunity
The integration of Artificial Intelligence (AI) and Machine Learning (ML) in the bio-based platform chemicals
Utilizing the power of AI and ML technologies offers the bio-based platform chemicals market a promising growth opportunity. AI can optimize chemical processes by analyzing vast quantities of data, thereby increasing efficiency and decreasing costs. Enabling the discovery of novel bio-based chemical pathways, machine learning algorithms can help identify new feedstocks and optimize their conversion into valuable compounds. This incorporation of AI and ML into the industry's R&D processes can expedite the development of innovative bio-based platform chemicals, thereby unlocking new market opportunities and enhancing competitiveness.
Expansion in the Healthcare Industry
The healthcare sector is increasingly concerned with sustainability and eco-friendly practices. This represents a significant growth opportunity for the bio-based platform chemicals market. In pharmaceuticals, medical devices, and personal care products, bio-based compounds can serve as greener alternatives to petroleum-derived alternatives. By capitalizing on the unique properties and applications of bio-based compounds, the industry can create sustainable solutions that meet the rising demand for environmentally conscious healthcare products. Collaborations between manufacturers of bio-based platform chemicals and healthcare companies can foster innovation, resulting in partnerships that are mutually beneficial and a broader market presence.
Integration with Smart Manufacturing and Industry 4.0
The incorporation of bio-based platform chemicals into smart manufacturing and Industry 4.0 has the potential to transform the industry. By incorporating bio-based chemicals into the digitalization of manufacturing processes, businesses can improve their sustainability initiatives, reduce their environmental impact, and increase their operational efficacy. Utilizing the Internet of Things (IoT), robotics, and advanced data analytics, manufacturing processes can be optimized to reduce waste, energy consumption, and raw material consumption. This integration enables producers of bio-based platform chemicals to develop efficient, sustainable, and cost-effective solutions, positioning them as key actors in the transition to a circular economy.
Latest Trends
Bio-Based Ethanol and Biobutanol Expansion
Bioethanol and biobutanol, which are derived from renewable feedstocks such as sugarcane and corn, are undergoing rapid expansion and pervasive adoption across numerous industries. Due to their potential as pure and sustainable alternatives to conventional fossil fuel-based chemicals, these bio-based platform chemicals have garnered significant attention. With advances in fermentation processes and biotechnology, bioethanol and biobutanol production have become more efficient, economical, and environmentally benign.
Utilization of Renewable Sourced Materials
The use of renewable feedstocks in the production of bio-based platform chemicals has been prompted by the rising demand for sustainable and eco-friendly solutions. Sugarcane, maize, and even algae are being utilized to produce a vast array of bio-based chemicals that serve as building blocks for numerous industrial sectors. The use of these renewable feedstocks not only reduces reliance on scarce resources but also contributes to the reduction of greenhouse gas emissions, thereby mitigating the effects of climate change.
Bio-Based Intermediates Demand
Bio-based intermediates are in high demand on the market due to the increasing emphasis on sustainable materials and plastics. Bio-based intermediates are essential components in the production of eco-friendly polymers, resins, and other materials. As consumers become more aware of how their decisions affect the environment, the demand for bio-based intermediates is anticipated to increase. This trend offers companies in the market for bio-based platform chemicals enormous opportunities to innovate and advance sustainable solutions.
Utilization of Biotechnology and Fermentation
Utilizing biotechnology and fermentation techniques has revolutionized the production of bio-based platform chemicals. Using microorganisms and enzymes, these processes facilitate the conversion of renewable feedstocks into valuable chemicals. Biotechnology enables precise control over the production process, resulting in increased yields, enhanced integrity, and decreased energy usage. Consequently, bio-based platform chemicals produced via biotechnology and fermentation offer improved performance, reduced environmental impact, and distinct competitive advantages.
Regional Analysis
In the ever-changing chemical industry, the bio-based platform chemicals market has emerged as a game-changer, providing environmentally friendly alternatives to conventional petroleum-based chemicals. North America stands tall among the main players in this market, asserting its dominance and revolutionizing the industry.
Often referred to as renewable chemicals, bio-based platform chemicals are derived from biomass sources such as vegetation, algae, and waste materials. These chemicals are the building elements for a wide range of products, including plastics, resins, solvents, and fuels. Several factors, including the need to reduce greenhouse gas emissions, reduce reliance on fossil fuels, and embrace a greener and more sustainable future, motivate the transition toward bio-based platform chemicals.
Regarding market share, North America maintains a prominent position. The region has become the center for bio-based platform chemical production due to its advanced infrastructure, technological advancements, and supportive regulatory framework. Several companies in the United States have actively invested in research and development to expand their product lines.
Numerous factors contribute to North America's dominance in the bio-based platform chemicals market. First, the region's abundance of biomass sources provides a sustainable feedstock for chemical manufacturing. Together with technological advances in biomass conversion processes, this assures a steady supply of bio-based platform chemicals.
In addition, government policies and incentives have played a crucial role in fostering the expansion of the bio-based platform chemicals market in North America. Tax credits, grants, and subsidies encourage businesses to invest in research and development, thereby fostering innovation and advancing the industry.
Key Regions and Countries
North America
- US
- Canada
- Mexico
Western Europe
- Germany
- France
- The UK
- Spain
- Italy
- Portugal
- Ireland
- Austria
- Switzerland
- Benelux
- Nordic
- Rest of Western Europe
Eastern Europe
- Russia
- Poland
- The Czech Republic
- Greece
- Rest of Eastern Europe
APAC
- China
- Japan
- South Korea
- India
- Australia & New Zealand
- Indonesia
- Malaysia
- Philippines
- Singapore
- Thailand
- Vietnam
- Rest of APAC
Latin America
- Brazil
- Colombia
- Chile
- Argentina
- Costa Rica
- Rest of Latin America
Middle East & Africa
- Algeria
- Egypt
- Israel
- Kuwait
- Nigeria
- Saudi Arabia
- South Africa
- Turkey
- United Arab Emirates
- Rest of MEA
Key Players Analysis
Various industries, including pharmaceuticals, plastics, and personal care products, rely heavily on bio-based platform chemicals to advance their sustainability initiatives. These compounds are derived from renewable resources, such as biomass, and offer numerous environmental advantages over their fossil-based alternatives. With key participants dominating the industry, the bio-based platform chemicals market is expanding rapidly. Companies such as BASF SE, DowDuPont Inc., Royal DSM N.V., Braskem SA, Evonik Industries AG, and Genomatica, Inc. drive innovation and sustainability in this market.
The German-based BASF SE is a global champion in the chemical industry. They have been actively involved in the development and production of sustainable bio-based platform compounds. The company has made substantial investments in R&D to expand its portfolio of bio-based products. BASF SE offers an extensive selection of bio-based platform chemicals, such as succinic acid, 1,4-butanediol, and levulinic acid. Their commitment to sustainability and innovation has positioned them as a leading market player.
DowDuPont Inc. is a multinational conglomerate that operates in multiple industries, such as agriculture, materials science, and specialty products. DuPont Industrial Biosciences, a subsidiary of the company, has made significant advances in the production of bio-based platform chemicals. The company concentrates on developing sustainable chemicals using renewable feedstocks and advanced biotechnology. DowDuPont's portfolio of bio-based platform chemicals includes 3-hydroxy propionic acid and furan dicarboxylic acid. Their expertise in the field and extensive spectrum of applications make them a market leader.
The Netherlands-based Royal DSM N.V. is a global science-based company specializing in nutrition, health, and sustainable living solutions. They have been actively involved in the production of bio-based platform compounds, with an emphasis on leveraging the power of biotechnology. Bio-succinic acid, bio-based resins, and bio-based intermediates are just some of the bio-based compounds offered by Royal DSM. Their commitment to sustainability and collaboration has helped them establish a solid market position.
The main producer of thermoplastic resins in the Americas is Braskem SA of Brazil. Utilizing their knowledge of renewable feedstocks and biotechnology, they have been at the vanguard of bio-based platform chemical production. Braskem provides an extensive selection of bio-based compounds, such as bio-based polyethylene and bio-based polypropylene. Their emphasis on sustainable solutions and circular economy principles has made them a market leader.
Genomatica, Inc. is a biotechnology company based in the United States that concentrates on the production of environmentally friendly chemicals products. Utilizing cutting-edge biotechnology and metabolic engineering, they produce bio-based platform compounds. Genomatica provides a variety of bio-based compounds, such as bio-based butanediol, bio-based 1,4-butanediol, and bio-based nylon intermediates. Their commitment to innovation and sustainability has helped them establish a strong market presence.
Top Key Players in Bio-Based Platform Chemicals Market
- Lyondell Basell Industries Holdings BV (Netherlands)
- BASF SE (Germany)
- Thermo Fisher Scientific (U.S.)
- Ultimate Chem India Pvt. Ltd (India)
- Alpha Chemika (India)
- Haihang Industry (china)
- Ronas Chemicals (China)
- Merck KGaA (Germany)
- Alfa Aesar (U.S.)
- FUSO CHEMICAL CO.LTD. (China)
- FUJIFILM Wako Pure Chemical Corporation (Japan)
- Dupont (U.S.)
- Braskem (Brazil)
- KURARAY CO.LTD. (Japan)
- DAIKIN (Japan)
- Cargill Incorporated (U.S.)
- IP Group plc (U.K.)
- Novozymes (Denmark)
- Yield10 Bioscience Inc (U.S.)
Recent Development
- In 2023, Braskem, a renowned petrochemical company, made a groundbreaking announcement regarding its intentions to build a cutting-edge biorefinery in Brazil. The purpose of this facility is to produce a variety of bio-based platform chemicals. By adopting sustainable practices, Braskem is reaffirming its commitment to reducing carbon emissions and advocating for a greener industry future.
- In 2022, The rising demand for bio-based platform chemicals, DuPont, a leading chemical company, has announced plans to expand its production capacity in the United States. This action is intended to position DuPont as a leader in the sustainable chemical industry. By investing in sophisticated manufacturing capabilities, the company intends to serve a growing clientele interested in eco-friendly alternatives across a variety of industries.
- In 2021, Total, a well-known oil and gas company, demonstrated its commitment to sustainability by announcing its investment in a new biorefinery in France. This cutting-edge facility is destined to become a production hub for bio-based platform chemicals. Total's decision to invest in renewable energy solutions is consistent with its long-term environmental objectives and paves the way for a more sustainable future.
- In 2020, Shell, a globally renowned oil and gas company, announced its partnership with LanzaTech, a waste gas conversion specialist. Shell intends to utilize LanzaTech's expertise in converting waste gases into valuable bio-based platform chemicals through this collaboration. This innovative approach demonstrates Shell's dedication to promoting circular economies and reducing the carbon footprint associated with conventional chemical production.
Report Scope
Report Features Description Market Value (2022) USD 16.1 Bn Forecast Revenue (2032) USD 52.5 Bn CAGR (2023-2032) 12.9% Base Year for Estimation 2022 Historic Period 2016-2022 Forecast Period 2023-2032 Report Coverage Revenue Forecast, Market Dynamics, COVID-19 Impact, Competitive Landscape, Recent Developments Segments Covered By Type (Sugar, Syngas, Biogas, Oil, Algae)
By Source (Pentose Sugar, Xylose, Arabinose)
Product Type (Pentanediol, Ethanol, Furfural, Hydroxymethylfurfural, 2,5-Furandicarboxylic Acid, Glycerol, Isoprene, Succinic Acid, 3-Hydroxypropionic Acid/Aldehyde, Levulinic Acid, Lactic Acid, Sorbitol, Xylitol)
By End-Use (Polymers, Plastic Formulation, Bio Fuel, Cosmetics, Paint & Coatings, Solvent, Pharmaceuticals, Othe End-Uses)Regional Analysis North America – The US, Canada, & Mexico; Western Europe – Germany, France, The UK, Spain, Italy, Portugal, Ireland, Austria, Switzerland, Benelux, Nordic, & Rest of Western Europe; Eastern Europe – Russia, Poland, The Czech Republic, Greece, & Rest of Eastern Europe; APAC – China, Japan, South Korea, India, Australia & New Zealand, Indonesia, Malaysia, Philippines, Singapore, Thailand, Vietnam, & Rest of APAC; Latin America – Brazil, Colombia, Chile, Argentina, Costa Rica, & Rest of Latin America; Middle East & Africa – Algeria, Egypt, Israel, Kuwait, Nigeria, Saudi Arabia, South Africa, Turkey, United Arab Emirates, & Rest of MEA Competitive Landscape Lyondell Basell Industries Holdings BV (Netherlands), BASF SE (Germany), Thermo Fisher Scientific (U.S.), Ultimate Chem India Pvt. Ltd (India), Alpha Chemika, (India), Haihang Industry (china), Ronas Chemicals (China), Merck KGaA (Germany), Alfa Aesar (U.S.), FUSO CHEMICAL CO., LTD. (China), FUJIFILM Wako Pure Chemical Corporation (Japan), Dupont (U.S.), Braskem (Brazil), KURARAY CO., LTD. (Japan), DAIKIN (Japan), Cargill Incorporated (U.S.), IP Group plc (U.K.), Novozymes (Denmark), Yield10 Bioscience Inc (U.S.) Customization Scope Customization for segments, region/country-level will be provided. Moreover, additional customization can be done based on the requirements. Purchase Options We have three licenses to opt for Single User License, Multi-User License (Up to 5 Users), Corporate Use License (Unlimited User and Printable PDF) -
- 1. Executive Summary
- 1.1. Definition
- 1.2. Taxonomy
- 1.3. Research Scope
- 1.4. Key Analysis
- 1.5. Key Findings by Major Segments
- 1.6. Top strategies by Major Players
- 2. Global Bio Based Platform Chemicals Market Overview
- 2.1. Bio Based Platform Chemicals Market Dynamics
- 2.1.1. Drivers
- 2.1.2. Opportunities
- 2.1.3. Restraints
- 2.1.4. Challenges
- 2.2. Macro-economic Factors
- 2.3. Regulatory Framework
- 2.4. Market Investment Feasibility Index
- 2.5. PEST Analysis
- 2.6. PORTER’S Five Force Analysis
- 2.7. Drivers & Restraints Impact Analysis
- 2.8. Industry Chain Analysis
- 2.9. Cost Structure Analysis
- 2.10. Marketing Strategy
- 2.11. Russia-Ukraine War Impact Analysis
- 2.12. Opportunity Map Analysis
- 2.13. Market Competition Scenario Analysis
- 2.14. Product Life Cycle Analysis
- 2.15. Opportunity Orbits
- 2.16. Manufacturer Intensity Map
- 2.17. Major Companies sales by Value & Volume
- 2.1. Bio Based Platform Chemicals Market Dynamics
- 3. Global Bio Based Platform Chemicals Market Analysis, Opportunity and Forecast, 2016-2032
- 3.1. Global Bio Based Platform Chemicals Market Analysis, 2016-2021
- 3.2. Global Bio Based Platform Chemicals Market Opportunity and Forecast, 2023-2032
- 3.3. Global Bio Based Platform Chemicals Market Analysis, Opportunity and Forecast, By By Type, 2016-2032
- 3.3.1. Global Bio Based Platform Chemicals Market Analysis By Type: Introduction
- 3.3.2. Market Size Absolute $ Opportunity Analysis and Forecast, By By Type, 2016-2032
- 3.3.3. Sugar
- 3.3.4. Syngas
- 3.3.5. Biogas
- 3.3.6. Oil
- 3.3.7. Algae
- 3.4. Global Bio Based Platform Chemicals Market Analysis, Opportunity and Forecast, By By Source, 2016-2032
- 3.4.1. Global Bio Based Platform Chemicals Market Analysis By Source: Introduction
- 3.4.2. Market Size Absolute $ Opportunity Analysis and Forecast, By By Source, 2016-2032
- 3.4.3. Pentose Sugar
- 3.4.4. Xylose
- 3.4.5. Arabinose
- 3.5. Global Bio Based Platform Chemicals Market Analysis, Opportunity and Forecast, By By Product Type, 2016-2032
- 3.5.1. Global Bio Based Platform Chemicals Market Analysis By Product Type: Introduction
- 3.5.2. Market Size Absolute $ Opportunity Analysis and Forecast, By By Product Type, 2016-2032
- 3.5.3. Pentanediol
- 3.5.4. Ethanol
- 3.5.5. Furfural
- 3.5.6. Hydroxymethylfurfural
- 3.5.7. 2,5-Furandicarboxylic Acid
- 3.5.8. Glycerol
- 3.5.9. Isoprene
- 3.5.10. Succinic Acid
- 3.5.11. 3-Hydroxypropionic Acid/Aldehyde
- 3.5.12. Levulinic Acid
- 3.5.13. Lactic Acid
- 3.5.14. Sorbitol
- 3.6. Global Bio Based Platform Chemicals Market Analysis, Opportunity and Forecast, By By End-Use, 2016-2032
- 3.6.1. Global Bio Based Platform Chemicals Market Analysis By End-Use: Introduction
- 3.6.2. Market Size Absolute $ Opportunity Analysis and Forecast, By By End-Use, 2016-2032
- 3.6.3. Polymers
- 3.6.4. Plastic Formulation
- 3.6.5. Bio Fuel
- 3.6.6. Cosmetics
- 3.6.7. Paint & Coatings
- 3.6.8. Solvent
- 3.6.9. Pharmaceuticals
- 4. North America Bio Based Platform Chemicals Market Analysis, Opportunity and Forecast, 2016-2032
- 4.1. North America Bio Based Platform Chemicals Market Analysis, 2016-2021
- 4.2. North America Bio Based Platform Chemicals Market Opportunity and Forecast, 2023-2032
- 4.3. North America Bio Based Platform Chemicals Market Analysis, Opportunity and Forecast, By By Type, 2016-2032
- 4.3.1. North America Bio Based Platform Chemicals Market Analysis By Type: Introduction
- 4.3.2. Market Size Absolute $ Opportunity Analysis and Forecast, By By Type, 2016-2032
- 4.3.3. Sugar
- 4.3.4. Syngas
- 4.3.5. Biogas
- 4.3.6. Oil
- 4.3.7. Algae
- 4.4. North America Bio Based Platform Chemicals Market Analysis, Opportunity and Forecast, By By Source, 2016-2032
- 4.4.1. North America Bio Based Platform Chemicals Market Analysis By Source: Introduction
- 4.4.2. Market Size Absolute $ Opportunity Analysis and Forecast, By By Source, 2016-2032
- 4.4.3. Pentose Sugar
- 4.4.4. Xylose
- 4.4.5. Arabinose
- 4.5. North America Bio Based Platform Chemicals Market Analysis, Opportunity and Forecast, By By Product Type, 2016-2032
- 4.5.1. North America Bio Based Platform Chemicals Market Analysis By Product Type: Introduction
- 4.5.2. Market Size Absolute $ Opportunity Analysis and Forecast, By By Product Type, 2016-2032
- 4.5.3. Pentanediol
- 4.5.4. Ethanol
- 4.5.5. Furfural
- 4.5.6. Hydroxymethylfurfural
- 4.5.7. 2,5-Furandicarboxylic Acid
- 4.5.8. Glycerol
- 4.5.9. Isoprene
- 4.5.10. Succinic Acid
- 4.5.11. 3-Hydroxypropionic Acid/Aldehyde
- 4.5.12. Levulinic Acid
- 4.5.13. Lactic Acid
- 4.5.14. Sorbitol
- 4.6. North America Bio Based Platform Chemicals Market Analysis, Opportunity and Forecast, By By End-Use, 2016-2032
- 4.6.1. North America Bio Based Platform Chemicals Market Analysis By End-Use: Introduction
- 4.6.2. Market Size Absolute $ Opportunity Analysis and Forecast, By By End-Use, 2016-2032
- 4.6.3. Polymers
- 4.6.4. Plastic Formulation
- 4.6.5. Bio Fuel
- 4.6.6. Cosmetics
- 4.6.7. Paint & Coatings
- 4.6.8. Solvent
- 4.6.9. Pharmaceuticals
- 4.7. North America Bio Based Platform Chemicals Market Analysis, Opportunity and Forecast, By Country, 2016-2032
- 4.7.1. North America Bio Based Platform Chemicals Market Analysis by Country : Introduction
- 4.7.2. Market Size Absolute $ Opportunity Analysis and Forecast, Country, 2016-2032
- 4.7.2.1. The US
- 4.7.2.2. Canada
- 4.7.2.3. Mexico
- 5. Western Europe Bio Based Platform Chemicals Market Analysis, Opportunity and Forecast, 2016-2032
- 5.1. Western Europe Bio Based Platform Chemicals Market Analysis, 2016-2021
- 5.2. Western Europe Bio Based Platform Chemicals Market Opportunity and Forecast, 2023-2032
- 5.3. Western Europe Bio Based Platform Chemicals Market Analysis, Opportunity and Forecast, By By Type, 2016-2032
- 5.3.1. Western Europe Bio Based Platform Chemicals Market Analysis By Type: Introduction
- 5.3.2. Market Size Absolute $ Opportunity Analysis and Forecast, By By Type, 2016-2032
- 5.3.3. Sugar
- 5.3.4. Syngas
- 5.3.5. Biogas
- 5.3.6. Oil
- 5.3.7. Algae
- 5.4. Western Europe Bio Based Platform Chemicals Market Analysis, Opportunity and Forecast, By By Source, 2016-2032
- 5.4.1. Western Europe Bio Based Platform Chemicals Market Analysis By Source: Introduction
- 5.4.2. Market Size Absolute $ Opportunity Analysis and Forecast, By By Source, 2016-2032
- 5.4.3. Pentose Sugar
- 5.4.4. Xylose
- 5.4.5. Arabinose
- 5.5. Western Europe Bio Based Platform Chemicals Market Analysis, Opportunity and Forecast, By By Product Type, 2016-2032
- 5.5.1. Western Europe Bio Based Platform Chemicals Market Analysis By Product Type: Introduction
- 5.5.2. Market Size Absolute $ Opportunity Analysis and Forecast, By By Product Type, 2016-2032
- 5.5.3. Pentanediol
- 5.5.4. Ethanol
- 5.5.5. Furfural
- 5.5.6. Hydroxymethylfurfural
- 5.5.7. 2,5-Furandicarboxylic Acid
- 5.5.8. Glycerol
- 5.5.9. Isoprene
- 5.5.10. Succinic Acid
- 5.5.11. 3-Hydroxypropionic Acid/Aldehyde
- 5.5.12. Levulinic Acid
- 5.5.13. Lactic Acid
- 5.5.14. Sorbitol
- 5.6. Western Europe Bio Based Platform Chemicals Market Analysis, Opportunity and Forecast, By By End-Use, 2016-2032
- 5.6.1. Western Europe Bio Based Platform Chemicals Market Analysis By End-Use: Introduction
- 5.6.2. Market Size Absolute $ Opportunity Analysis and Forecast, By By End-Use, 2016-2032
- 5.6.3. Polymers
- 5.6.4. Plastic Formulation
- 5.6.5. Bio Fuel
- 5.6.6. Cosmetics
- 5.6.7. Paint & Coatings
- 5.6.8. Solvent
- 5.6.9. Pharmaceuticals
- 5.7. Western Europe Bio Based Platform Chemicals Market Analysis, Opportunity and Forecast, By Country, 2016-2032
- 5.7.1. Western Europe Bio Based Platform Chemicals Market Analysis by Country : Introduction
- 5.7.2. Market Size Absolute $ Opportunity Analysis and Forecast, Country, 2016-2032
- 5.7.2.1. Germany
- 5.7.2.2. France
- 5.7.2.3. The UK
- 5.7.2.4. Spain
- 5.7.2.5. Italy
- 5.7.2.6. Portugal
- 5.7.2.7. Ireland
- 5.7.2.8. Austria
- 5.7.2.9. Switzerland
- 5.7.2.10. Benelux
- 5.7.2.11. Nordic
- 5.7.2.12. Rest of Western Europe
- 6. Eastern Europe Bio Based Platform Chemicals Market Analysis, Opportunity and Forecast, 2016-2032
- 6.1. Eastern Europe Bio Based Platform Chemicals Market Analysis, 2016-2021
- 6.2. Eastern Europe Bio Based Platform Chemicals Market Opportunity and Forecast, 2023-2032
- 6.3. Eastern Europe Bio Based Platform Chemicals Market Analysis, Opportunity and Forecast, By By Type, 2016-2032
- 6.3.1. Eastern Europe Bio Based Platform Chemicals Market Analysis By Type: Introduction
- 6.3.2. Market Size Absolute $ Opportunity Analysis and Forecast, By By Type, 2016-2032
- 6.3.3. Sugar
- 6.3.4. Syngas
- 6.3.5. Biogas
- 6.3.6. Oil
- 6.3.7. Algae
- 6.4. Eastern Europe Bio Based Platform Chemicals Market Analysis, Opportunity and Forecast, By By Source, 2016-2032
- 6.4.1. Eastern Europe Bio Based Platform Chemicals Market Analysis By Source: Introduction
- 6.4.2. Market Size Absolute $ Opportunity Analysis and Forecast, By By Source, 2016-2032
- 6.4.3. Pentose Sugar
- 6.4.4. Xylose
- 6.4.5. Arabinose
- 6.5. Eastern Europe Bio Based Platform Chemicals Market Analysis, Opportunity and Forecast, By By Product Type, 2016-2032
- 6.5.1. Eastern Europe Bio Based Platform Chemicals Market Analysis By Product Type: Introduction
- 6.5.2. Market Size Absolute $ Opportunity Analysis and Forecast, By By Product Type, 2016-2032
- 6.5.3. Pentanediol
- 6.5.4. Ethanol
- 6.5.5. Furfural
- 6.5.6. Hydroxymethylfurfural
- 6.5.7. 2,5-Furandicarboxylic Acid
- 6.5.8. Glycerol
- 6.5.9. Isoprene
- 6.5.10. Succinic Acid
- 6.5.11. 3-Hydroxypropionic Acid/Aldehyde
- 6.5.12. Levulinic Acid
- 6.5.13. Lactic Acid
- 6.5.14. Sorbitol
- 6.6. Eastern Europe Bio Based Platform Chemicals Market Analysis, Opportunity and Forecast, By By End-Use, 2016-2032
- 6.6.1. Eastern Europe Bio Based Platform Chemicals Market Analysis By End-Use: Introduction
- 6.6.2. Market Size Absolute $ Opportunity Analysis and Forecast, By By End-Use, 2016-2032
- 6.6.3. Polymers
- 6.6.4. Plastic Formulation
- 6.6.5. Bio Fuel
- 6.6.6. Cosmetics
- 6.6.7. Paint & Coatings
- 6.6.8. Solvent
- 6.6.9. Pharmaceuticals
- 6.7. Eastern Europe Bio Based Platform Chemicals Market Analysis, Opportunity and Forecast, By Country, 2016-2032
- 6.7.1. Eastern Europe Bio Based Platform Chemicals Market Analysis by Country : Introduction
- 6.7.2. Market Size Absolute $ Opportunity Analysis and Forecast, Country, 2016-2032
- 6.7.2.1. Russia
- 6.7.2.2. Poland
- 6.7.2.3. The Czech Republic
- 6.7.2.4. Greece
- 6.7.2.5. Rest of Eastern Europe
- 7. APAC Bio Based Platform Chemicals Market Analysis, Opportunity and Forecast, 2016-2032
- 7.1. APAC Bio Based Platform Chemicals Market Analysis, 2016-2021
- 7.2. APAC Bio Based Platform Chemicals Market Opportunity and Forecast, 2023-2032
- 7.3. APAC Bio Based Platform Chemicals Market Analysis, Opportunity and Forecast, By By Type, 2016-2032
- 7.3.1. APAC Bio Based Platform Chemicals Market Analysis By Type: Introduction
- 7.3.2. Market Size Absolute $ Opportunity Analysis and Forecast, By By Type, 2016-2032
- 7.3.3. Sugar
- 7.3.4. Syngas
- 7.3.5. Biogas
- 7.3.6. Oil
- 7.3.7. Algae
- 7.4. APAC Bio Based Platform Chemicals Market Analysis, Opportunity and Forecast, By By Source, 2016-2032
- 7.4.1. APAC Bio Based Platform Chemicals Market Analysis By Source: Introduction
- 7.4.2. Market Size Absolute $ Opportunity Analysis and Forecast, By By Source, 2016-2032
- 7.4.3. Pentose Sugar
- 7.4.4. Xylose
- 7.4.5. Arabinose
- 7.5. APAC Bio Based Platform Chemicals Market Analysis, Opportunity and Forecast, By By Product Type, 2016-2032
- 7.5.1. APAC Bio Based Platform Chemicals Market Analysis By Product Type: Introduction
- 7.5.2. Market Size Absolute $ Opportunity Analysis and Forecast, By By Product Type, 2016-2032
- 7.5.3. Pentanediol
- 7.5.4. Ethanol
- 7.5.5. Furfural
- 7.5.6. Hydroxymethylfurfural
- 7.5.7. 2,5-Furandicarboxylic Acid
- 7.5.8. Glycerol
- 7.5.9. Isoprene
- 7.5.10. Succinic Acid
- 7.5.11. 3-Hydroxypropionic Acid/Aldehyde
- 7.5.12. Levulinic Acid
- 7.5.13. Lactic Acid
- 7.5.14. Sorbitol
- 7.6. APAC Bio Based Platform Chemicals Market Analysis, Opportunity and Forecast, By By End-Use, 2016-2032
- 7.6.1. APAC Bio Based Platform Chemicals Market Analysis By End-Use: Introduction
- 7.6.2. Market Size Absolute $ Opportunity Analysis and Forecast, By By End-Use, 2016-2032
- 7.6.3. Polymers
- 7.6.4. Plastic Formulation
- 7.6.5. Bio Fuel
- 7.6.6. Cosmetics
- 7.6.7. Paint & Coatings
- 7.6.8. Solvent
- 7.6.9. Pharmaceuticals
- 7.7. APAC Bio Based Platform Chemicals Market Analysis, Opportunity and Forecast, By Country, 2016-2032
- 7.7.1. APAC Bio Based Platform Chemicals Market Analysis by Country : Introduction
- 7.7.2. Market Size Absolute $ Opportunity Analysis and Forecast, Country, 2016-2032
- 7.7.2.1. China
- 7.7.2.2. Japan
- 7.7.2.3. South Korea
- 7.7.2.4. India
- 7.7.2.5. Australia & New Zeland
- 7.7.2.6. Indonesia
- 7.7.2.7. Malaysia
- 7.7.2.8. Philippines
- 7.7.2.9. Singapore
- 7.7.2.10. Thailand
- 7.7.2.11. Vietnam
- 7.7.2.12. Rest of APAC
- 8. Latin America Bio Based Platform Chemicals Market Analysis, Opportunity and Forecast, 2016-2032
- 8.1. Latin America Bio Based Platform Chemicals Market Analysis, 2016-2021
- 8.2. Latin America Bio Based Platform Chemicals Market Opportunity and Forecast, 2023-2032
- 8.3. Latin America Bio Based Platform Chemicals Market Analysis, Opportunity and Forecast, By By Type, 2016-2032
- 8.3.1. Latin America Bio Based Platform Chemicals Market Analysis By Type: Introduction
- 8.3.2. Market Size Absolute $ Opportunity Analysis and Forecast, By By Type, 2016-2032
- 8.3.3. Sugar
- 8.3.4. Syngas
- 8.3.5. Biogas
- 8.3.6. Oil
- 8.3.7. Algae
- 8.4. Latin America Bio Based Platform Chemicals Market Analysis, Opportunity and Forecast, By By Source, 2016-2032
- 8.4.1. Latin America Bio Based Platform Chemicals Market Analysis By Source: Introduction
- 8.4.2. Market Size Absolute $ Opportunity Analysis and Forecast, By By Source, 2016-2032
- 8.4.3. Pentose Sugar
- 8.4.4. Xylose
- 8.4.5. Arabinose
- 8.5. Latin America Bio Based Platform Chemicals Market Analysis, Opportunity and Forecast, By By Product Type, 2016-2032
- 8.5.1. Latin America Bio Based Platform Chemicals Market Analysis By Product Type: Introduction
- 8.5.2. Market Size Absolute $ Opportunity Analysis and Forecast, By By Product Type, 2016-2032
- 8.5.3. Pentanediol
- 8.5.4. Ethanol
- 8.5.5. Furfural
- 8.5.6. Hydroxymethylfurfural
- 8.5.7. 2,5-Furandicarboxylic Acid
- 8.5.8. Glycerol
- 8.5.9. Isoprene
- 8.5.10. Succinic Acid
- 8.5.11. 3-Hydroxypropionic Acid/Aldehyde
- 8.5.12. Levulinic Acid
- 8.5.13. Lactic Acid
- 8.5.14. Sorbitol
- 8.6. Latin America Bio Based Platform Chemicals Market Analysis, Opportunity and Forecast, By By End-Use, 2016-2032
- 8.6.1. Latin America Bio Based Platform Chemicals Market Analysis By End-Use: Introduction
- 8.6.2. Market Size Absolute $ Opportunity Analysis and Forecast, By By End-Use, 2016-2032
- 8.6.3. Polymers
- 8.6.4. Plastic Formulation
- 8.6.5. Bio Fuel
- 8.6.6. Cosmetics
- 8.6.7. Paint & Coatings
- 8.6.8. Solvent
- 8.6.9. Pharmaceuticals
- 8.7. Latin America Bio Based Platform Chemicals Market Analysis, Opportunity and Forecast, By Country, 2016-2032
- 8.7.1. Latin America Bio Based Platform Chemicals Market Analysis by Country : Introduction
- 8.7.2. Market Size Absolute $ Opportunity Analysis and Forecast, Country, 2016-2032
- 8.7.2.1. Brazil
- 8.7.2.2. Colombia
- 8.7.2.3. Chile
- 8.7.2.4. Argentina
- 8.7.2.5. Costa Rica
- 8.7.2.6. Rest of Latin America
- 9. Middle East & Africa Bio Based Platform Chemicals Market Analysis, Opportunity and Forecast, 2016-2032
- 9.1. Middle East & Africa Bio Based Platform Chemicals Market Analysis, 2016-2021
- 9.2. Middle East & Africa Bio Based Platform Chemicals Market Opportunity and Forecast, 2023-2032
- 9.3. Middle East & Africa Bio Based Platform Chemicals Market Analysis, Opportunity and Forecast, By By Type, 2016-2032
- 9.3.1. Middle East & Africa Bio Based Platform Chemicals Market Analysis By Type: Introduction
- 9.3.2. Market Size Absolute $ Opportunity Analysis and Forecast, By By Type, 2016-2032
- 9.3.3. Sugar
- 9.3.4. Syngas
- 9.3.5. Biogas
- 9.3.6. Oil
- 9.3.7. Algae
- 9.4. Middle East & Africa Bio Based Platform Chemicals Market Analysis, Opportunity and Forecast, By By Source, 2016-2032
- 9.4.1. Middle East & Africa Bio Based Platform Chemicals Market Analysis By Source: Introduction
- 9.4.2. Market Size Absolute $ Opportunity Analysis and Forecast, By By Source, 2016-2032
- 9.4.3. Pentose Sugar
- 9.4.4. Xylose
- 9.4.5. Arabinose
- 9.5. Middle East & Africa Bio Based Platform Chemicals Market Analysis, Opportunity and Forecast, By By Product Type, 2016-2032
- 9.5.1. Middle East & Africa Bio Based Platform Chemicals Market Analysis By Product Type: Introduction
- 9.5.2. Market Size Absolute $ Opportunity Analysis and Forecast, By By Product Type, 2016-2032
- 9.5.3. Pentanediol
- 9.5.4. Ethanol
- 9.5.5. Furfural
- 9.5.6. Hydroxymethylfurfural
- 9.5.7. 2,5-Furandicarboxylic Acid
- 9.5.8. Glycerol
- 9.5.9. Isoprene
- 9.5.10. Succinic Acid
- 9.5.11. 3-Hydroxypropionic Acid/Aldehyde
- 9.5.12. Levulinic Acid
- 9.5.13. Lactic Acid
- 9.5.14. Sorbitol
- 9.6. Middle East & Africa Bio Based Platform Chemicals Market Analysis, Opportunity and Forecast, By By End-Use, 2016-2032
- 9.6.1. Middle East & Africa Bio Based Platform Chemicals Market Analysis By End-Use: Introduction
- 9.6.2. Market Size Absolute $ Opportunity Analysis and Forecast, By By End-Use, 2016-2032
- 9.6.3. Polymers
- 9.6.4. Plastic Formulation
- 9.6.5. Bio Fuel
- 9.6.6. Cosmetics
- 9.6.7. Paint & Coatings
- 9.6.8. Solvent
- 9.6.9. Pharmaceuticals
- 9.7. Middle East & Africa Bio Based Platform Chemicals Market Analysis, Opportunity and Forecast, By Country, 2016-2032
- 9.7.1. Middle East & Africa Bio Based Platform Chemicals Market Analysis by Country : Introduction
- 9.7.2. Market Size Absolute $ Opportunity Analysis and Forecast, Country, 2016-2032
- 9.7.2.1. Algeria
- 9.7.2.2. Egypt
- 9.7.2.3. Israel
- 9.7.2.4. Kuwait
- 9.7.2.5. Nigeria
- 9.7.2.6. Saudi Arabia
- 9.7.2.7. South Africa
- 9.7.2.8. Turkey
- 9.7.2.9. The UAE
- 9.7.2.10. Rest of MEA
- 10. Global Bio Based Platform Chemicals Market Analysis, Opportunity and Forecast, By Region, 2016-2032
- 10.1. Global Bio Based Platform Chemicals Market Analysis by Region : Introduction
- 10.2. Market Size Absolute $ Opportunity Analysis and Forecast, By Region, 2016-2032
- 10.2.1. North America
- 10.2.2. Western Europe
- 10.2.3. Eastern Europe
- 10.2.4. APAC
- 10.2.5. Latin America
- 10.2.6. Middle East & Africa
- 11. Global Bio Based Platform Chemicals Market Competitive Landscape, Market Share Analysis, and Company Profiles
- 11.1. Market Share Analysis
- 11.2. Company Profiles
- 11.3. Lyondell Basell Industries Holdings BV (Netherlands)
- 11.3.1. Company Overview
- 11.3.2. Financial Highlights
- 11.3.3. Product Portfolio
- 11.3.4. SWOT Analysis
- 11.3.5. Key Strategies and Developments
- 11.4. BASF SE (Germany)
- 11.4.1. Company Overview
- 11.4.2. Financial Highlights
- 11.4.3. Product Portfolio
- 11.4.4. SWOT Analysis
- 11.4.5. Key Strategies and Developments
- 11.5. Thermo Fisher Scientific (U.S.)
- 11.5.1. Company Overview
- 11.5.2. Financial Highlights
- 11.5.3. Product Portfolio
- 11.5.4. SWOT Analysis
- 11.5.5. Key Strategies and Developments
- 11.6. Ultimate Chem India Pvt. Ltd (India)
- 11.6.1. Company Overview
- 11.6.2. Financial Highlights
- 11.6.3. Product Portfolio
- 11.6.4. SWOT Analysis
- 11.6.5. Key Strategies and Developments
- 11.7. Alpha Chemika (India)
- 11.7.1. Company Overview
- 11.7.2. Financial Highlights
- 11.7.3. Product Portfolio
- 11.7.4. SWOT Analysis
- 11.7.5. Key Strategies and Developments
- 11.8. Haihang Industry (china)
- 11.8.1. Company Overview
- 11.8.2. Financial Highlights
- 11.8.3. Product Portfolio
- 11.8.4. SWOT Analysis
- 11.8.5. Key Strategies and Developments
- 11.9. Ronas Chemicals (China)
- 11.9.1. Company Overview
- 11.9.2. Financial Highlights
- 11.9.3. Product Portfolio
- 11.9.4. SWOT Analysis
- 11.9.5. Key Strategies and Developments
- 11.10. Merck KGaA (Germany)
- 11.10.1. Company Overview
- 11.10.2. Financial Highlights
- 11.10.3. Product Portfolio
- 11.10.4. SWOT Analysis
- 11.10.5. Key Strategies and Developments
- 11.11. Alfa Aesar (U.S.)
- 11.11.1. Company Overview
- 11.11.2. Financial Highlights
- 11.11.3. Product Portfolio
- 11.11.4. SWOT Analysis
- 11.11.5. Key Strategies and Developments
- 11.12. FUSO CHEMICAL CO.LTD. (China)
- 11.12.1. Company Overview
- 11.12.2. Financial Highlights
- 11.12.3. Product Portfolio
- 11.12.4. SWOT Analysis
- 11.12.5. Key Strategies and Developments
- 11.13. FUJIFILM Wako Pure Chemical Corporation (Japan)
- 11.13.1. Company Overview
- 11.13.2. Financial Highlights
- 11.13.3. Product Portfolio
- 11.13.4. SWOT Analysis
- 11.13.5. Key Strategies and Developments
- 11.14. Dupont (U.S.)
- 11.14.1. Company Overview
- 11.14.2. Financial Highlights
- 11.14.3. Product Portfolio
- 11.14.4. SWOT Analysis
- 11.14.5. Key Strategies and Developments
- 11.15. Braskem (Brazil)
- 11.15.1. Company Overview
- 11.15.2. Financial Highlights
- 11.15.3. Product Portfolio
- 11.15.4. SWOT Analysis
- 11.15.5. Key Strategies and Developments
- 11.16. KURARAY CO.LTD. (Japan)
- 11.16.1. Company Overview
- 11.16.2. Financial Highlights
- 11.16.3. Product Portfolio
- 11.16.4. SWOT Analysis
- 11.16.5. Key Strategies and Developments
- 11.17. DAIKIN (Japan)
- 11.17.1. Company Overview
- 11.17.2. Financial Highlights
- 11.17.3. Product Portfolio
- 11.17.4. SWOT Analysis
- 11.17.5. Key Strategies and Developments
- 11.18. Cargill Incorporated (U.S.)
- 11.18.1. Company Overview
- 11.18.2. Financial Highlights
- 11.18.3. Product Portfolio
- 11.18.4. SWOT Analysis
- 11.18.5. Key Strategies and Developments
- 11.19. IP Group plc (U.K.)
- 11.19.1. Company Overview
- 11.19.2. Financial Highlights
- 11.19.3. Product Portfolio
- 11.19.4. SWOT Analysis
- 11.19.5. Key Strategies and Developments
- 11.20. Novozymes (Denmark)
- 11.20.1. Company Overview
- 11.20.2. Financial Highlights
- 11.20.3. Product Portfolio
- 11.20.4. SWOT Analysis
- 11.20.5. Key Strategies and Developments
- 11.21. Yield10 Bioscience Inc (U.S.)
- 11.21.1. Company Overview
- 11.21.2. Financial Highlights
- 11.21.3. Product Portfolio
- 11.21.4. SWOT Analysis
- 11.21.5. Key Strategies and Developments
- 12. Assumptions and Acronyms
- 13. Research Methodology
- 14. Contact
List of Figures
- Figure 1: Global Bio Based Platform Chemicals Market Revenue (US$ Mn) Market Share By Type in 2022
- Figure 2: Global Bio Based Platform Chemicals Market Attractiveness Analysis By Type, 2016-2032
- Figure 3: Global Bio Based Platform Chemicals Market Revenue (US$ Mn) Market Share By Sourcein 2022
- Figure 4: Global Bio Based Platform Chemicals Market Attractiveness Analysis By Source, 2016-2032
- Figure 5: Global Bio Based Platform Chemicals Market Revenue (US$ Mn) Market Share By Product Typein 2022
- Figure 6: Global Bio Based Platform Chemicals Market Attractiveness Analysis By Product Type, 2016-2032
- Figure 7: Global Bio Based Platform Chemicals Market Revenue (US$ Mn) Market Share By End-Usein 2022
- Figure 8: Global Bio Based Platform Chemicals Market Attractiveness Analysis By End-Use, 2016-2032
- Figure 9: Global Bio Based Platform Chemicals Market Revenue (US$ Mn) Market Share by Region in 2022
- Figure 10: Global Bio Based Platform Chemicals Market Attractiveness Analysis by Region, 2016-2032
- Figure 11: Global Bio Based Platform Chemicals Market Revenue (US$ Mn) (2016-2032)
- Figure 12: Global Bio Based Platform Chemicals Market Revenue (US$ Mn) Comparison by Region (2016-2032)
- Figure 13: Global Bio Based Platform Chemicals Market Revenue (US$ Mn) Comparison By Type (2016-2032)
- Figure 14: Global Bio Based Platform Chemicals Market Revenue (US$ Mn) Comparison By Source (2016-2032)
- Figure 15: Global Bio Based Platform Chemicals Market Revenue (US$ Mn) Comparison By Product Type (2016-2032)
- Figure 16: Global Bio Based Platform Chemicals Market Revenue (US$ Mn) Comparison By End-Use (2016-2032)
- Figure 17: Global Bio Based Platform Chemicals Market Y-o-Y Growth Rate Comparison by Region (2016-2032)
- Figure 18: Global Bio Based Platform Chemicals Market Y-o-Y Growth Rate Comparison By Type (2016-2032)
- Figure 19: Global Bio Based Platform Chemicals Market Y-o-Y Growth Rate Comparison By Source (2016-2032)
- Figure 20: Global Bio Based Platform Chemicals Market Y-o-Y Growth Rate Comparison By Product Type (2016-2032)
- Figure 21: Global Bio Based Platform Chemicals Market Y-o-Y Growth Rate Comparison By End-Use (2016-2032)
- Figure 22: Global Bio Based Platform Chemicals Market Share Comparison by Region (2016-2032)
- Figure 23: Global Bio Based Platform Chemicals Market Share Comparison By Type (2016-2032)
- Figure 24: Global Bio Based Platform Chemicals Market Share Comparison By Source (2016-2032)
- Figure 25: Global Bio Based Platform Chemicals Market Share Comparison By Product Type (2016-2032)
- Figure 26: Global Bio Based Platform Chemicals Market Share Comparison By End-Use (2016-2032)
- Figure 27: North America Bio Based Platform Chemicals Market Revenue (US$ Mn) Market Share By Typein 2022
- Figure 28: North America Bio Based Platform Chemicals Market Attractiveness Analysis By Type, 2016-2032
- Figure 29: North America Bio Based Platform Chemicals Market Revenue (US$ Mn) Market Share By Sourcein 2022
- Figure 30: North America Bio Based Platform Chemicals Market Attractiveness Analysis By Source, 2016-2032
- Figure 31: North America Bio Based Platform Chemicals Market Revenue (US$ Mn) Market Share By Product Typein 2022
- Figure 32: North America Bio Based Platform Chemicals Market Attractiveness Analysis By Product Type, 2016-2032
- Figure 33: North America Bio Based Platform Chemicals Market Revenue (US$ Mn) Market Share By End-Usein 2022
- Figure 34: North America Bio Based Platform Chemicals Market Attractiveness Analysis By End-Use, 2016-2032
- Figure 35: North America Bio Based Platform Chemicals Market Revenue (US$ Mn) Market Share by Country in 2022
- Figure 36: North America Bio Based Platform Chemicals Market Attractiveness Analysis by Country, 2016-2032
- Figure 37: North America Bio Based Platform Chemicals Market Revenue (US$ Mn) (2016-2032)
- Figure 38: North America Bio Based Platform Chemicals Market Revenue (US$ Mn) Comparison by Country (2016-2032)
- Figure 39: North America Bio Based Platform Chemicals Market Revenue (US$ Mn) Comparison By Type (2016-2032)
- Figure 40: North America Bio Based Platform Chemicals Market Revenue (US$ Mn) Comparison By Source (2016-2032)
- Figure 41: North America Bio Based Platform Chemicals Market Revenue (US$ Mn) Comparison By Product Type (2016-2032)
- Figure 42: North America Bio Based Platform Chemicals Market Revenue (US$ Mn) Comparison By End-Use (2016-2032)
- Figure 43: North America Bio Based Platform Chemicals Market Y-o-Y Growth Rate Comparison by Country (2016-2032)
- Figure 44: North America Bio Based Platform Chemicals Market Y-o-Y Growth Rate Comparison By Type (2016-2032)
- Figure 45: North America Bio Based Platform Chemicals Market Y-o-Y Growth Rate Comparison By Source (2016-2032)
- Figure 46: North America Bio Based Platform Chemicals Market Y-o-Y Growth Rate Comparison By Product Type (2016-2032)
- Figure 47: North America Bio Based Platform Chemicals Market Y-o-Y Growth Rate Comparison By End-Use (2016-2032)
- Figure 48: North America Bio Based Platform Chemicals Market Share Comparison by Country (2016-2032)
- Figure 49: North America Bio Based Platform Chemicals Market Share Comparison By Type (2016-2032)
- Figure 50: North America Bio Based Platform Chemicals Market Share Comparison By Source (2016-2032)
- Figure 51: North America Bio Based Platform Chemicals Market Share Comparison By Product Type (2016-2032)
- Figure 52: North America Bio Based Platform Chemicals Market Share Comparison By End-Use (2016-2032)
- Figure 53: Western Europe Bio Based Platform Chemicals Market Revenue (US$ Mn) Market Share By Typein 2022
- Figure 54: Western Europe Bio Based Platform Chemicals Market Attractiveness Analysis By Type, 2016-2032
- Figure 55: Western Europe Bio Based Platform Chemicals Market Revenue (US$ Mn) Market Share By Sourcein 2022
- Figure 56: Western Europe Bio Based Platform Chemicals Market Attractiveness Analysis By Source, 2016-2032
- Figure 57: Western Europe Bio Based Platform Chemicals Market Revenue (US$ Mn) Market Share By Product Typein 2022
- Figure 58: Western Europe Bio Based Platform Chemicals Market Attractiveness Analysis By Product Type, 2016-2032
- Figure 59: Western Europe Bio Based Platform Chemicals Market Revenue (US$ Mn) Market Share By End-Usein 2022
- Figure 60: Western Europe Bio Based Platform Chemicals Market Attractiveness Analysis By End-Use, 2016-2032
- Figure 61: Western Europe Bio Based Platform Chemicals Market Revenue (US$ Mn) Market Share by Country in 2022
- Figure 62: Western Europe Bio Based Platform Chemicals Market Attractiveness Analysis by Country, 2016-2032
- Figure 63: Western Europe Bio Based Platform Chemicals Market Revenue (US$ Mn) (2016-2032)
- Figure 64: Western Europe Bio Based Platform Chemicals Market Revenue (US$ Mn) Comparison by Country (2016-2032)
- Figure 65: Western Europe Bio Based Platform Chemicals Market Revenue (US$ Mn) Comparison By Type (2016-2032)
- Figure 66: Western Europe Bio Based Platform Chemicals Market Revenue (US$ Mn) Comparison By Source (2016-2032)
- Figure 67: Western Europe Bio Based Platform Chemicals Market Revenue (US$ Mn) Comparison By Product Type (2016-2032)
- Figure 68: Western Europe Bio Based Platform Chemicals Market Revenue (US$ Mn) Comparison By End-Use (2016-2032)
- Figure 69: Western Europe Bio Based Platform Chemicals Market Y-o-Y Growth Rate Comparison by Country (2016-2032)
- Figure 70: Western Europe Bio Based Platform Chemicals Market Y-o-Y Growth Rate Comparison By Type (2016-2032)
- Figure 71: Western Europe Bio Based Platform Chemicals Market Y-o-Y Growth Rate Comparison By Source (2016-2032)
- Figure 72: Western Europe Bio Based Platform Chemicals Market Y-o-Y Growth Rate Comparison By Product Type (2016-2032)
- Figure 73: Western Europe Bio Based Platform Chemicals Market Y-o-Y Growth Rate Comparison By End-Use (2016-2032)
- Figure 74: Western Europe Bio Based Platform Chemicals Market Share Comparison by Country (2016-2032)
- Figure 75: Western Europe Bio Based Platform Chemicals Market Share Comparison By Type (2016-2032)
- Figure 76: Western Europe Bio Based Platform Chemicals Market Share Comparison By Source (2016-2032)
- Figure 77: Western Europe Bio Based Platform Chemicals Market Share Comparison By Product Type (2016-2032)
- Figure 78: Western Europe Bio Based Platform Chemicals Market Share Comparison By End-Use (2016-2032)
- Figure 79: Eastern Europe Bio Based Platform Chemicals Market Revenue (US$ Mn) Market Share By Typein 2022
- Figure 80: Eastern Europe Bio Based Platform Chemicals Market Attractiveness Analysis By Type, 2016-2032
- Figure 81: Eastern Europe Bio Based Platform Chemicals Market Revenue (US$ Mn) Market Share By Sourcein 2022
- Figure 82: Eastern Europe Bio Based Platform Chemicals Market Attractiveness Analysis By Source, 2016-2032
- Figure 83: Eastern Europe Bio Based Platform Chemicals Market Revenue (US$ Mn) Market Share By Product Typein 2022
- Figure 84: Eastern Europe Bio Based Platform Chemicals Market Attractiveness Analysis By Product Type, 2016-2032
- Figure 85: Eastern Europe Bio Based Platform Chemicals Market Revenue (US$ Mn) Market Share By End-Usein 2022
- Figure 86: Eastern Europe Bio Based Platform Chemicals Market Attractiveness Analysis By End-Use, 2016-2032
- Figure 87: Eastern Europe Bio Based Platform Chemicals Market Revenue (US$ Mn) Market Share by Country in 2022
- Figure 88: Eastern Europe Bio Based Platform Chemicals Market Attractiveness Analysis by Country, 2016-2032
- Figure 89: Eastern Europe Bio Based Platform Chemicals Market Revenue (US$ Mn) (2016-2032)
- Figure 90: Eastern Europe Bio Based Platform Chemicals Market Revenue (US$ Mn) Comparison by Country (2016-2032)
- Figure 91: Eastern Europe Bio Based Platform Chemicals Market Revenue (US$ Mn) Comparison By Type (2016-2032)
- Figure 92: Eastern Europe Bio Based Platform Chemicals Market Revenue (US$ Mn) Comparison By Source (2016-2032)
- Figure 93: Eastern Europe Bio Based Platform Chemicals Market Revenue (US$ Mn) Comparison By Product Type (2016-2032)
- Figure 94: Eastern Europe Bio Based Platform Chemicals Market Revenue (US$ Mn) Comparison By End-Use (2016-2032)
- Figure 95: Eastern Europe Bio Based Platform Chemicals Market Y-o-Y Growth Rate Comparison by Country (2016-2032)
- Figure 96: Eastern Europe Bio Based Platform Chemicals Market Y-o-Y Growth Rate Comparison By Type (2016-2032)
- Figure 97: Eastern Europe Bio Based Platform Chemicals Market Y-o-Y Growth Rate Comparison By Source (2016-2032)
- Figure 98: Eastern Europe Bio Based Platform Chemicals Market Y-o-Y Growth Rate Comparison By Product Type (2016-2032)
- Figure 99: Eastern Europe Bio Based Platform Chemicals Market Y-o-Y Growth Rate Comparison By End-Use (2016-2032)
- Figure 100: Eastern Europe Bio Based Platform Chemicals Market Share Comparison by Country (2016-2032)
- Figure 101: Eastern Europe Bio Based Platform Chemicals Market Share Comparison By Type (2016-2032)
- Figure 102: Eastern Europe Bio Based Platform Chemicals Market Share Comparison By Source (2016-2032)
- Figure 103: Eastern Europe Bio Based Platform Chemicals Market Share Comparison By Product Type (2016-2032)
- Figure 104: Eastern Europe Bio Based Platform Chemicals Market Share Comparison By End-Use (2016-2032)
- Figure 105: APAC Bio Based Platform Chemicals Market Revenue (US$ Mn) Market Share By Typein 2022
- Figure 106: APAC Bio Based Platform Chemicals Market Attractiveness Analysis By Type, 2016-2032
- Figure 107: APAC Bio Based Platform Chemicals Market Revenue (US$ Mn) Market Share By Sourcein 2022
- Figure 108: APAC Bio Based Platform Chemicals Market Attractiveness Analysis By Source, 2016-2032
- Figure 109: APAC Bio Based Platform Chemicals Market Revenue (US$ Mn) Market Share By Product Typein 2022
- Figure 110: APAC Bio Based Platform Chemicals Market Attractiveness Analysis By Product Type, 2016-2032
- Figure 111: APAC Bio Based Platform Chemicals Market Revenue (US$ Mn) Market Share By End-Usein 2022
- Figure 112: APAC Bio Based Platform Chemicals Market Attractiveness Analysis By End-Use, 2016-2032
- Figure 113: APAC Bio Based Platform Chemicals Market Revenue (US$ Mn) Market Share by Country in 2022
- Figure 114: APAC Bio Based Platform Chemicals Market Attractiveness Analysis by Country, 2016-2032
- Figure 115: APAC Bio Based Platform Chemicals Market Revenue (US$ Mn) (2016-2032)
- Figure 116: APAC Bio Based Platform Chemicals Market Revenue (US$ Mn) Comparison by Country (2016-2032)
- Figure 117: APAC Bio Based Platform Chemicals Market Revenue (US$ Mn) Comparison By Type (2016-2032)
- Figure 118: APAC Bio Based Platform Chemicals Market Revenue (US$ Mn) Comparison By Source (2016-2032)
- Figure 119: APAC Bio Based Platform Chemicals Market Revenue (US$ Mn) Comparison By Product Type (2016-2032)
- Figure 120: APAC Bio Based Platform Chemicals Market Revenue (US$ Mn) Comparison By End-Use (2016-2032)
- Figure 121: APAC Bio Based Platform Chemicals Market Y-o-Y Growth Rate Comparison by Country (2016-2032)
- Figure 122: APAC Bio Based Platform Chemicals Market Y-o-Y Growth Rate Comparison By Type (2016-2032)
- Figure 123: APAC Bio Based Platform Chemicals Market Y-o-Y Growth Rate Comparison By Source (2016-2032)
- Figure 124: APAC Bio Based Platform Chemicals Market Y-o-Y Growth Rate Comparison By Product Type (2016-2032)
- Figure 125: APAC Bio Based Platform Chemicals Market Y-o-Y Growth Rate Comparison By End-Use (2016-2032)
- Figure 126: APAC Bio Based Platform Chemicals Market Share Comparison by Country (2016-2032)
- Figure 127: APAC Bio Based Platform Chemicals Market Share Comparison By Type (2016-2032)
- Figure 128: APAC Bio Based Platform Chemicals Market Share Comparison By Source (2016-2032)
- Figure 129: APAC Bio Based Platform Chemicals Market Share Comparison By Product Type (2016-2032)
- Figure 130: APAC Bio Based Platform Chemicals Market Share Comparison By End-Use (2016-2032)
- Figure 131: Latin America Bio Based Platform Chemicals Market Revenue (US$ Mn) Market Share By Typein 2022
- Figure 132: Latin America Bio Based Platform Chemicals Market Attractiveness Analysis By Type, 2016-2032
- Figure 133: Latin America Bio Based Platform Chemicals Market Revenue (US$ Mn) Market Share By Sourcein 2022
- Figure 134: Latin America Bio Based Platform Chemicals Market Attractiveness Analysis By Source, 2016-2032
- Figure 135: Latin America Bio Based Platform Chemicals Market Revenue (US$ Mn) Market Share By Product Typein 2022
- Figure 136: Latin America Bio Based Platform Chemicals Market Attractiveness Analysis By Product Type, 2016-2032
- Figure 137: Latin America Bio Based Platform Chemicals Market Revenue (US$ Mn) Market Share By End-Usein 2022
- Figure 138: Latin America Bio Based Platform Chemicals Market Attractiveness Analysis By End-Use, 2016-2032
- Figure 139: Latin America Bio Based Platform Chemicals Market Revenue (US$ Mn) Market Share by Country in 2022
- Figure 140: Latin America Bio Based Platform Chemicals Market Attractiveness Analysis by Country, 2016-2032
- Figure 141: Latin America Bio Based Platform Chemicals Market Revenue (US$ Mn) (2016-2032)
- Figure 142: Latin America Bio Based Platform Chemicals Market Revenue (US$ Mn) Comparison by Country (2016-2032)
- Figure 143: Latin America Bio Based Platform Chemicals Market Revenue (US$ Mn) Comparison By Type (2016-2032)
- Figure 144: Latin America Bio Based Platform Chemicals Market Revenue (US$ Mn) Comparison By Source (2016-2032)
- Figure 145: Latin America Bio Based Platform Chemicals Market Revenue (US$ Mn) Comparison By Product Type (2016-2032)
- Figure 146: Latin America Bio Based Platform Chemicals Market Revenue (US$ Mn) Comparison By End-Use (2016-2032)
- Figure 147: Latin America Bio Based Platform Chemicals Market Y-o-Y Growth Rate Comparison by Country (2016-2032)
- Figure 148: Latin America Bio Based Platform Chemicals Market Y-o-Y Growth Rate Comparison By Type (2016-2032)
- Figure 149: Latin America Bio Based Platform Chemicals Market Y-o-Y Growth Rate Comparison By Source (2016-2032)
- Figure 150: Latin America Bio Based Platform Chemicals Market Y-o-Y Growth Rate Comparison By Product Type (2016-2032)
- Figure 151: Latin America Bio Based Platform Chemicals Market Y-o-Y Growth Rate Comparison By End-Use (2016-2032)
- Figure 152: Latin America Bio Based Platform Chemicals Market Share Comparison by Country (2016-2032)
- Figure 153: Latin America Bio Based Platform Chemicals Market Share Comparison By Type (2016-2032)
- Figure 154: Latin America Bio Based Platform Chemicals Market Share Comparison By Source (2016-2032)
- Figure 155: Latin America Bio Based Platform Chemicals Market Share Comparison By Product Type (2016-2032)
- Figure 156: Latin America Bio Based Platform Chemicals Market Share Comparison By End-Use (2016-2032)
- Figure 157: Middle East & Africa Bio Based Platform Chemicals Market Revenue (US$ Mn) Market Share By Typein 2022
- Figure 158: Middle East & Africa Bio Based Platform Chemicals Market Attractiveness Analysis By Type, 2016-2032
- Figure 159: Middle East & Africa Bio Based Platform Chemicals Market Revenue (US$ Mn) Market Share By Sourcein 2022
- Figure 160: Middle East & Africa Bio Based Platform Chemicals Market Attractiveness Analysis By Source, 2016-2032
- Figure 161: Middle East & Africa Bio Based Platform Chemicals Market Revenue (US$ Mn) Market Share By Product Typein 2022
- Figure 162: Middle East & Africa Bio Based Platform Chemicals Market Attractiveness Analysis By Product Type, 2016-2032
- Figure 163: Middle East & Africa Bio Based Platform Chemicals Market Revenue (US$ Mn) Market Share By End-Usein 2022
- Figure 164: Middle East & Africa Bio Based Platform Chemicals Market Attractiveness Analysis By End-Use, 2016-2032
- Figure 165: Middle East & Africa Bio Based Platform Chemicals Market Revenue (US$ Mn) Market Share by Country in 2022
- Figure 166: Middle East & Africa Bio Based Platform Chemicals Market Attractiveness Analysis by Country, 2016-2032
- Figure 167: Middle East & Africa Bio Based Platform Chemicals Market Revenue (US$ Mn) (2016-2032)
- Figure 168: Middle East & Africa Bio Based Platform Chemicals Market Revenue (US$ Mn) Comparison by Country (2016-2032)
- Figure 169: Middle East & Africa Bio Based Platform Chemicals Market Revenue (US$ Mn) Comparison By Type (2016-2032)
- Figure 170: Middle East & Africa Bio Based Platform Chemicals Market Revenue (US$ Mn) Comparison By Source (2016-2032)
- Figure 171: Middle East & Africa Bio Based Platform Chemicals Market Revenue (US$ Mn) Comparison By Product Type (2016-2032)
- Figure 172: Middle East & Africa Bio Based Platform Chemicals Market Revenue (US$ Mn) Comparison By End-Use (2016-2032)
- Figure 173: Middle East & Africa Bio Based Platform Chemicals Market Y-o-Y Growth Rate Comparison by Country (2016-2032)
- Figure 174: Middle East & Africa Bio Based Platform Chemicals Market Y-o-Y Growth Rate Comparison By Type (2016-2032)
- Figure 175: Middle East & Africa Bio Based Platform Chemicals Market Y-o-Y Growth Rate Comparison By Source (2016-2032)
- Figure 176: Middle East & Africa Bio Based Platform Chemicals Market Y-o-Y Growth Rate Comparison By Product Type (2016-2032)
- Figure 177: Middle East & Africa Bio Based Platform Chemicals Market Y-o-Y Growth Rate Comparison By End-Use (2016-2032)
- Figure 178: Middle East & Africa Bio Based Platform Chemicals Market Share Comparison by Country (2016-2032)
- Figure 179: Middle East & Africa Bio Based Platform Chemicals Market Share Comparison By Type (2016-2032)
- Figure 180: Middle East & Africa Bio Based Platform Chemicals Market Share Comparison By Source (2016-2032)
- Figure 181: Middle East & Africa Bio Based Platform Chemicals Market Share Comparison By Product Type (2016-2032)
- Figure 182: Middle East & Africa Bio Based Platform Chemicals Market Share Comparison By End-Use (2016-2032)
List of Tables
- Table 1: Global Bio Based Platform Chemicals Market Comparison By Type (2016-2032)
- Table 2: Global Bio Based Platform Chemicals Market Comparison By Source (2016-2032)
- Table 3: Global Bio Based Platform Chemicals Market Comparison By Product Type (2016-2032)
- Table 4: Global Bio Based Platform Chemicals Market Comparison By End-Use (2016-2032)
- Table 5: Global Bio Based Platform Chemicals Market Revenue (US$ Mn) Comparison by Region (2016-2032)
- Table 6: Global Bio Based Platform Chemicals Market Revenue (US$ Mn) (2016-2032)
- Table 7: Global Bio Based Platform Chemicals Market Revenue (US$ Mn) Comparison by Region (2016-2032)
- Table 8: Global Bio Based Platform Chemicals Market Revenue (US$ Mn) Comparison By Type (2016-2032)
- Table 9: Global Bio Based Platform Chemicals Market Revenue (US$ Mn) Comparison By Source (2016-2032)
- Table 10: Global Bio Based Platform Chemicals Market Revenue (US$ Mn) Comparison By Product Type (2016-2032)
- Table 11: Global Bio Based Platform Chemicals Market Revenue (US$ Mn) Comparison By End-Use (2016-2032)
- Table 12: Global Bio Based Platform Chemicals Market Y-o-Y Growth Rate Comparison by Region (2016-2032)
- Table 13: Global Bio Based Platform Chemicals Market Y-o-Y Growth Rate Comparison By Type (2016-2032)
- Table 14: Global Bio Based Platform Chemicals Market Y-o-Y Growth Rate Comparison By Source (2016-2032)
- Table 15: Global Bio Based Platform Chemicals Market Y-o-Y Growth Rate Comparison By Product Type (2016-2032)
- Table 16: Global Bio Based Platform Chemicals Market Y-o-Y Growth Rate Comparison By End-Use (2016-2032)
- Table 17: Global Bio Based Platform Chemicals Market Share Comparison by Region (2016-2032)
- Table 18: Global Bio Based Platform Chemicals Market Share Comparison By Type (2016-2032)
- Table 19: Global Bio Based Platform Chemicals Market Share Comparison By Source (2016-2032)
- Table 20: Global Bio Based Platform Chemicals Market Share Comparison By Product Type (2016-2032)
- Table 21: Global Bio Based Platform Chemicals Market Share Comparison By End-Use (2016-2032)
- Table 22: North America Bio Based Platform Chemicals Market Comparison By Source (2016-2032)
- Table 23: North America Bio Based Platform Chemicals Market Comparison By Product Type (2016-2032)
- Table 24: North America Bio Based Platform Chemicals Market Comparison By End-Use (2016-2032)
- Table 25: North America Bio Based Platform Chemicals Market Revenue (US$ Mn) Comparison by Country (2016-2032)
- Table 26: North America Bio Based Platform Chemicals Market Revenue (US$ Mn) (2016-2032)
- Table 27: North America Bio Based Platform Chemicals Market Revenue (US$ Mn) Comparison by Country (2016-2032)
- Table 28: North America Bio Based Platform Chemicals Market Revenue (US$ Mn) Comparison By Type (2016-2032)
- Table 29: North America Bio Based Platform Chemicals Market Revenue (US$ Mn) Comparison By Source (2016-2032)
- Table 30: North America Bio Based Platform Chemicals Market Revenue (US$ Mn) Comparison By Product Type (2016-2032)
- Table 31: North America Bio Based Platform Chemicals Market Revenue (US$ Mn) Comparison By End-Use (2016-2032)
- Table 32: North America Bio Based Platform Chemicals Market Y-o-Y Growth Rate Comparison by Country (2016-2032)
- Table 33: North America Bio Based Platform Chemicals Market Y-o-Y Growth Rate Comparison By Type (2016-2032)
- Table 34: North America Bio Based Platform Chemicals Market Y-o-Y Growth Rate Comparison By Source (2016-2032)
- Table 35: North America Bio Based Platform Chemicals Market Y-o-Y Growth Rate Comparison By Product Type (2016-2032)
- Table 36: North America Bio Based Platform Chemicals Market Y-o-Y Growth Rate Comparison By End-Use (2016-2032)
- Table 37: North America Bio Based Platform Chemicals Market Share Comparison by Country (2016-2032)
- Table 38: North America Bio Based Platform Chemicals Market Share Comparison By Type (2016-2032)
- Table 39: North America Bio Based Platform Chemicals Market Share Comparison By Source (2016-2032)
- Table 40: North America Bio Based Platform Chemicals Market Share Comparison By Product Type (2016-2032)
- Table 41: North America Bio Based Platform Chemicals Market Share Comparison By End-Use (2016-2032)
- Table 42: Western Europe Bio Based Platform Chemicals Market Comparison By Type (2016-2032)
- Table 43: Western Europe Bio Based Platform Chemicals Market Comparison By Source (2016-2032)
- Table 44: Western Europe Bio Based Platform Chemicals Market Comparison By Product Type (2016-2032)
- Table 45: Western Europe Bio Based Platform Chemicals Market Comparison By End-Use (2016-2032)
- Table 46: Western Europe Bio Based Platform Chemicals Market Revenue (US$ Mn) Comparison by Country (2016-2032)
- Table 47: Western Europe Bio Based Platform Chemicals Market Revenue (US$ Mn) (2016-2032)
- Table 48: Western Europe Bio Based Platform Chemicals Market Revenue (US$ Mn) Comparison by Country (2016-2032)
- Table 49: Western Europe Bio Based Platform Chemicals Market Revenue (US$ Mn) Comparison By Type (2016-2032)
- Table 50: Western Europe Bio Based Platform Chemicals Market Revenue (US$ Mn) Comparison By Source (2016-2032)
- Table 51: Western Europe Bio Based Platform Chemicals Market Revenue (US$ Mn) Comparison By Product Type (2016-2032)
- Table 52: Western Europe Bio Based Platform Chemicals Market Revenue (US$ Mn) Comparison By End-Use (2016-2032)
- Table 53: Western Europe Bio Based Platform Chemicals Market Y-o-Y Growth Rate Comparison by Country (2016-2032)
- Table 54: Western Europe Bio Based Platform Chemicals Market Y-o-Y Growth Rate Comparison By Type (2016-2032)
- Table 55: Western Europe Bio Based Platform Chemicals Market Y-o-Y Growth Rate Comparison By Source (2016-2032)
- Table 56: Western Europe Bio Based Platform Chemicals Market Y-o-Y Growth Rate Comparison By Product Type (2016-2032)
- Table 57: Western Europe Bio Based Platform Chemicals Market Y-o-Y Growth Rate Comparison By End-Use (2016-2032)
- Table 58: Western Europe Bio Based Platform Chemicals Market Share Comparison by Country (2016-2032)
- Table 59: Western Europe Bio Based Platform Chemicals Market Share Comparison By Type (2016-2032)
- Table 60: Western Europe Bio Based Platform Chemicals Market Share Comparison By Source (2016-2032)
- Table 61: Western Europe Bio Based Platform Chemicals Market Share Comparison By Product Type (2016-2032)
- Table 62: Western Europe Bio Based Platform Chemicals Market Share Comparison By End-Use (2016-2032)
- Table 63: Eastern Europe Bio Based Platform Chemicals Market Comparison By Type (2016-2032)
- Table 64: Eastern Europe Bio Based Platform Chemicals Market Comparison By Source (2016-2032)
- Table 65: Eastern Europe Bio Based Platform Chemicals Market Comparison By Product Type (2016-2032)
- Table 66: Eastern Europe Bio Based Platform Chemicals Market Comparison By End-Use (2016-2032)
- Table 67: Eastern Europe Bio Based Platform Chemicals Market Revenue (US$ Mn) Comparison by Country (2016-2032)
- Table 68: Eastern Europe Bio Based Platform Chemicals Market Revenue (US$ Mn) (2016-2032)
- Table 69: Eastern Europe Bio Based Platform Chemicals Market Revenue (US$ Mn) Comparison by Country (2016-2032)
- Table 70: Eastern Europe Bio Based Platform Chemicals Market Revenue (US$ Mn) Comparison By Type (2016-2032)
- Table 71: Eastern Europe Bio Based Platform Chemicals Market Revenue (US$ Mn) Comparison By Source (2016-2032)
- Table 72: Eastern Europe Bio Based Platform Chemicals Market Revenue (US$ Mn) Comparison By Product Type (2016-2032)
- Table 73: Eastern Europe Bio Based Platform Chemicals Market Revenue (US$ Mn) Comparison By End-Use (2016-2032)
- Table 74: Eastern Europe Bio Based Platform Chemicals Market Y-o-Y Growth Rate Comparison by Country (2016-2032)
- Table 75: Eastern Europe Bio Based Platform Chemicals Market Y-o-Y Growth Rate Comparison By Type (2016-2032)
- Table 76: Eastern Europe Bio Based Platform Chemicals Market Y-o-Y Growth Rate Comparison By Source (2016-2032)
- Table 77: Eastern Europe Bio Based Platform Chemicals Market Y-o-Y Growth Rate Comparison By Product Type (2016-2032)
- Table 78: Eastern Europe Bio Based Platform Chemicals Market Y-o-Y Growth Rate Comparison By End-Use (2016-2032)
- Table 79: Eastern Europe Bio Based Platform Chemicals Market Share Comparison by Country (2016-2032)
- Table 80: Eastern Europe Bio Based Platform Chemicals Market Share Comparison By Type (2016-2032)
- Table 81: Eastern Europe Bio Based Platform Chemicals Market Share Comparison By Source (2016-2032)
- Table 82: Eastern Europe Bio Based Platform Chemicals Market Share Comparison By Product Type (2016-2032)
- Table 83: Eastern Europe Bio Based Platform Chemicals Market Share Comparison By End-Use (2016-2032)
- Table 84: APAC Bio Based Platform Chemicals Market Comparison By Type (2016-2032)
- Table 85: APAC Bio Based Platform Chemicals Market Comparison By Source (2016-2032)
- Table 86: APAC Bio Based Platform Chemicals Market Comparison By Product Type (2016-2032)
- Table 87: APAC Bio Based Platform Chemicals Market Comparison By End-Use (2016-2032)
- Table 88: APAC Bio Based Platform Chemicals Market Revenue (US$ Mn) Comparison by Country (2016-2032)
- Table 89: APAC Bio Based Platform Chemicals Market Revenue (US$ Mn) (2016-2032)
- Table 90: APAC Bio Based Platform Chemicals Market Revenue (US$ Mn) Comparison by Country (2016-2032)
- Table 91: APAC Bio Based Platform Chemicals Market Revenue (US$ Mn) Comparison By Type (2016-2032)
- Table 92: APAC Bio Based Platform Chemicals Market Revenue (US$ Mn) Comparison By Source (2016-2032)
- Table 93: APAC Bio Based Platform Chemicals Market Revenue (US$ Mn) Comparison By Product Type (2016-2032)
- Table 94: APAC Bio Based Platform Chemicals Market Revenue (US$ Mn) Comparison By End-Use (2016-2032)
- Table 95: APAC Bio Based Platform Chemicals Market Y-o-Y Growth Rate Comparison by Country (2016-2032)
- Table 96: APAC Bio Based Platform Chemicals Market Y-o-Y Growth Rate Comparison By Type (2016-2032)
- Table 97: APAC Bio Based Platform Chemicals Market Y-o-Y Growth Rate Comparison By Source (2016-2032)
- Table 98: APAC Bio Based Platform Chemicals Market Y-o-Y Growth Rate Comparison By Product Type (2016-2032)
- Table 99: APAC Bio Based Platform Chemicals Market Y-o-Y Growth Rate Comparison By End-Use (2016-2032)
- Table 100: APAC Bio Based Platform Chemicals Market Share Comparison by Country (2016-2032)
- Table 101: APAC Bio Based Platform Chemicals Market Share Comparison By Type (2016-2032)
- Table 102: APAC Bio Based Platform Chemicals Market Share Comparison By Source (2016-2032)
- Table 103: APAC Bio Based Platform Chemicals Market Share Comparison By Product Type (2016-2032)
- Table 104: APAC Bio Based Platform Chemicals Market Share Comparison By End-Use (2016-2032)
- Table 105: Latin America Bio Based Platform Chemicals Market Comparison By Type (2016-2032)
- Table 106: Latin America Bio Based Platform Chemicals Market Comparison By Source (2016-2032)
- Table 107: Latin America Bio Based Platform Chemicals Market Comparison By Product Type (2016-2032)
- Table 108: Latin America Bio Based Platform Chemicals Market Comparison By End-Use (2016-2032)
- Table 109: Latin America Bio Based Platform Chemicals Market Revenue (US$ Mn) Comparison by Country (2016-2032)
- Table 110: Latin America Bio Based Platform Chemicals Market Revenue (US$ Mn) (2016-2032)
- Table 111: Latin America Bio Based Platform Chemicals Market Revenue (US$ Mn) Comparison by Country (2016-2032)
- Table 112: Latin America Bio Based Platform Chemicals Market Revenue (US$ Mn) Comparison By Type (2016-2032)
- Table 113: Latin America Bio Based Platform Chemicals Market Revenue (US$ Mn) Comparison By Source (2016-2032)
- Table 114: Latin America Bio Based Platform Chemicals Market Revenue (US$ Mn) Comparison By Product Type (2016-2032)
- Table 115: Latin America Bio Based Platform Chemicals Market Revenue (US$ Mn) Comparison By End-Use (2016-2032)
- Table 116: Latin America Bio Based Platform Chemicals Market Y-o-Y Growth Rate Comparison by Country (2016-2032)
- Table 117: Latin America Bio Based Platform Chemicals Market Y-o-Y Growth Rate Comparison By Type (2016-2032)
- Table 118: Latin America Bio Based Platform Chemicals Market Y-o-Y Growth Rate Comparison By Source (2016-2032)
- Table 119: Latin America Bio Based Platform Chemicals Market Y-o-Y Growth Rate Comparison By Product Type (2016-2032)
- Table 120: Latin America Bio Based Platform Chemicals Market Y-o-Y Growth Rate Comparison By End-Use (2016-2032)
- Table 121: Latin America Bio Based Platform Chemicals Market Share Comparison by Country (2016-2032)
- Table 122: Latin America Bio Based Platform Chemicals Market Share Comparison By Type (2016-2032)
- Table 123: Latin America Bio Based Platform Chemicals Market Share Comparison By Source (2016-2032)
- Table 124: Latin America Bio Based Platform Chemicals Market Share Comparison By Product Type (2016-2032)
- Table 125: Latin America Bio Based Platform Chemicals Market Share Comparison By End-Use (2016-2032)
- Table 126: Middle East & Africa Bio Based Platform Chemicals Market Comparison By Type (2016-2032)
- Table 127: Middle East & Africa Bio Based Platform Chemicals Market Comparison By Source (2016-2032)
- Table 128: Middle East & Africa Bio Based Platform Chemicals Market Comparison By Product Type (2016-2032)
- Table 129: Middle East & Africa Bio Based Platform Chemicals Market Comparison By End-Use (2016-2032)
- Table 130: Middle East & Africa Bio Based Platform Chemicals Market Revenue (US$ Mn) Comparison by Country (2016-2032)
- Table 131: Middle East & Africa Bio Based Platform Chemicals Market Revenue (US$ Mn) (2016-2032)
- Table 132: Middle East & Africa Bio Based Platform Chemicals Market Revenue (US$ Mn) Comparison by Country (2016-2032)
- Table 133: Middle East & Africa Bio Based Platform Chemicals Market Revenue (US$ Mn) Comparison By Type (2016-2032)
- Table 134: Middle East & Africa Bio Based Platform Chemicals Market Revenue (US$ Mn) Comparison By Source (2016-2032)
- Table 135: Middle East & Africa Bio Based Platform Chemicals Market Revenue (US$ Mn) Comparison By Product Type (2016-2032)
- Table 136: Middle East & Africa Bio Based Platform Chemicals Market Revenue (US$ Mn) Comparison By End-Use (2016-2032)
- Table 137: Middle East & Africa Bio Based Platform Chemicals Market Y-o-Y Growth Rate Comparison by Country (2016-2032)
- Table 138: Middle East & Africa Bio Based Platform Chemicals Market Y-o-Y Growth Rate Comparison By Type (2016-2032)
- Table 139: Middle East & Africa Bio Based Platform Chemicals Market Y-o-Y Growth Rate Comparison By Source (2016-2032)
- Table 140: Middle East & Africa Bio Based Platform Chemicals Market Y-o-Y Growth Rate Comparison By Product Type (2016-2032)
- Table 141: Middle East & Africa Bio Based Platform Chemicals Market Y-o-Y Growth Rate Comparison By End-Use (2016-2032)
- Table 142: Middle East & Africa Bio Based Platform Chemicals Market Share Comparison by Country (2016-2032)
- Table 143: Middle East & Africa Bio Based Platform Chemicals Market Share Comparison By Type (2016-2032)
- Table 144: Middle East & Africa Bio Based Platform Chemicals Market Share Comparison By Source (2016-2032)
- Table 145: Middle East & Africa Bio Based Platform Chemicals Market Share Comparison By Product Type (2016-2032)
- Table 146: Middle East & Africa Bio Based Platform Chemicals Market Share Comparison By End-Use (2016-2032)
- 1. Executive Summary
-
- Lyondell Basell Industries Holdings BV (Netherlands)
- BASF SE (Germany)
- Thermo Fisher Scientific (U.S.)
- Ultimate Chem India Pvt. Ltd (India)
- Alpha Chemika (India)
- Haihang Industry (china)
- Ronas Chemicals (China)
- Merck KGaA (Germany)
- Alfa Aesar (U.S.)
- FUSO CHEMICAL CO.LTD. (China)
- FUJIFILM Wako Pure Chemical Corporation (Japan)
- Dupont (U.S.)
- Braskem (Brazil)
- KURARAY CO.LTD. (Japan)
- DAIKIN (Japan)
- Cargill Incorporated (U.S.)
- IP Group plc (U.K.)
- Novozymes (Denmark)
- Yield10 Bioscience Inc (U.S.)
Our Clients


View Our Licence Options
