
Ataxia Market By Type(Friedreich's Ataxia, Ataxia-telangiectasia, Episodic Ataxia, Other Types), By Product(Treatment, Diagnosis), By Dosage Form(Solid, Liquids, Other Dosage Forms), By Region And Companies - Industry Segment Outlook, Market Assessment, Competition Scenario, Trends, And Forecast 2024-2033
-
43104
-
Jan 2024
-
181
-


-
This report was compiled by Trishita Deb Trishita Deb is an experienced market research and consulting professional with over 7 years of expertise across healthcare, consumer goods, and materials, contributing to over 400 healthcare-related reports. Correspondence Team Lead- Healthcare Linkedin | Detailed Market research Methodology Our methodology involves a mix of primary research, including interviews with leading mental health experts, and secondary research from reputable medical journals and databases. View Detailed Methodology Page
-
Quick Navigation
- Ataxia Market Size, Share, Trends Analysis
- Ataxia Market Dynamics
- Ataxia Market Segmentation Analysis
- Ataxia Industry Segments
- Ataxia Market Growth Opportunity
- Ataxia Market Regional Analysis
- Ataxia Industry By Region
- Ataxia Market Share Analysis
- Ataxia Industry Key Players
- Ataxia Market Recent Development
- Report Scope
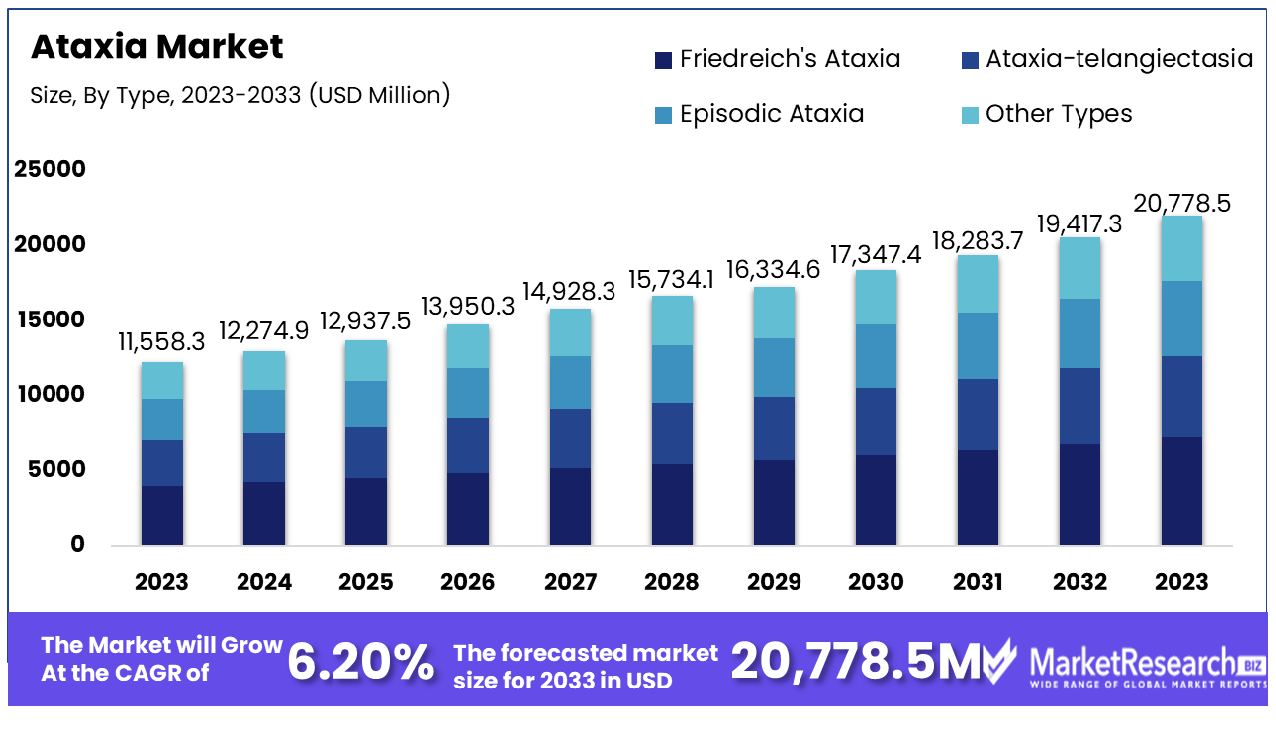
The Ataxia market was valued at USD 11,558.3 million in 2023. It is expected to reach USD 20,778.5 million by 2033, with a CAGR of 6.20% during the forecast period from 2024 to 2033.
The surge in demand for healthcare disbursement and the introduction of new products are some of the main driving factors for the ataxia market expansion. Ataxia prevails when the brain cells in the cerebellum deteriorate. It is a neurological symptom that demonstrates a lack of coordination in the movements of the body's muscles. This may lead to an absence of balance, coordination, and trouble walking.
It affects the fingers, hands, arms, legs, and even the eye movement. It can be caused by several reasons, like stroke, metabolic disorders, alcoholism, tumors, nerve damage, and many more medical issues. Ataxia describes a group of specific degenerative disorders of the central nervous system, known as hereditary and sporadic ataxias.
According to the National Center for Biotechnology Information, ataxia is seen in 26 cases per 100,000 children. The incidence rate of hereditary ataxia is 10 cases per 100,000 people. Cerebellar ataxia is commonly witnessed in 2.7 cases per 100,000 persons, and recessive hereditary cerebellar ataxia is seen in 3.3 cases per 100,000 persons. Globally, there are 3 out of 5.6 cases per 100,000 people of spinocerebellar ataxia.
Treatment for ataxia is dependent on its severity. In some situations of acquired ataxia, the underlying cause of treatment, like an infection or a lack of vitamin D, can comfort the symptoms. There is no such treatment for various types of ataxia. However, there are interventions available to manage ataxia symptoms and strengthen the immune response in your body. It consists of proper medications, assistive equipment, physical and speech therapy, and occupational therapy that helps to make different strategies that can make it easier to do daily activities.
Ataxia can be diagnosed through medical histories and complete neurological exams like lab tests, genetic tests, and MRIs. These tests also help to analyze other health conditions that can cause ataxia. Some conditions that can cause ataxia are hypothyroidism, alcohol abuse, infections, hemorrhage, and certain exposures to new medical drugs. The demand for ataxia will rapidly increase due to the rise in the number of ataxia diseases, which will help in market expansion in the forecast period.
Ataxia Market Dynamics
Diagnostic and Treatment Advances Boost Ataxia Market
The ataxia market is poised for significant growth, driven by anticipated advancements in diagnosis and treatment. As awareness and understanding of ataxia increase, more individuals are likely to seek medical advice, leading to higher diagnosis rates. Concurrently, advancements in diagnostic technologies, such as genetic testing and neuroimaging, are making the detection of ataxia more accurate and efficient.
The development of new therapeutic agents and treatment modalities, coupled with a better understanding of the disease's pathophysiology, is expected to enhance patient outcomes and quality of life. This dual focus on improving diagnostic capabilities and treatment efficacy is set to propel market revenue growth rate, ensuring that patients have access to the latest and most effective ataxia management strategies.
Diverse Risk Factors Propel Ataxia Market Growth
The ataxia market is experiencing significant growth, largely due to various risk key factors that lead to central nervous system damage or dysfunction, such as trauma, strokes, tumors, infections, and substance use. These conditions disrupt the normal functioning of the cerebellum and other brain regions, increasing the incidence and prevalence of ataxia.
As the global population ages and exposure to these risk major factors rises, the demand for ataxia diagnostics and treatments escalates. This market trend not only highlights the urgent need for effective management strategies for ataxia but also drives research and healthcare investment into developing and enhancing therapeutic and supportive care options, ensuring a continued expansion of the ataxia market.
Technological Advancements Fuel Ataxia Pharmacotherapy Market
Technological advances in pharmacotherapy for ataxia are fueling its expansion. Researchers and pharmaceutical companies alike are making strides to understand its underlying genetic and molecular mechanisms, leading to targeted therapy development and increased market growth. Innovations such as gene therapy, novel drug delivery systems, and personalized medicine approaches are revolutionizing the treatment landscape.
These advancements not only promise improved outcomes for ataxia patients but also expand the market by offering new and effective treatment options. As these technologies continue to evolve, they are expected to bring forth a new era in ataxia management, making treatment more accessible, efficient, and tailored to individual patient needs.
Diagnostic Challenges Hinder Ataxia Market Expansion
Ataxia can be difficult to diagnose due to its varied symptoms and the numerous conditions that cause it. The lack of precise, accessible, and cost-effective diagnostic tools means that many cases may go undiagnosed or misdiagnosed, leading to delayed or inappropriate treatment.
Improving diagnostic accuracy and accessibility is crucial for market growth, as early and accurate diagnosis can increase the demand for treatment and management solutions among patients and healthcare providers.
High Cost of Therapy Restricts Ataxia Market Accessibility
The high cost of therapy, such as solid, liquid, and other dosage forms, can restrict market growth by making treatments inaccessible to a broader patient population. For many individuals suffering from ataxia, especially those with chronic forms requiring long-term management, the financial burden of therapy can be substantial.
High costs can be a significant barrier, particularly in regions with limited healthcare coverage or for patients without sufficient insurance. The inability of a large segment of the potential market to afford these therapies can lead to reduced demand and slower market growth, emphasizing the need for more affordable treatment options.
Ataxia Market Segmentation Analysis
By Type Analysis
Friedreich's Ataxia is identified as the dominant segment within the ataxia market. This hereditary disease is the most common form of inherited ataxia, characterized by progressive nervous system damage and movement problems. The prevalence and severity of Friedreich's ataxia drive significant research and development efforts, focusing on finding effective treatments and managing symptoms.
Meanwhile, Friedreich's Ataxia leads due to its relative prevalence and impact; other types like Ataxia-telangiectasia and Episodic Ataxia are also areas of focus. Ataxia-telangiectasia is known for its early onset and complexity, affecting various body systems, whereas Episodic Ataxia presents with intermittent symptoms, adding to the diversity of clinical needs and research within the ataxia market.
By Product Analysis
Treatment is the dominant product segment in the ataxia market. The urgent need for effective management options for ataxia patients drives continuous research and development in this area. Treatments range from medications to manage symptoms to physical therapy designed to improve mobility and prevent complications.
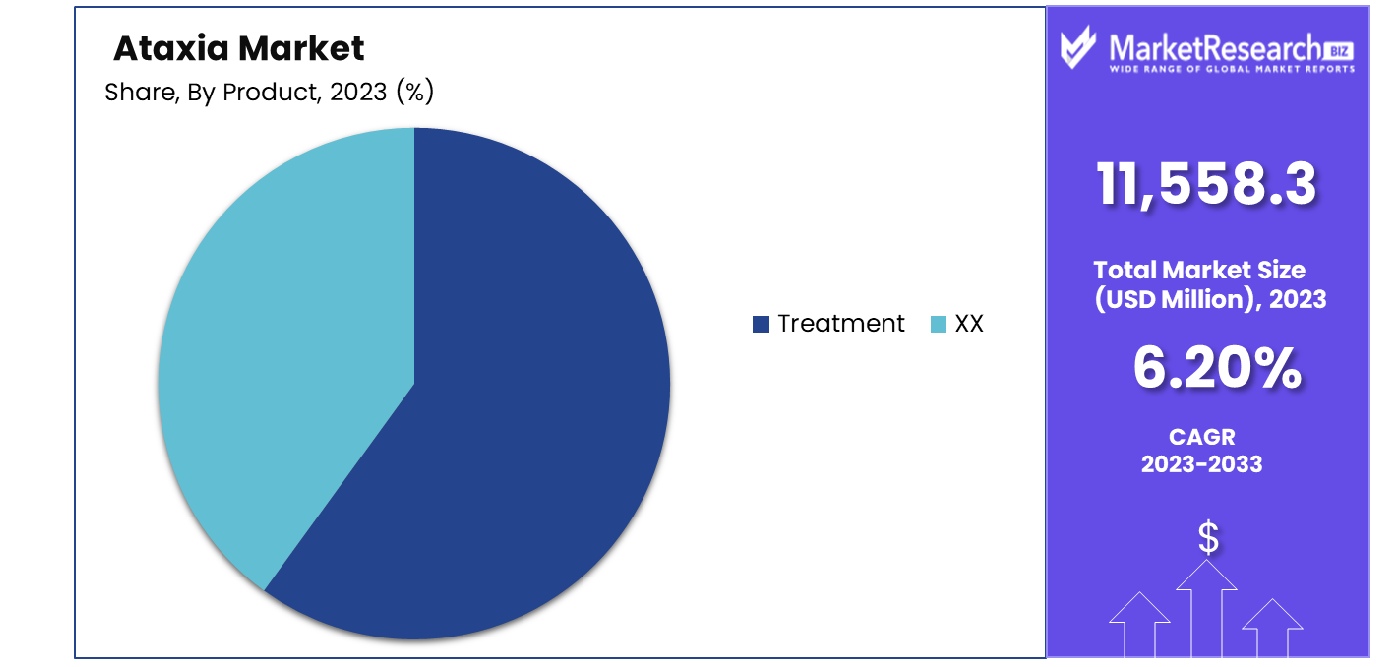
While the treatment segment leads due to the critical need for effective therapeutic options, diagnosis is also a significant segment. Early and accurate diagnosis is essential for managing ataxia, guiding treatment decisions, and improving patient outcomes. Advances in genetic testing and neuroimaging technology have dramatically increased our ability to accurately diagnose different forms of ataxia.
By Dosage Form Analysis
Solid dosage forms are a significant segment in the ataxia market, primarily due to their convenience, stability, and ease of administration. Many medications used to manage ataxia symptoms, such as tremors or coordination issues, are commonly formulated as tablets or capsules.
Liquid formulations are also important, especially for patients with swallowing difficulties or those requiring precise dosage adjustments. Other Dosage Forms, including injectables and emerging therapies, represent an area of ongoing research and development, offering potential new treatment avenues for ataxia patients.
Ataxia Industry Segments
By Type
- Friedreich's Ataxia
- Ataxia-telangiectasia
- Episodic Ataxia
- Other Types
By Product
- Treatment
- Diagnosis
By Dosage Form
- Solid
- Liquids
- Other Dosage Forms
Ataxia Market Growth Opportunity
Growing Awareness in Developing Countries Bolsters Ataxia Market
Growing awareness and resources in developing countries can positively impact the ataxia market's growth. As these regions invest more in healthcare infrastructure and education, there's an increase in the recognition and understanding of neurological disorders like ataxia.
Improved awareness leads to earlier diagnosis and treatment, which, in turn, drives the demand for ataxia-related medical services and treatments. The expanding healthcare awareness and infrastructure in developing countries present a significant opportunity for growth in the ataxia market, as more patients gain access to necessary care and treatment options.
Pharmacotherapy Advancements Expand Opportunities in Ataxia Market
Pharmacotherapy advances for ataxia are anticipated to create significant market expansion. As research continues, new and more effective treatment solutions are being created to manage and ease symptoms associated with ataxia. These pharmacological advancements are crucial for enhancing the quality of life for patients and may include more effective medications with fewer side effects.
The continuous development of innovative treatments reflects a dynamic market opportunity, driven by the ongoing need for effective ataxia management solutions and the potential for breakthrough therapies that could significantly impact patient care.
Ataxia Market Regional Analysis
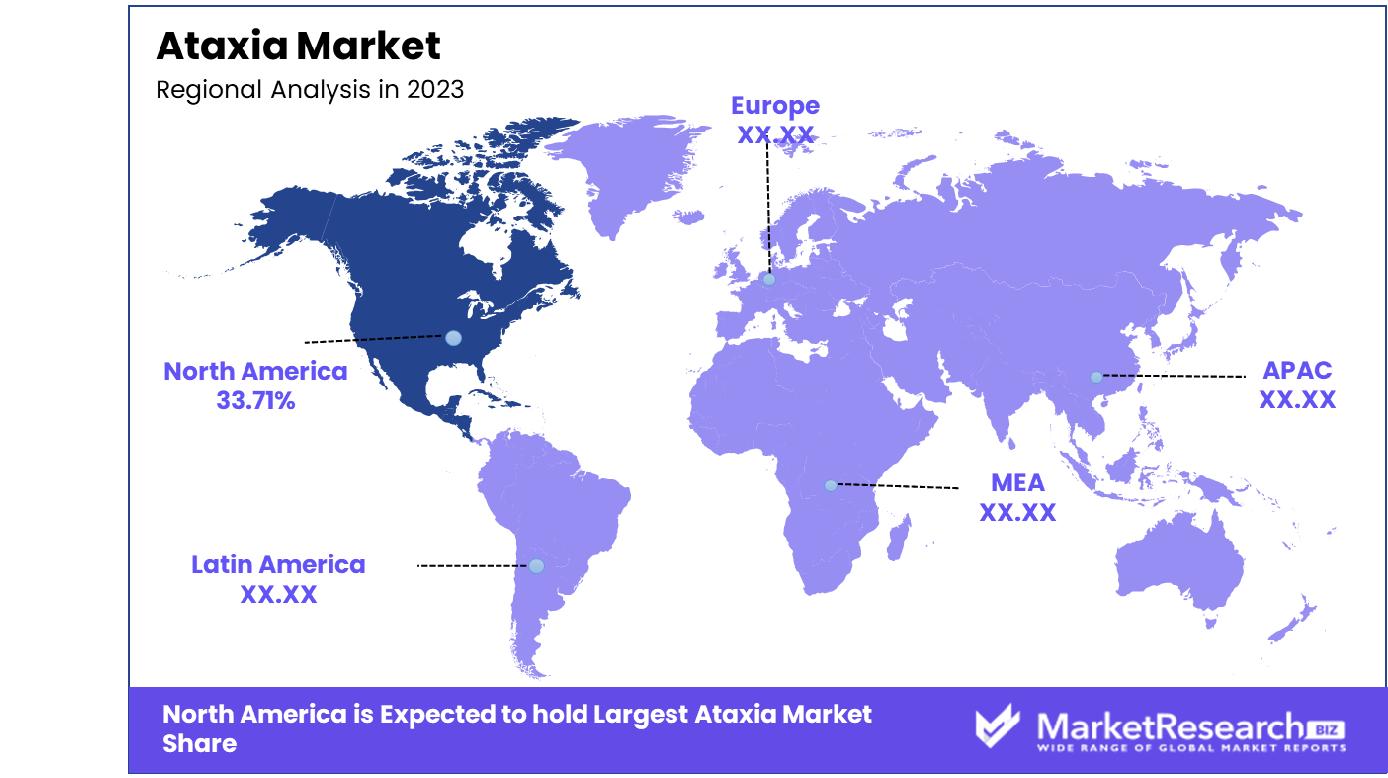
North America Dominates with 33.71% Market Share in Ataxia Market
North America's 33.71% share of the ataxia market is driven by its advanced healthcare system and high awareness of neurological disorders. The United States and Canada have a significant number of specialized neurology clinics and research institutions focusing on understanding and treating ataxia. The region's high healthcare expenditure allows for greater access to treatment and supports ongoing research into innovative therapies. Additionally, patient advocacy groups in North America play a crucial role in raising awareness, supporting research, and improving care for those affected by ataxia.
The market dynamics in North America are influenced by the strong emphasis on early diagnosis and comprehensive care. Advanced genetic testing and neuroimaging techniques are widely available, facilitating early and accurate diagnosis of ataxia. Further, the region's robust drug development pipeline and leading pharmaceutical companies help increase access to various treatment options. The increasing clinical trials and research initiatives aimed at understanding the underlying mechanisms of ataxia further stimulate market growth.
Europe: Strong Research Initiatives and Healthcare Infrastructure
Europe's ataxia market is driven by strong research initiatives and a well-established healthcare infrastructure. Focusing on genetic research and hosting neurologic centers have contributed to the market's expansion. Countries like Germany, the UK, and France have robust public health systems that provide access to various treatment options and support services for ataxia patients.
Asia-Pacific: Increasing Awareness and Improving Healthcare Access
Asia-Pacific ataxia market growth can be attributed to rising awareness and better healthcare access in countries like Japan, China, and India. Rising healthcare expenditure coupled with an increase in neurological disorder diagnostics drives demand for ataxia treatments and diagnostic tools; as these countries' healthcare systems continue to develop along with population aging trends will likely see substantial expansion of the Asia-Pacific ataxia market share.
Ataxia Industry By Region
North America
- The US
- Canada
- Rest of North America
Europe
- Germany
- France
- The UK
- Spain
- Italy
- Russia
- Netherlands
- Rest of Europe
Asia-Pacific
- China
- Japan
- South Korea
- India
- New Zealand
- Singapore
- Thailand
- Vietnam
- Rest of Asia Pacific
Latin America
- Brazil
- Mexico
- Rest of Latin America
Middle East & Africa
- South Africa
- Saudi Arabia
- UAE
- Rest of Middle East & Africa
Ataxia Market companies play an integral part in treating complex neurological disorders. Their services contribute significantly to furthering the treatment and understanding of Ataxia. Novartis AG and Merck KGaA are industry leaders, known for their broad portfolios and significant investments in neurological research. Their strategic positioning emphasizes innovative therapies and comprehensive care, significantly influencing the development of treatments for ataxia and related conditions.
Pfizer Inc. and Sanofi are key players with extensive experience in developing neurological medications, reflecting the industry's focus on enhancing the quality of life for patients with ataxia. Teva Pharmaceutical Industries Ltd. and Viatris Inc., with their generic and specialty medicine offerings, play crucial roles in making treatment more accessible and affordable.
Acorda Therapeutics, Inc. and Capsida Biotherapeutics, Inc., though smaller compared to global pharmaceutical giants, provide specialized focus on neurological conditions, demonstrating the market's potential for targeted and innovative treatment approaches. Sun Pharmaceutical Industries Ltd. and Lupin, with their strong presence in generic medicines, contribute to the market's diversity and competitive dynamics.
Ataxia Industry Key Players
- Novartis AG
- Merck KgaA
- Aurobindo Pharma
- Pfizer Inc.
- Sanofi
- Teva Pharmaceutical Industries Ltd.
- Acorda Therapeutics, Inc.
- Viatris Inc.
- Sun Pharmaceutical Industries Ltd.
- Lupin
- Amneal Pharmaceuticals LLC
- Apotex Inc.
- Capsida Biotherapeutics, Inc.
- Larimar Therapeutics, Inc.
- Reata Pharmaceuticals, Inc.
- Retrotope Inc.
- Cipla Inc.
- Upstream Rehabilitation Inc.
- Voyager Therapeutics, Inc
- Design Therapeutics Inc.
Ataxia Market Recent Development
- In January 2024, The FDA's recent approval of Reata Pharmaceuticals' omaveloxolone, marketed as Skyclarys, for the treatment of Friedreich's ataxia stands as a transformative milestone. The approval, granted just ahead of Rare Disease Day, has significant implications for patients suffering from this rare neuromuscular disorder.
- In November 2022, Pfizer Inc. announced that the company had completed its acquisition of Arena Pharmaceuticals. It is a clinical-stage company developing innovative potential therapies to treat several immuno-inflammatory diseases. This has helped the company to increase its product portfolio with this acquisition.
Report Scope
Report Features Description Market Value (2023) USD 11,558.3 Million Forecast Revenue (2033) USD 20,778.5 Million CAGR (2024-2032) 6.20% Base Year for Estimation 2023 Historic Period 2016-2023 Forecast Period 2024-2033 Report Coverage Revenue Forecast, Market Dynamics, COVID-19 Impact, Competitive Landscape, Recent Developments Segments Covered By Type(Friedreich's Ataxia, Ataxia-telangiectasia, Episodic Ataxia, Other Types), By Product(Treatment, Diagnosis), By Dosage Form(Solid, Liquids, Other Dosage Forms) Regional Analysis North America - The US, Canada, Rest of North America, Europe - Germany, France, The UK, Spain, Italy, Russia, Netherlands, Rest of Europe, Asia-Pacific - China, Japan, South Korea, India, New Zealand, Singapore, Thailand, Vietnam, Rest of Asia Pacific, Latin America - Brazil, Mexico, Rest of Latin America, Middle East & Africa - South Africa, Saudi Arabia, UAE, Rest of Middle East & Africa Competitive Landscape Novartis AG, Merck KgaA, Aurobindo Pharma, Pfizer Inc., Sanofi, Teva Pharmaceutical Industries Ltd., Acorda Therapeutics, Inc., Viatris Inc., Sun Pharmaceutical Industries Ltd., Lupin, Amneal Pharmaceuticals LLC, Apotex Inc., Capsida Biotherapeutics, Inc., Larimar Therapeutics, Inc., Reata Pharmaceuticals, Inc., Retrotope Inc., Cipla Inc., Upstream Rehabilitation Inc., Voyager Therapeutics, Inc, Design Therapeutics Inc. Customization Scope Customization for segments, region/country-level will be provided. Moreover, additional customization can be done based on the requirements. Purchase Options We have three licenses to opt for Single User License, Multi-User License (Up to 5 Users), Corporate Use License (Unlimited User and Printable PDF) -
- 1. Executive Summary
- 1.1. Definition
- 1.2. Taxonomy
- 1.3. Research Scope
- 1.4. Key Analysis
- 1.5. Key Findings by Major Segments
- 1.6. Top strategies by Major Players
- 2. Global Ataxia Market Overview
- 2.1. Ataxia Market Dynamics
- 2.1.1. Drivers
- 2.1.2. Opportunities
- 2.1.3. Restraints
- 2.1.4. Challenges
- 2.2. Macro-economic Factors
- 2.3. Regulatory Framework
- 2.4. Market Investment Feasibility Index
- 2.5. PEST Analysis
- 2.6. PORTER’S Five Force Analysis
- 2.7. Drivers & Restraints Impact Analysis
- 2.8. Industry Chain Analysis
- 2.9. Cost Structure Analysis
- 2.10. Marketing Strategy
- 2.11. Russia-Ukraine War Impact Analysis
- 2.12. Opportunity Map Analysis
- 2.13. Market Competition Scenario Analysis
- 2.14. Product Life Cycle Analysis
- 2.15. Opportunity Orbits
- 2.16. Manufacturer Intensity Map
- 2.17. Major Companies sales by Value & Volume
- 2.1. Ataxia Market Dynamics
- 3. Global Ataxia Market Analysis, Opportunity and Forecast, 2016-2032
- 3.1. Global Ataxia Market Analysis, 2016-2021
- 3.2. Global Ataxia Market Opportunity and Forecast, 2023-2032
- 3.3. Global Ataxia Market Analysis, Opportunity and Forecast, By By Type, 2016-2032
- 3.3.1. Global Ataxia Market Analysis by By Type: Introduction
- 3.3.2. Market Size Absolute $ Opportunity Analysis and Forecast, By By Type, 2016-2032
- 3.3.3. Friedreich's Ataxia
- 3.3.4. Ataxia-telangiectasia
- 3.3.5. Episodic Ataxia
- 3.3.6. Other Types
- 3.4. Global Ataxia Market Analysis, Opportunity and Forecast, By By Product, 2016-2032
- 3.4.1. Global Ataxia Market Analysis by By Product: Introduction
- 3.4.2. Market Size Absolute $ Opportunity Analysis and Forecast, By By Product, 2016-2032
- 3.4.3. Treatment
- 3.4.4. Diagnosis
- 3.5. Global Ataxia Market Analysis, Opportunity and Forecast, By By Dosage Form, 2016-2032
- 3.5.1. Global Ataxia Market Analysis by By Dosage Form: Introduction
- 3.5.2. Market Size Absolute $ Opportunity Analysis and Forecast, By By Dosage Form, 2016-2032
- 3.5.3. Solid
- 3.5.4. Liquids
- 3.5.5. Other Dosage Forms
- 4. North America Ataxia Market Analysis, Opportunity and Forecast, 2016-2032
- 4.1. North America Ataxia Market Analysis, 2016-2021
- 4.2. North America Ataxia Market Opportunity and Forecast, 2023-2032
- 4.3. North America Ataxia Market Analysis, Opportunity and Forecast, By By Type, 2016-2032
- 4.3.1. North America Ataxia Market Analysis by By Type: Introduction
- 4.3.2. Market Size Absolute $ Opportunity Analysis and Forecast, By By Type, 2016-2032
- 4.3.3. Friedreich's Ataxia
- 4.3.4. Ataxia-telangiectasia
- 4.3.5. Episodic Ataxia
- 4.3.6. Other Types
- 4.4. North America Ataxia Market Analysis, Opportunity and Forecast, By By Product, 2016-2032
- 4.4.1. North America Ataxia Market Analysis by By Product: Introduction
- 4.4.2. Market Size Absolute $ Opportunity Analysis and Forecast, By By Product, 2016-2032
- 4.4.3. Treatment
- 4.4.4. Diagnosis
- 4.5. North America Ataxia Market Analysis, Opportunity and Forecast, By By Dosage Form, 2016-2032
- 4.5.1. North America Ataxia Market Analysis by By Dosage Form: Introduction
- 4.5.2. Market Size Absolute $ Opportunity Analysis and Forecast, By By Dosage Form, 2016-2032
- 4.5.3. Solid
- 4.5.4. Liquids
- 4.5.5. Other Dosage Forms
- 4.6. North America Ataxia Market Analysis, Opportunity and Forecast, By Country , 2016-2032
- 4.6.1. North America Ataxia Market Analysis by Country : Introduction
- 4.6.2. Market Size Absolute $ Opportunity Analysis and Forecast, Country , 2016-2032
- 4.6.2.1. The US
- 4.6.2.2. Canada
- 4.6.2.3. Mexico
- 5. Western Europe Ataxia Market Analysis, Opportunity and Forecast, 2016-2032
- 5.1. Western Europe Ataxia Market Analysis, 2016-2021
- 5.2. Western Europe Ataxia Market Opportunity and Forecast, 2023-2032
- 5.3. Western Europe Ataxia Market Analysis, Opportunity and Forecast, By By Type, 2016-2032
- 5.3.1. Western Europe Ataxia Market Analysis by By Type: Introduction
- 5.3.2. Market Size Absolute $ Opportunity Analysis and Forecast, By By Type, 2016-2032
- 5.3.3. Friedreich's Ataxia
- 5.3.4. Ataxia-telangiectasia
- 5.3.5. Episodic Ataxia
- 5.3.6. Other Types
- 5.4. Western Europe Ataxia Market Analysis, Opportunity and Forecast, By By Product, 2016-2032
- 5.4.1. Western Europe Ataxia Market Analysis by By Product: Introduction
- 5.4.2. Market Size Absolute $ Opportunity Analysis and Forecast, By By Product, 2016-2032
- 5.4.3. Treatment
- 5.4.4. Diagnosis
- 5.5. Western Europe Ataxia Market Analysis, Opportunity and Forecast, By By Dosage Form, 2016-2032
- 5.5.1. Western Europe Ataxia Market Analysis by By Dosage Form: Introduction
- 5.5.2. Market Size Absolute $ Opportunity Analysis and Forecast, By By Dosage Form, 2016-2032
- 5.5.3. Solid
- 5.5.4. Liquids
- 5.5.5. Other Dosage Forms
- 5.6. Western Europe Ataxia Market Analysis, Opportunity and Forecast, By Country , 2016-2032
- 5.6.1. Western Europe Ataxia Market Analysis by Country : Introduction
- 5.6.2. Market Size Absolute $ Opportunity Analysis and Forecast, Country , 2016-2032
- 5.6.2.1. Germany
- 5.6.2.2. France
- 5.6.2.3. The UK
- 5.6.2.4. Spain
- 5.6.2.5. Italy
- 5.6.2.6. Portugal
- 5.6.2.7. Ireland
- 5.6.2.8. Austria
- 5.6.2.9. Switzerland
- 5.6.2.10. Benelux
- 5.6.2.11. Nordic
- 5.6.2.12. Rest of Western Europe
- 6. Eastern Europe Ataxia Market Analysis, Opportunity and Forecast, 2016-2032
- 6.1. Eastern Europe Ataxia Market Analysis, 2016-2021
- 6.2. Eastern Europe Ataxia Market Opportunity and Forecast, 2023-2032
- 6.3. Eastern Europe Ataxia Market Analysis, Opportunity and Forecast, By By Type, 2016-2032
- 6.3.1. Eastern Europe Ataxia Market Analysis by By Type: Introduction
- 6.3.2. Market Size Absolute $ Opportunity Analysis and Forecast, By By Type, 2016-2032
- 6.3.3. Friedreich's Ataxia
- 6.3.4. Ataxia-telangiectasia
- 6.3.5. Episodic Ataxia
- 6.3.6. Other Types
- 6.4. Eastern Europe Ataxia Market Analysis, Opportunity and Forecast, By By Product, 2016-2032
- 6.4.1. Eastern Europe Ataxia Market Analysis by By Product: Introduction
- 6.4.2. Market Size Absolute $ Opportunity Analysis and Forecast, By By Product, 2016-2032
- 6.4.3. Treatment
- 6.4.4. Diagnosis
- 6.5. Eastern Europe Ataxia Market Analysis, Opportunity and Forecast, By By Dosage Form, 2016-2032
- 6.5.1. Eastern Europe Ataxia Market Analysis by By Dosage Form: Introduction
- 6.5.2. Market Size Absolute $ Opportunity Analysis and Forecast, By By Dosage Form, 2016-2032
- 6.5.3. Solid
- 6.5.4. Liquids
- 6.5.5. Other Dosage Forms
- 6.6. Eastern Europe Ataxia Market Analysis, Opportunity and Forecast, By Country , 2016-2032
- 6.6.1. Eastern Europe Ataxia Market Analysis by Country : Introduction
- 6.6.2. Market Size Absolute $ Opportunity Analysis and Forecast, Country , 2016-2032
- 6.6.2.1. Russia
- 6.6.2.2. Poland
- 6.6.2.3. The Czech Republic
- 6.6.2.4. Greece
- 6.6.2.5. Rest of Eastern Europe
- 7. APAC Ataxia Market Analysis, Opportunity and Forecast, 2016-2032
- 7.1. APAC Ataxia Market Analysis, 2016-2021
- 7.2. APAC Ataxia Market Opportunity and Forecast, 2023-2032
- 7.3. APAC Ataxia Market Analysis, Opportunity and Forecast, By By Type, 2016-2032
- 7.3.1. APAC Ataxia Market Analysis by By Type: Introduction
- 7.3.2. Market Size Absolute $ Opportunity Analysis and Forecast, By By Type, 2016-2032
- 7.3.3. Friedreich's Ataxia
- 7.3.4. Ataxia-telangiectasia
- 7.3.5. Episodic Ataxia
- 7.3.6. Other Types
- 7.4. APAC Ataxia Market Analysis, Opportunity and Forecast, By By Product, 2016-2032
- 7.4.1. APAC Ataxia Market Analysis by By Product: Introduction
- 7.4.2. Market Size Absolute $ Opportunity Analysis and Forecast, By By Product, 2016-2032
- 7.4.3. Treatment
- 7.4.4. Diagnosis
- 7.5. APAC Ataxia Market Analysis, Opportunity and Forecast, By By Dosage Form, 2016-2032
- 7.5.1. APAC Ataxia Market Analysis by By Dosage Form: Introduction
- 7.5.2. Market Size Absolute $ Opportunity Analysis and Forecast, By By Dosage Form, 2016-2032
- 7.5.3. Solid
- 7.5.4. Liquids
- 7.5.5. Other Dosage Forms
- 7.6. APAC Ataxia Market Analysis, Opportunity and Forecast, By Country , 2016-2032
- 7.6.1. APAC Ataxia Market Analysis by Country : Introduction
- 7.6.2. Market Size Absolute $ Opportunity Analysis and Forecast, Country , 2016-2032
- 7.6.2.1. China
- 7.6.2.2. Japan
- 7.6.2.3. South Korea
- 7.6.2.4. India
- 7.6.2.5. Australia & New Zeland
- 7.6.2.6. Indonesia
- 7.6.2.7. Malaysia
- 7.6.2.8. Philippines
- 7.6.2.9. Singapore
- 7.6.2.10. Thailand
- 7.6.2.11. Vietnam
- 7.6.2.12. Rest of APAC
- 8. Latin America Ataxia Market Analysis, Opportunity and Forecast, 2016-2032
- 8.1. Latin America Ataxia Market Analysis, 2016-2021
- 8.2. Latin America Ataxia Market Opportunity and Forecast, 2023-2032
- 8.3. Latin America Ataxia Market Analysis, Opportunity and Forecast, By By Type, 2016-2032
- 8.3.1. Latin America Ataxia Market Analysis by By Type: Introduction
- 8.3.2. Market Size Absolute $ Opportunity Analysis and Forecast, By By Type, 2016-2032
- 8.3.3. Friedreich's Ataxia
- 8.3.4. Ataxia-telangiectasia
- 8.3.5. Episodic Ataxia
- 8.3.6. Other Types
- 8.4. Latin America Ataxia Market Analysis, Opportunity and Forecast, By By Product, 2016-2032
- 8.4.1. Latin America Ataxia Market Analysis by By Product: Introduction
- 8.4.2. Market Size Absolute $ Opportunity Analysis and Forecast, By By Product, 2016-2032
- 8.4.3. Treatment
- 8.4.4. Diagnosis
- 8.5. Latin America Ataxia Market Analysis, Opportunity and Forecast, By By Dosage Form, 2016-2032
- 8.5.1. Latin America Ataxia Market Analysis by By Dosage Form: Introduction
- 8.5.2. Market Size Absolute $ Opportunity Analysis and Forecast, By By Dosage Form, 2016-2032
- 8.5.3. Solid
- 8.5.4. Liquids
- 8.5.5. Other Dosage Forms
- 8.6. Latin America Ataxia Market Analysis, Opportunity and Forecast, By Country , 2016-2032
- 8.6.1. Latin America Ataxia Market Analysis by Country : Introduction
- 8.6.2. Market Size Absolute $ Opportunity Analysis and Forecast, Country , 2016-2032
- 8.6.2.1. Brazil
- 8.6.2.2. Colombia
- 8.6.2.3. Chile
- 8.6.2.4. Argentina
- 8.6.2.5. Costa Rica
- 8.6.2.6. Rest of Latin America
- 9. Middle East & Africa Ataxia Market Analysis, Opportunity and Forecast, 2016-2032
- 9.1. Middle East & Africa Ataxia Market Analysis, 2016-2021
- 9.2. Middle East & Africa Ataxia Market Opportunity and Forecast, 2023-2032
- 9.3. Middle East & Africa Ataxia Market Analysis, Opportunity and Forecast, By By Type, 2016-2032
- 9.3.1. Middle East & Africa Ataxia Market Analysis by By Type: Introduction
- 9.3.2. Market Size Absolute $ Opportunity Analysis and Forecast, By By Type, 2016-2032
- 9.3.3. Friedreich's Ataxia
- 9.3.4. Ataxia-telangiectasia
- 9.3.5. Episodic Ataxia
- 9.3.6. Other Types
- 9.4. Middle East & Africa Ataxia Market Analysis, Opportunity and Forecast, By By Product, 2016-2032
- 9.4.1. Middle East & Africa Ataxia Market Analysis by By Product: Introduction
- 9.4.2. Market Size Absolute $ Opportunity Analysis and Forecast, By By Product, 2016-2032
- 9.4.3. Treatment
- 9.4.4. Diagnosis
- 9.5. Middle East & Africa Ataxia Market Analysis, Opportunity and Forecast, By By Dosage Form, 2016-2032
- 9.5.1. Middle East & Africa Ataxia Market Analysis by By Dosage Form: Introduction
- 9.5.2. Market Size Absolute $ Opportunity Analysis and Forecast, By By Dosage Form, 2016-2032
- 9.5.3. Solid
- 9.5.4. Liquids
- 9.5.5. Other Dosage Forms
- 9.6. Middle East & Africa Ataxia Market Analysis, Opportunity and Forecast, By Country , 2016-2032
- 9.6.1. Middle East & Africa Ataxia Market Analysis by Country : Introduction
- 9.6.2. Market Size Absolute $ Opportunity Analysis and Forecast, Country , 2016-2032
- 9.6.2.1. Algeria
- 9.6.2.2. Egypt
- 9.6.2.3. Israel
- 9.6.2.4. Kuwait
- 9.6.2.5. Nigeria
- 9.6.2.6. Saudi Arabia
- 9.6.2.7. South Africa
- 9.6.2.8. Turkey
- 9.6.2.9. The UAE
- 9.6.2.10. Rest of MEA
- 10. Global Ataxia Market Analysis, Opportunity and Forecast, By Region , 2016-2032
- 10.1. Global Ataxia Market Analysis by Region : Introduction
- 10.2. Market Size Absolute $ Opportunity Analysis and Forecast, By Region , 2016-2032
- 10.2.1. North America
- 10.2.2. Western Europe
- 10.2.3. Eastern Europe
- 10.2.4. APAC
- 10.2.5. Latin America
- 10.2.6. Middle East & Africa
- 11. Global Ataxia Market Competitive Landscape, Market Share Analysis, and Company Profiles
- 11.1. Market Share Analysis
- 11.2. Company Profiles
- 11.3. Novartis AG
- 11.3.1. Company Overview
- 11.3.2. Financial Highlights
- 11.3.3. Product Portfolio
- 11.3.4. SWOT Analysis
- 11.3.5. Key Strategies and Developments
- 11.4. Merck KgaA
- 11.4.1. Company Overview
- 11.4.2. Financial Highlights
- 11.4.3. Product Portfolio
- 11.4.4. SWOT Analysis
- 11.4.5. Key Strategies and Developments
- 11.5. Aurobindo Pharma
- 11.5.1. Company Overview
- 11.5.2. Financial Highlights
- 11.5.3. Product Portfolio
- 11.5.4. SWOT Analysis
- 11.5.5. Key Strategies and Developments
- 11.6. Pfizer Inc.
- 11.6.1. Company Overview
- 11.6.2. Financial Highlights
- 11.6.3. Product Portfolio
- 11.6.4. SWOT Analysis
- 11.6.5. Key Strategies and Developments
- 11.7. Sanofi
- 11.7.1. Company Overview
- 11.7.2. Financial Highlights
- 11.7.3. Product Portfolio
- 11.7.4. SWOT Analysis
- 11.7.5. Key Strategies and Developments
- 11.8. Teva Pharmaceutical Industries Ltd.
- 11.8.1. Company Overview
- 11.8.2. Financial Highlights
- 11.8.3. Product Portfolio
- 11.8.4. SWOT Analysis
- 11.8.5. Key Strategies and Developments
- 11.9. Acorda Therapeutics, Inc.
- 11.9.1. Company Overview
- 11.9.2. Financial Highlights
- 11.9.3. Product Portfolio
- 11.9.4. SWOT Analysis
- 11.9.5. Key Strategies and Developments
- 11.10. Viatris Inc.
- 11.10.1. Company Overview
- 11.10.2. Financial Highlights
- 11.10.3. Product Portfolio
- 11.10.4. SWOT Analysis
- 11.10.5. Key Strategies and Developments
- 11.11. Sun Pharmaceutical Industries Ltd.
- 11.11.1. Company Overview
- 11.11.2. Financial Highlights
- 11.11.3. Product Portfolio
- 11.11.4. SWOT Analysis
- 11.11.5. Key Strategies and Developments
- 11.12. Lupin
- 11.12.1. Company Overview
- 11.12.2. Financial Highlights
- 11.12.3. Product Portfolio
- 11.12.4. SWOT Analysis
- 11.12.5. Key Strategies and Developments
- 11.13.1. Company Overview
- 11.13.2. Financial Highlights
- 11.13.3. Product Portfolio
- 11.13.4. SWOT Analysis
- 11.13.5. Key Strategies and Developments
- 11.14. Amneal Pharmaceuticals LLC
- 11.14.1. Company Overview
- 11.14.2. Financial Highlights
- 11.14.3. Product Portfolio
- 11.14.4. SWOT Analysis
- 11.14.5. Key Strategies and Developments
- 11.15. Capsida Biotherapeutics, Inc.
- 11.15.1. Company Overview
- 11.15.2. Financial Highlights
- 11.15.3. Product Portfolio
- 11.15.4. SWOT Analysis
- 11.15.5. Key Strategies and Developments
- 11.16. Larimar Therapeutics, Inc.
- 11.16.1. Company Overview
- 11.16.2. Financial Highlights
- 11.16.3. Product Portfolio
- 11.16.4. SWOT Analysis
- 11.16.5. Key Strategies and Developments
- 11.17. Reata Pharmaceuticals, Inc.
- 11.17.1. Company Overview
- 11.17.2. Financial Highlights
- 11.17.3. Product Portfolio
- 11.17.4. SWOT Analysis
- 11.17.5. Key Strategies and Developments
- 11.18. Retrotope Inc.
- 11.18.1. Company Overview
- 11.18.2. Financial Highlights
- 11.18.3. Product Portfolio
- 11.18.4. SWOT Analysis
- 11.18.5. Key Strategies and Developments
- 11.19. Cipla Inc.
- 11.19.1. Company Overview
- 11.19.2. Financial Highlights
- 11.19.3. Product Portfolio
- 11.19.4. SWOT Analysis
- 11.19.5. Key Strategies and Developments
- 11.20. Upstream Rehabilitation Inc.
- 11.20.1. Company Overview
- 11.20.2. Financial Highlights
- 11.20.3. Product Portfolio
- 11.20.4. SWOT Analysis
- 11.20.5. Key Strategies and Developments
- 11.21. Voyager Therapeutics, Inc
- 11.21.1. Company Overview
- 11.21.2. Financial Highlights
- 11.21.3. Product Portfolio
- 11.21.4. SWOT Analysis
- 11.21.5. Key Strategies and Developments
- 11.22. Design Therapeutics Inc.
- 11.22.1. Company Overview
- 11.22.2. Financial Highlights
- 11.22.3. Product Portfolio
- 11.22.4. SWOT Analysis
- 11.22.5. Key Strategies and Developments
- 12. Assumptions and Acronyms
- 13. Research Methodology
- 14. Contact
"
- List of Figures
- "
- Figure 1: Global Ataxia Market Revenue (US$ Mn) Market Share by By Type in 2022
- Figure 2: Global Ataxia Market Market Attractiveness Analysis by By Type, 2016-2032
- Figure 3: Global Ataxia Market Revenue (US$ Mn) Market Share by By Productin 2022
- Figure 4: Global Ataxia Market Market Attractiveness Analysis by By Product, 2016-2032
- Figure 5: Global Ataxia Market Revenue (US$ Mn) Market Share by By Dosage Formin 2022
- Figure 6: Global Ataxia Market Market Attractiveness Analysis by By Dosage Form, 2016-2032
- Figure 7: Global Ataxia Market Revenue (US$ Mn) Market Share by Region in 2022
- Figure 8: Global Ataxia Market Market Attractiveness Analysis by Region, 2016-2032
- Figure 9: Global Ataxia Market Market Revenue (US$ Mn) (2016-2032)
- Figure 10: Global Ataxia Market Market Revenue (US$ Mn) Comparison by Region (2016-2032)
- Figure 11: Global Ataxia Market Market Revenue (US$ Mn) Comparison by By Type (2016-2032)
- Figure 12: Global Ataxia Market Market Revenue (US$ Mn) Comparison by By Product (2016-2032)
- Figure 13: Global Ataxia Market Market Revenue (US$ Mn) Comparison by By Dosage Form (2016-2032)
- Figure 14: Global Ataxia Market Market Y-o-Y Growth Rate Comparison by Region (2016-2032)
- Figure 15: Global Ataxia Market Market Y-o-Y Growth Rate Comparison by By Type (2016-2032)
- Figure 16: Global Ataxia Market Market Y-o-Y Growth Rate Comparison by By Product (2016-2032)
- Figure 17: Global Ataxia Market Market Y-o-Y Growth Rate Comparison by By Dosage Form (2016-2032)
- Figure 18: Global Ataxia Market Market Share Comparison by Region (2016-2032)
- Figure 19: Global Ataxia Market Market Share Comparison by By Type (2016-2032)
- Figure 20: Global Ataxia Market Market Share Comparison by By Product (2016-2032)
- Figure 21: Global Ataxia Market Market Share Comparison by By Dosage Form (2016-2032)
- Figure 22: North America Ataxia Market Revenue (US$ Mn) Market Share by By Typein 2022
- Figure 23: North America Ataxia Market Market Attractiveness Analysis by By Type, 2016-2032
- Figure 24: North America Ataxia Market Revenue (US$ Mn) Market Share by By Productin 2022
- Figure 25: North America Ataxia Market Market Attractiveness Analysis by By Product, 2016-2032
- Figure 26: North America Ataxia Market Revenue (US$ Mn) Market Share by By Dosage Formin 2022
- Figure 27: North America Ataxia Market Market Attractiveness Analysis by By Dosage Form, 2016-2032
- Figure 28: North America Ataxia Market Revenue (US$ Mn) Market Share by Country in 2022
- Figure 29: North America Ataxia Market Market Attractiveness Analysis by Country, 2016-2032
- Figure 30: North America Ataxia Market Market Revenue (US$ Mn) (2016-2032)
- Figure 31: North America Ataxia Market Market Revenue (US$ Mn) Comparison by Country (2016-2032)
- Figure 32: North America Ataxia Market Market Revenue (US$ Mn) Comparison by By Type (2016-2032)
- Figure 33: North America Ataxia Market Market Revenue (US$ Mn) Comparison by By Product (2016-2032)
- Figure 34: North America Ataxia Market Market Revenue (US$ Mn) Comparison by By Dosage Form (2016-2032)
- Figure 35: North America Ataxia Market Market Y-o-Y Growth Rate Comparison by Country (2016-2032)
- Figure 36: North America Ataxia Market Market Y-o-Y Growth Rate Comparison by By Type (2016-2032)
- Figure 37: North America Ataxia Market Market Y-o-Y Growth Rate Comparison by By Product (2016-2032)
- Figure 38: North America Ataxia Market Market Y-o-Y Growth Rate Comparison by By Dosage Form (2016-2032)
- Figure 39: North America Ataxia Market Market Share Comparison by Country (2016-2032)
- Figure 40: North America Ataxia Market Market Share Comparison by By Type (2016-2032)
- Figure 41: North America Ataxia Market Market Share Comparison by By Product (2016-2032)
- Figure 42: North America Ataxia Market Market Share Comparison by By Dosage Form (2016-2032)
- Figure 43: Western Europe Ataxia Market Revenue (US$ Mn) Market Share by By Typein 2022
- Figure 44: Western Europe Ataxia Market Market Attractiveness Analysis by By Type, 2016-2032
- Figure 45: Western Europe Ataxia Market Revenue (US$ Mn) Market Share by By Productin 2022
- Figure 46: Western Europe Ataxia Market Market Attractiveness Analysis by By Product, 2016-2032
- Figure 47: Western Europe Ataxia Market Revenue (US$ Mn) Market Share by By Dosage Formin 2022
- Figure 48: Western Europe Ataxia Market Market Attractiveness Analysis by By Dosage Form, 2016-2032
- Figure 49: Western Europe Ataxia Market Revenue (US$ Mn) Market Share by Country in 2022
- Figure 50: Western Europe Ataxia Market Market Attractiveness Analysis by Country, 2016-2032
- Figure 51: Western Europe Ataxia Market Market Revenue (US$ Mn) (2016-2032)
- Figure 52: Western Europe Ataxia Market Market Revenue (US$ Mn) Comparison by Country (2016-2032)
- Figure 53: Western Europe Ataxia Market Market Revenue (US$ Mn) Comparison by By Type (2016-2032)
- Figure 54: Western Europe Ataxia Market Market Revenue (US$ Mn) Comparison by By Product (2016-2032)
- Figure 55: Western Europe Ataxia Market Market Revenue (US$ Mn) Comparison by By Dosage Form (2016-2032)
- Figure 56: Western Europe Ataxia Market Market Y-o-Y Growth Rate Comparison by Country (2016-2032)
- Figure 57: Western Europe Ataxia Market Market Y-o-Y Growth Rate Comparison by By Type (2016-2032)
- Figure 58: Western Europe Ataxia Market Market Y-o-Y Growth Rate Comparison by By Product (2016-2032)
- Figure 59: Western Europe Ataxia Market Market Y-o-Y Growth Rate Comparison by By Dosage Form (2016-2032)
- Figure 60: Western Europe Ataxia Market Market Share Comparison by Country (2016-2032)
- Figure 61: Western Europe Ataxia Market Market Share Comparison by By Type (2016-2032)
- Figure 62: Western Europe Ataxia Market Market Share Comparison by By Product (2016-2032)
- Figure 63: Western Europe Ataxia Market Market Share Comparison by By Dosage Form (2016-2032)
- Figure 64: Eastern Europe Ataxia Market Revenue (US$ Mn) Market Share by By Typein 2022
- Figure 65: Eastern Europe Ataxia Market Market Attractiveness Analysis by By Type, 2016-2032
- Figure 66: Eastern Europe Ataxia Market Revenue (US$ Mn) Market Share by By Productin 2022
- Figure 67: Eastern Europe Ataxia Market Market Attractiveness Analysis by By Product, 2016-2032
- Figure 68: Eastern Europe Ataxia Market Revenue (US$ Mn) Market Share by By Dosage Formin 2022
- Figure 69: Eastern Europe Ataxia Market Market Attractiveness Analysis by By Dosage Form, 2016-2032
- Figure 70: Eastern Europe Ataxia Market Revenue (US$ Mn) Market Share by Country in 2022
- Figure 71: Eastern Europe Ataxia Market Market Attractiveness Analysis by Country, 2016-2032
- Figure 72: Eastern Europe Ataxia Market Market Revenue (US$ Mn) (2016-2032)
- Figure 73: Eastern Europe Ataxia Market Market Revenue (US$ Mn) Comparison by Country (2016-2032)
- Figure 74: Eastern Europe Ataxia Market Market Revenue (US$ Mn) Comparison by By Type (2016-2032)
- Figure 75: Eastern Europe Ataxia Market Market Revenue (US$ Mn) Comparison by By Product (2016-2032)
- Figure 76: Eastern Europe Ataxia Market Market Revenue (US$ Mn) Comparison by By Dosage Form (2016-2032)
- Figure 77: Eastern Europe Ataxia Market Market Y-o-Y Growth Rate Comparison by Country (2016-2032)
- Figure 78: Eastern Europe Ataxia Market Market Y-o-Y Growth Rate Comparison by By Type (2016-2032)
- Figure 79: Eastern Europe Ataxia Market Market Y-o-Y Growth Rate Comparison by By Product (2016-2032)
- Figure 80: Eastern Europe Ataxia Market Market Y-o-Y Growth Rate Comparison by By Dosage Form (2016-2032)
- Figure 81: Eastern Europe Ataxia Market Market Share Comparison by Country (2016-2032)
- Figure 82: Eastern Europe Ataxia Market Market Share Comparison by By Type (2016-2032)
- Figure 83: Eastern Europe Ataxia Market Market Share Comparison by By Product (2016-2032)
- Figure 84: Eastern Europe Ataxia Market Market Share Comparison by By Dosage Form (2016-2032)
- Figure 85: APAC Ataxia Market Revenue (US$ Mn) Market Share by By Typein 2022
- Figure 86: APAC Ataxia Market Market Attractiveness Analysis by By Type, 2016-2032
- Figure 87: APAC Ataxia Market Revenue (US$ Mn) Market Share by By Productin 2022
- Figure 88: APAC Ataxia Market Market Attractiveness Analysis by By Product, 2016-2032
- Figure 89: APAC Ataxia Market Revenue (US$ Mn) Market Share by By Dosage Formin 2022
- Figure 90: APAC Ataxia Market Market Attractiveness Analysis by By Dosage Form, 2016-2032
- Figure 91: APAC Ataxia Market Revenue (US$ Mn) Market Share by Country in 2022
- Figure 92: APAC Ataxia Market Market Attractiveness Analysis by Country, 2016-2032
- Figure 93: APAC Ataxia Market Market Revenue (US$ Mn) (2016-2032)
- Figure 94: APAC Ataxia Market Market Revenue (US$ Mn) Comparison by Country (2016-2032)
- Figure 95: APAC Ataxia Market Market Revenue (US$ Mn) Comparison by By Type (2016-2032)
- Figure 96: APAC Ataxia Market Market Revenue (US$ Mn) Comparison by By Product (2016-2032)
- Figure 97: APAC Ataxia Market Market Revenue (US$ Mn) Comparison by By Dosage Form (2016-2032)
- Figure 98: APAC Ataxia Market Market Y-o-Y Growth Rate Comparison by Country (2016-2032)
- Figure 99: APAC Ataxia Market Market Y-o-Y Growth Rate Comparison by By Type (2016-2032)
- Figure 100: APAC Ataxia Market Market Y-o-Y Growth Rate Comparison by By Product (2016-2032)
- Figure 101: APAC Ataxia Market Market Y-o-Y Growth Rate Comparison by By Dosage Form (2016-2032)
- Figure 102: APAC Ataxia Market Market Share Comparison by Country (2016-2032)
- Figure 103: APAC Ataxia Market Market Share Comparison by By Type (2016-2032)
- Figure 104: APAC Ataxia Market Market Share Comparison by By Product (2016-2032)
- Figure 105: APAC Ataxia Market Market Share Comparison by By Dosage Form (2016-2032)
- Figure 106: Latin America Ataxia Market Revenue (US$ Mn) Market Share by By Typein 2022
- Figure 107: Latin America Ataxia Market Market Attractiveness Analysis by By Type, 2016-2032
- Figure 108: Latin America Ataxia Market Revenue (US$ Mn) Market Share by By Productin 2022
- Figure 109: Latin America Ataxia Market Market Attractiveness Analysis by By Product, 2016-2032
- Figure 110: Latin America Ataxia Market Revenue (US$ Mn) Market Share by By Dosage Formin 2022
- Figure 111: Latin America Ataxia Market Market Attractiveness Analysis by By Dosage Form, 2016-2032
- Figure 112: Latin America Ataxia Market Revenue (US$ Mn) Market Share by Country in 2022
- Figure 113: Latin America Ataxia Market Market Attractiveness Analysis by Country, 2016-2032
- Figure 114: Latin America Ataxia Market Market Revenue (US$ Mn) (2016-2032)
- Figure 115: Latin America Ataxia Market Market Revenue (US$ Mn) Comparison by Country (2016-2032)
- Figure 116: Latin America Ataxia Market Market Revenue (US$ Mn) Comparison by By Type (2016-2032)
- Figure 117: Latin America Ataxia Market Market Revenue (US$ Mn) Comparison by By Product (2016-2032)
- Figure 118: Latin America Ataxia Market Market Revenue (US$ Mn) Comparison by By Dosage Form (2016-2032)
- Figure 119: Latin America Ataxia Market Market Y-o-Y Growth Rate Comparison by Country (2016-2032)
- Figure 120: Latin America Ataxia Market Market Y-o-Y Growth Rate Comparison by By Type (2016-2032)
- Figure 121: Latin America Ataxia Market Market Y-o-Y Growth Rate Comparison by By Product (2016-2032)
- Figure 122: Latin America Ataxia Market Market Y-o-Y Growth Rate Comparison by By Dosage Form (2016-2032)
- Figure 123: Latin America Ataxia Market Market Share Comparison by Country (2016-2032)
- Figure 124: Latin America Ataxia Market Market Share Comparison by By Type (2016-2032)
- Figure 125: Latin America Ataxia Market Market Share Comparison by By Product (2016-2032)
- Figure 126: Latin America Ataxia Market Market Share Comparison by By Dosage Form (2016-2032)
- Figure 127: Middle East & Africa Ataxia Market Revenue (US$ Mn) Market Share by By Typein 2022
- Figure 128: Middle East & Africa Ataxia Market Market Attractiveness Analysis by By Type, 2016-2032
- Figure 129: Middle East & Africa Ataxia Market Revenue (US$ Mn) Market Share by By Productin 2022
- Figure 130: Middle East & Africa Ataxia Market Market Attractiveness Analysis by By Product, 2016-2032
- Figure 131: Middle East & Africa Ataxia Market Revenue (US$ Mn) Market Share by By Dosage Formin 2022
- Figure 132: Middle East & Africa Ataxia Market Market Attractiveness Analysis by By Dosage Form, 2016-2032
- Figure 133: Middle East & Africa Ataxia Market Revenue (US$ Mn) Market Share by Country in 2022
- Figure 134: Middle East & Africa Ataxia Market Market Attractiveness Analysis by Country, 2016-2032
- Figure 135: Middle East & Africa Ataxia Market Market Revenue (US$ Mn) (2016-2032)
- Figure 136: Middle East & Africa Ataxia Market Market Revenue (US$ Mn) Comparison by Country (2016-2032)
- Figure 137: Middle East & Africa Ataxia Market Market Revenue (US$ Mn) Comparison by By Type (2016-2032)
- Figure 138: Middle East & Africa Ataxia Market Market Revenue (US$ Mn) Comparison by By Product (2016-2032)
- Figure 139: Middle East & Africa Ataxia Market Market Revenue (US$ Mn) Comparison by By Dosage Form (2016-2032)
- Figure 140: Middle East & Africa Ataxia Market Market Y-o-Y Growth Rate Comparison by Country (2016-2032)
- Figure 141: Middle East & Africa Ataxia Market Market Y-o-Y Growth Rate Comparison by By Type (2016-2032)
- Figure 142: Middle East & Africa Ataxia Market Market Y-o-Y Growth Rate Comparison by By Product (2016-2032)
- Figure 143: Middle East & Africa Ataxia Market Market Y-o-Y Growth Rate Comparison by By Dosage Form (2016-2032)
- Figure 144: Middle East & Africa Ataxia Market Market Share Comparison by Country (2016-2032)
- Figure 145: Middle East & Africa Ataxia Market Market Share Comparison by By Type (2016-2032)
- Figure 146: Middle East & Africa Ataxia Market Market Share Comparison by By Product (2016-2032)
- Figure 147: Middle East & Africa Ataxia Market Market Share Comparison by By Dosage Form (2016-2032)
"
- List of Tables
- "
- Table 1: Global Ataxia Market Market Comparison by By Type (2016-2032)
- Table 2: Global Ataxia Market Market Comparison by By Product (2016-2032)
- Table 3: Global Ataxia Market Market Comparison by By Dosage Form (2016-2032)
- Table 4: Global Ataxia Market Revenue (US$ Mn) Comparison by Region (2016-2032)
- Table 5: Global Ataxia Market Market Revenue (US$ Mn) (2016-2032)
- Table 6: Global Ataxia Market Market Revenue (US$ Mn) Comparison by Region (2016-2032)
- Table 7: Global Ataxia Market Market Revenue (US$ Mn) Comparison by By Type (2016-2032)
- Table 8: Global Ataxia Market Market Revenue (US$ Mn) Comparison by By Product (2016-2032)
- Table 9: Global Ataxia Market Market Revenue (US$ Mn) Comparison by By Dosage Form (2016-2032)
- Table 10: Global Ataxia Market Market Y-o-Y Growth Rate Comparison by Region (2016-2032)
- Table 11: Global Ataxia Market Market Y-o-Y Growth Rate Comparison by By Type (2016-2032)
- Table 12: Global Ataxia Market Market Y-o-Y Growth Rate Comparison by By Product (2016-2032)
- Table 13: Global Ataxia Market Market Y-o-Y Growth Rate Comparison by By Dosage Form (2016-2032)
- Table 14: Global Ataxia Market Market Share Comparison by Region (2016-2032)
- Table 15: Global Ataxia Market Market Share Comparison by By Type (2016-2032)
- Table 16: Global Ataxia Market Market Share Comparison by By Product (2016-2032)
- Table 17: Global Ataxia Market Market Share Comparison by By Dosage Form (2016-2032)
- Table 18: North America Ataxia Market Market Comparison by By Product (2016-2032)
- Table 19: North America Ataxia Market Market Comparison by By Dosage Form (2016-2032)
- Table 20: North America Ataxia Market Revenue (US$ Mn) Comparison by Country (2016-2032)
- Table 21: North America Ataxia Market Market Revenue (US$ Mn) (2016-2032)
- Table 22: North America Ataxia Market Market Revenue (US$ Mn) Comparison by Country (2016-2032)
- Table 23: North America Ataxia Market Market Revenue (US$ Mn) Comparison by By Type (2016-2032)
- Table 24: North America Ataxia Market Market Revenue (US$ Mn) Comparison by By Product (2016-2032)
- Table 25: North America Ataxia Market Market Revenue (US$ Mn) Comparison by By Dosage Form (2016-2032)
- Table 26: North America Ataxia Market Market Y-o-Y Growth Rate Comparison by Country (2016-2032)
- Table 27: North America Ataxia Market Market Y-o-Y Growth Rate Comparison by By Type (2016-2032)
- Table 28: North America Ataxia Market Market Y-o-Y Growth Rate Comparison by By Product (2016-2032)
- Table 29: North America Ataxia Market Market Y-o-Y Growth Rate Comparison by By Dosage Form (2016-2032)
- Table 30: North America Ataxia Market Market Share Comparison by Country (2016-2032)
- Table 31: North America Ataxia Market Market Share Comparison by By Type (2016-2032)
- Table 32: North America Ataxia Market Market Share Comparison by By Product (2016-2032)
- Table 33: North America Ataxia Market Market Share Comparison by By Dosage Form (2016-2032)
- Table 34: Western Europe Ataxia Market Market Comparison by By Type (2016-2032)
- Table 35: Western Europe Ataxia Market Market Comparison by By Product (2016-2032)
- Table 36: Western Europe Ataxia Market Market Comparison by By Dosage Form (2016-2032)
- Table 37: Western Europe Ataxia Market Revenue (US$ Mn) Comparison by Country (2016-2032)
- Table 38: Western Europe Ataxia Market Market Revenue (US$ Mn) (2016-2032)
- Table 39: Western Europe Ataxia Market Market Revenue (US$ Mn) Comparison by Country (2016-2032)
- Table 40: Western Europe Ataxia Market Market Revenue (US$ Mn) Comparison by By Type (2016-2032)
- Table 41: Western Europe Ataxia Market Market Revenue (US$ Mn) Comparison by By Product (2016-2032)
- Table 42: Western Europe Ataxia Market Market Revenue (US$ Mn) Comparison by By Dosage Form (2016-2032)
- Table 43: Western Europe Ataxia Market Market Y-o-Y Growth Rate Comparison by Country (2016-2032)
- Table 44: Western Europe Ataxia Market Market Y-o-Y Growth Rate Comparison by By Type (2016-2032)
- Table 45: Western Europe Ataxia Market Market Y-o-Y Growth Rate Comparison by By Product (2016-2032)
- Table 46: Western Europe Ataxia Market Market Y-o-Y Growth Rate Comparison by By Dosage Form (2016-2032)
- Table 47: Western Europe Ataxia Market Market Share Comparison by Country (2016-2032)
- Table 48: Western Europe Ataxia Market Market Share Comparison by By Type (2016-2032)
- Table 49: Western Europe Ataxia Market Market Share Comparison by By Product (2016-2032)
- Table 50: Western Europe Ataxia Market Market Share Comparison by By Dosage Form (2016-2032)
- Table 51: Eastern Europe Ataxia Market Market Comparison by By Type (2016-2032)
- Table 52: Eastern Europe Ataxia Market Market Comparison by By Product (2016-2032)
- Table 53: Eastern Europe Ataxia Market Market Comparison by By Dosage Form (2016-2032)
- Table 54: Eastern Europe Ataxia Market Revenue (US$ Mn) Comparison by Country (2016-2032)
- Table 55: Eastern Europe Ataxia Market Market Revenue (US$ Mn) (2016-2032)
- Table 56: Eastern Europe Ataxia Market Market Revenue (US$ Mn) Comparison by Country (2016-2032)
- Table 57: Eastern Europe Ataxia Market Market Revenue (US$ Mn) Comparison by By Type (2016-2032)
- Table 58: Eastern Europe Ataxia Market Market Revenue (US$ Mn) Comparison by By Product (2016-2032)
- Table 59: Eastern Europe Ataxia Market Market Revenue (US$ Mn) Comparison by By Dosage Form (2016-2032)
- Table 60: Eastern Europe Ataxia Market Market Y-o-Y Growth Rate Comparison by Country (2016-2032)
- Table 61: Eastern Europe Ataxia Market Market Y-o-Y Growth Rate Comparison by By Type (2016-2032)
- Table 62: Eastern Europe Ataxia Market Market Y-o-Y Growth Rate Comparison by By Product (2016-2032)
- Table 63: Eastern Europe Ataxia Market Market Y-o-Y Growth Rate Comparison by By Dosage Form (2016-2032)
- Table 64: Eastern Europe Ataxia Market Market Share Comparison by Country (2016-2032)
- Table 65: Eastern Europe Ataxia Market Market Share Comparison by By Type (2016-2032)
- Table 66: Eastern Europe Ataxia Market Market Share Comparison by By Product (2016-2032)
- Table 67: Eastern Europe Ataxia Market Market Share Comparison by By Dosage Form (2016-2032)
- Table 68: APAC Ataxia Market Market Comparison by By Type (2016-2032)
- Table 69: APAC Ataxia Market Market Comparison by By Product (2016-2032)
- Table 70: APAC Ataxia Market Market Comparison by By Dosage Form (2016-2032)
- Table 71: APAC Ataxia Market Revenue (US$ Mn) Comparison by Country (2016-2032)
- Table 72: APAC Ataxia Market Market Revenue (US$ Mn) (2016-2032)
- Table 73: APAC Ataxia Market Market Revenue (US$ Mn) Comparison by Country (2016-2032)
- Table 74: APAC Ataxia Market Market Revenue (US$ Mn) Comparison by By Type (2016-2032)
- Table 75: APAC Ataxia Market Market Revenue (US$ Mn) Comparison by By Product (2016-2032)
- Table 76: APAC Ataxia Market Market Revenue (US$ Mn) Comparison by By Dosage Form (2016-2032)
- Table 77: APAC Ataxia Market Market Y-o-Y Growth Rate Comparison by Country (2016-2032)
- Table 78: APAC Ataxia Market Market Y-o-Y Growth Rate Comparison by By Type (2016-2032)
- Table 79: APAC Ataxia Market Market Y-o-Y Growth Rate Comparison by By Product (2016-2032)
- Table 80: APAC Ataxia Market Market Y-o-Y Growth Rate Comparison by By Dosage Form (2016-2032)
- Table 81: APAC Ataxia Market Market Share Comparison by Country (2016-2032)
- Table 82: APAC Ataxia Market Market Share Comparison by By Type (2016-2032)
- Table 83: APAC Ataxia Market Market Share Comparison by By Product (2016-2032)
- Table 84: APAC Ataxia Market Market Share Comparison by By Dosage Form (2016-2032)
- Table 85: Latin America Ataxia Market Market Comparison by By Type (2016-2032)
- Table 86: Latin America Ataxia Market Market Comparison by By Product (2016-2032)
- Table 87: Latin America Ataxia Market Market Comparison by By Dosage Form (2016-2032)
- Table 88: Latin America Ataxia Market Revenue (US$ Mn) Comparison by Country (2016-2032)
- Table 89: Latin America Ataxia Market Market Revenue (US$ Mn) (2016-2032)
- Table 90: Latin America Ataxia Market Market Revenue (US$ Mn) Comparison by Country (2016-2032)
- Table 91: Latin America Ataxia Market Market Revenue (US$ Mn) Comparison by By Type (2016-2032)
- Table 92: Latin America Ataxia Market Market Revenue (US$ Mn) Comparison by By Product (2016-2032)
- Table 93: Latin America Ataxia Market Market Revenue (US$ Mn) Comparison by By Dosage Form (2016-2032)
- Table 94: Latin America Ataxia Market Market Y-o-Y Growth Rate Comparison by Country (2016-2032)
- Table 95: Latin America Ataxia Market Market Y-o-Y Growth Rate Comparison by By Type (2016-2032)
- Table 96: Latin America Ataxia Market Market Y-o-Y Growth Rate Comparison by By Product (2016-2032)
- Table 97: Latin America Ataxia Market Market Y-o-Y Growth Rate Comparison by By Dosage Form (2016-2032)
- Table 98: Latin America Ataxia Market Market Share Comparison by Country (2016-2032)
- Table 99: Latin America Ataxia Market Market Share Comparison by By Type (2016-2032)
- Table 100: Latin America Ataxia Market Market Share Comparison by By Product (2016-2032)
- Table 101: Latin America Ataxia Market Market Share Comparison by By Dosage Form (2016-2032)
- Table 102: Middle East & Africa Ataxia Market Market Comparison by By Type (2016-2032)
- Table 103: Middle East & Africa Ataxia Market Market Comparison by By Product (2016-2032)
- Table 104: Middle East & Africa Ataxia Market Market Comparison by By Dosage Form (2016-2032)
- Table 105: Middle East & Africa Ataxia Market Revenue (US$ Mn) Comparison by Country (2016-2032)
- Table 106: Middle East & Africa Ataxia Market Market Revenue (US$ Mn) (2016-2032)
- Table 107: Middle East & Africa Ataxia Market Market Revenue (US$ Mn) Comparison by Country (2016-2032)
- Table 108: Middle East & Africa Ataxia Market Market Revenue (US$ Mn) Comparison by By Type (2016-2032)
- Table 109: Middle East & Africa Ataxia Market Market Revenue (US$ Mn) Comparison by By Product (2016-2032)
- Table 110: Middle East & Africa Ataxia Market Market Revenue (US$ Mn) Comparison by By Dosage Form (2016-2032)
- Table 111: Middle East & Africa Ataxia Market Market Y-o-Y Growth Rate Comparison by Country (2016-2032)
- Table 112: Middle East & Africa Ataxia Market Market Y-o-Y Growth Rate Comparison by By Type (2016-2032)
- Table 113: Middle East & Africa Ataxia Market Market Y-o-Y Growth Rate Comparison by By Product (2016-2032)
- Table 114: Middle East & Africa Ataxia Market Market Y-o-Y Growth Rate Comparison by By Dosage Form (2016-2032)
- Table 115: Middle East & Africa Ataxia Market Market Share Comparison by Country (2016-2032)
- Table 116: Middle East & Africa Ataxia Market Market Share Comparison by By Type (2016-2032)
- Table 117: Middle East & Africa Ataxia Market Market Share Comparison by By Product (2016-2032)
- Table 118: Middle East & Africa Ataxia Market Market Share Comparison by By Dosage Form (2016-2032)
- 1. Executive Summary
-
- Novartis AG
- Merck KgaA
- Aurobindo Pharma
- Pfizer Inc.
- Sanofi
- Teva Pharmaceutical Industries Ltd.
- Acorda Therapeutics, Inc.
- Viatris Inc.
- Sun Pharmaceutical Industries Ltd.
- Lupin
- Amneal Pharmaceuticals LLC
- Apotex Inc.
- Capsida Biotherapeutics, Inc.
- Larimar Therapeutics, Inc.
- Reata Pharmaceuticals, Inc.
- Retrotope Inc.
- Cipla Inc.
- Upstream Rehabilitation Inc.
- Voyager Therapeutics, Inc
- Design Therapeutics Inc.
Our Clients


View Our Licence Options
