
Global Apac Travel Market By Tour (Safari & Adventure, Customized & Private Vacations, Cruises, Yachting & Small Ship Expeditions, Celebration Journeys, Culinary Travel & Shopping, Others), By Age-group(21-30, 31-40, 41-60, 60+), By Country( Asia Pacific(India, Japan, China, Sri Lanka, Indonesia)), By Region And Companies - Industry Segment Outlook, Market Assessment, Competition Scenario, Trends, And Forecast 2024-2033
-
45232
-
April 2024
-
300
-


-
This report was compiled by Research Team Research team of over 50 passionate professionals leverages advanced research methodologies and analytical expertise to deliver insightful, data-driven market intelligence that empowers businesses across diverse industries to make strategic, well-informed Correspondence Research Team Linkedin | Detailed Market research Methodology Our methodology involves a mix of primary research, including interviews with leading mental health experts, and secondary research from reputable medical journals and databases. View Detailed Methodology Page
-
Quick Navigation
Report Overview
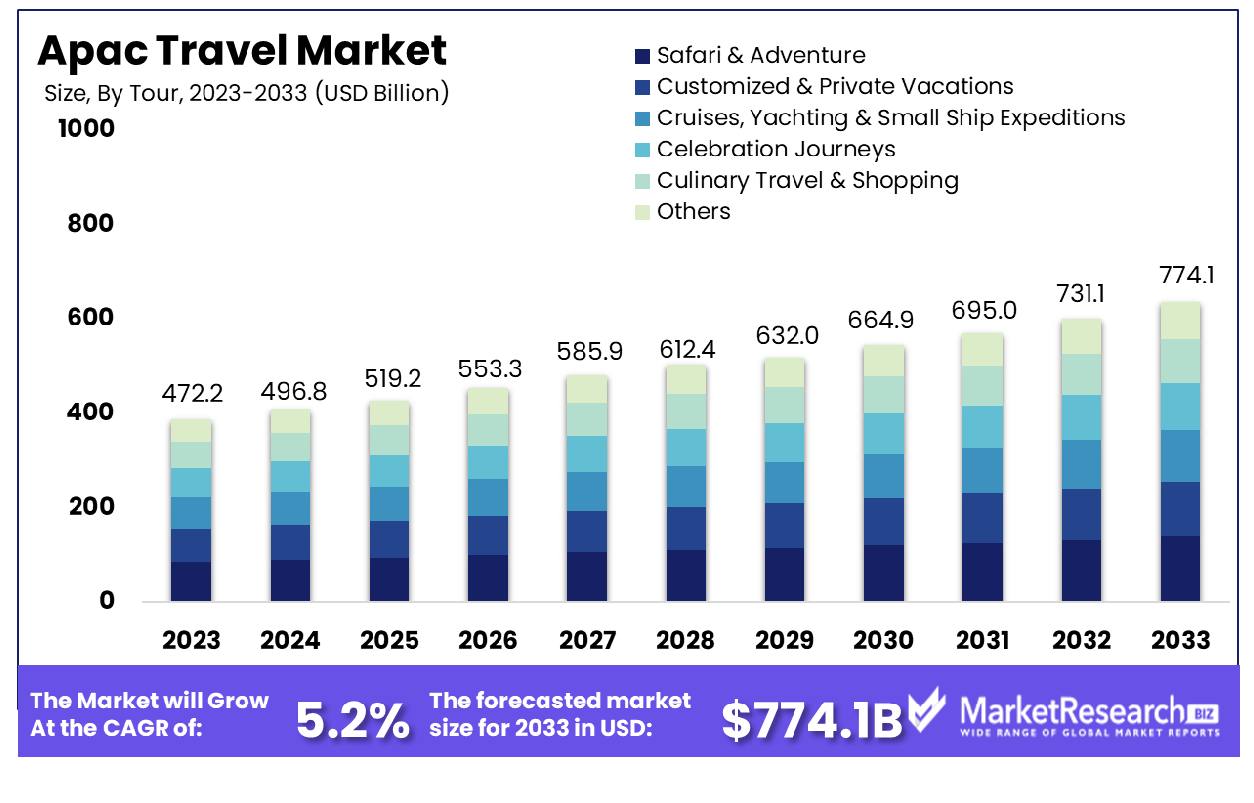
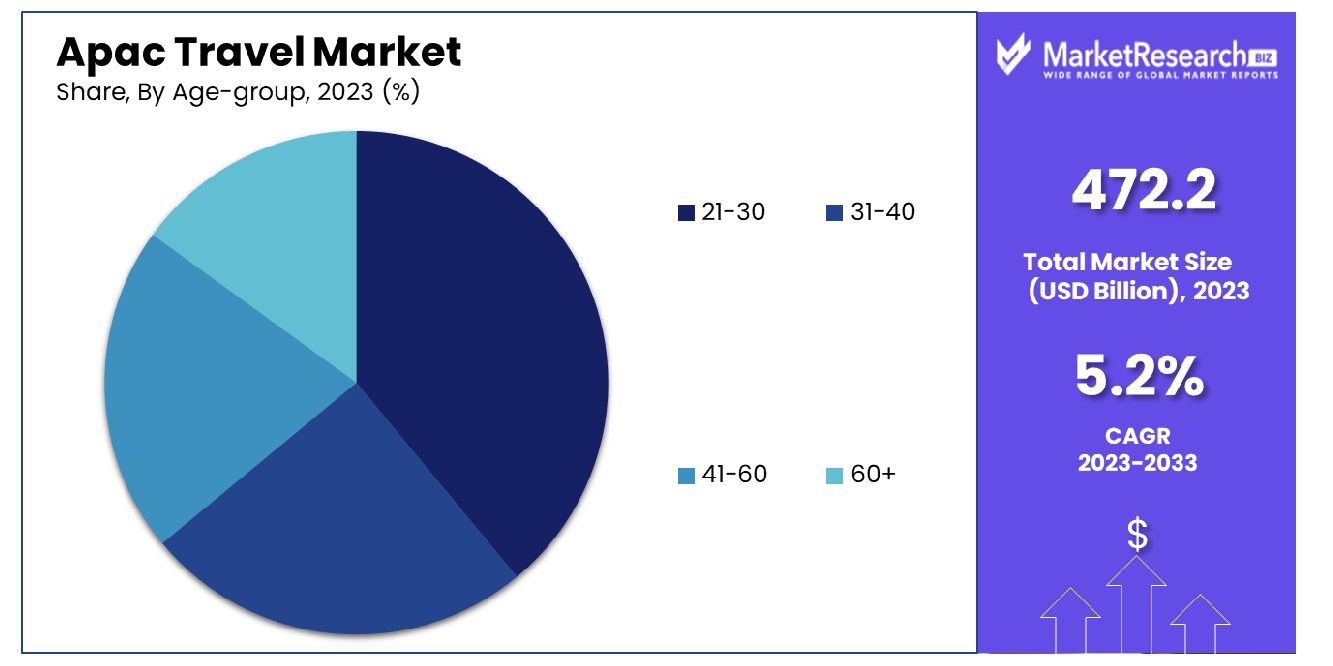
The Global Apac Travel Market was valued at USD 472.2 billion in 2023. It is expected to reach USD 774.1 billion by 2033, with a CAGR of 5.2% during the forecast period from 2024 to 2033.
The Asia-Pacific (APAC) Travel Market encompasses the vast and diverse travel and tourism industry across countries in the Asia-Pacific region. It is characterized by a dynamic blend of domestic and international travel activities, including leisure, business, and cultural tourism. This market is pivotal due to its rapid growth driven by increasing disposable incomes, urbanization, and the expansion of low-cost carriers.
Additionally, technological advancements in travel bookings and a growing middle class contribute significantly to the market's expansion. For stakeholders such as Product Managers, understanding the APAC Travel Market offers critical insights into consumer preferences and emerging opportunities for strategic positioning and investment.
The Asia-Pacific (APAC) travel market is poised for significant growth, reflecting a robust recovery trajectory as international tourism inches closer to pre-pandemic levels. By the end of 2023, international tourism is expected to regain nearly 90% of its volume compared to before the pandemic, a testament to the sector's resilience and the easing of travel restrictions across the region. This rebound is particularly noteworthy in the context of global travel dynamics, where, for instance, international visitor arrivals to the U.S. were still trailing 27% behind 2019 figures as of May 2023.
In 2022, total U.S. outbound travel saw a resurgence to 80.7 million, marking an increase of 64% over 2021 and reaching approximately 81% of the peak of 99.7 million recorded in 2019. This upward trend continued into 2023, with U.S. outbound air travel to overseas countries in the second quarter increasing by 8.9% compared to the same period in 2019. Notably, the top overseas destinations for U.S. travelers included the United Kingdom, France, the Dominican Republic, Italy, and Germany/Spain, highlighting a diverse range of preferences that may influence APAC's market strategies.
The APAC region's travel market can leverage these insights to tailor experiences that align with the evolving preferences of international travelers, particularly from significant outbound markets like the U.S. Enhanced connectivity, strategic marketing campaigns targeting these preferences, and improved tourism infrastructure are pivotal. Additionally, the region's ability to adapt to global travel key trends and maintain stringent safety protocols will further reinforce its position as a leading destination in the post-pandemic travel industry landscape.
Key Takeaways
- Market Growth: The Global Apac Travel Market was valued at USD 472.2 billion in 2023. It is expected to reach USD 774.1 billion by 2033, with a CAGR of 5.2% during the forecast period from 2024 to 2033.
- By Tour: Tour, Safari & Adventure holds a dominant market share of 32.27%.
- By Age-group: The age group of 41-60 commands a significant share at 41.67%.
- By Country: Asia Pacific, specifically China, leads with a commanding 49.6% share.
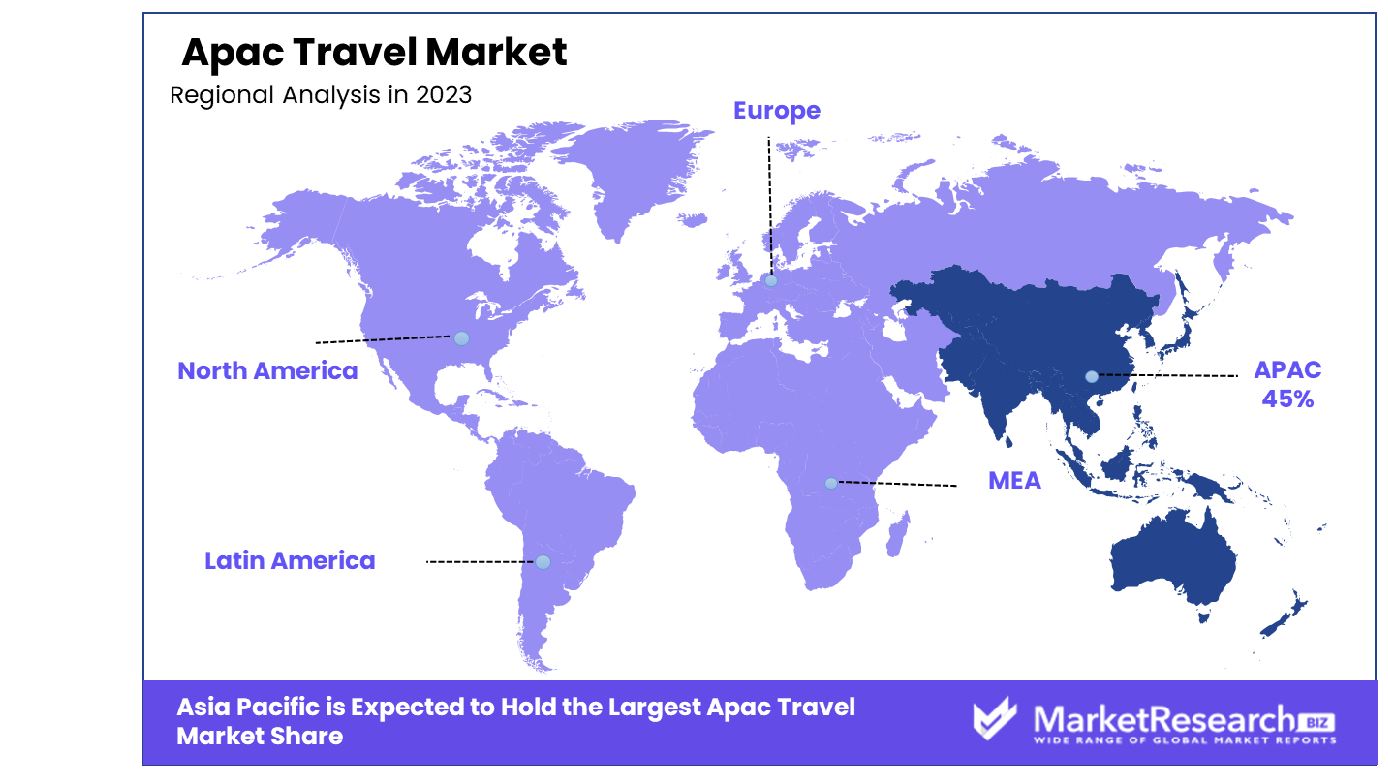
- Regional Dominance: In the Asia Pacific (APAC) travel market, 45% of travelers prioritize sustainable tourism practices.
- Growth Opportunity: The 2023 outlook for the global APAC travel market is optimistic, driven by improved air connectivity and infrastructure in emerging markets, alongside a growing middle-class population with increased disposable income.
Driving factors
Rise in Domestic and International Travelers in Asia Pacific
The Asia Pacific travel market is experiencing robust growth, primarily fueled by the significant increase in both domestic and international travelers. The region's burgeoning middle class, coupled with more accessible and affordable travel options, has significantly broadened the scope for tourism.
Enhanced air connectivity and visa facilitation in key tourist destinations such as China, India, and Southeast Asia continue to attract a larger number of visitors. This surge in travel activity directly contributes to the region's economic vitality, boosting related industries such as hospitality, services, and transportation.
Increased Adoption of Premium Lifestyles and Personal Luxury Goods Investments
The escalating adoption of premium lifestyles among Asia Pacific consumers has a pronounced impact on the travel market. As disposable incomes rise, there is a noticeable shift towards higher spending on travel experiences that include luxury accommodations, exclusive excursions, and gourmet dining.
This trend is particularly evident in the increased investments in personal luxury goods, which parallel the demand for more sophisticated travel options. The integration of luxury experiences with travel services not only diversifies the market offerings but also enhances the overall value of the travel and tourism sector in the region.
High Revenue Generation from Airport Retailing
Airport retailing has emerged as a significant economic contributor within the Asia Pacific travel market. As international and domestic travel volumes increase, airports have become pivotal hubs for retail activity. This is especially true in countries with thriving tourist industries, where airports often serve as the first point of contact for travelers.
The expansion of retail spaces in airports, offering everything from high-end luxury goods to local souvenirs, taps into the increased passenger flow, generating substantial revenue. This retail ecosystem not only boosts the local economy but also enhances the traveler's experience, often influencing their spending behavior and perceptions of the travel destination.
Restraining Factors
Regulatory Challenges Impacting Market Growth
Regulatory hurdles represent a significant constraint on the growth of the Asia Pacific travel market. Strict visa policies, environmental regulations, and varied travel advisories across different countries can impede the seamless flow of international tourists. These regulations often result in increased operational costs for travel and tourism businesses, which may be passed on to the consumer, potentially reducing the attractiveness of a destination.
Moreover, compliance with these diverse and sometimes stringent regulations requires substantial resources, which can particularly burden small and medium-sized enterprises. The overall effect is a dampening of growth momentum in the travel sector, as potential travelers may seek less restrictive destinations.
Presence of Substitutes Affecting Market Dynamics
The presence of substitutes in the travel industry also significantly influences market dynamics in the Asia Pacific region. With the rise of virtual tourism and local recreational activities, potential travelers have alternative ways to spend their leisure time and money, which may deter travel to conventional tourist destinations.
Technological advancements such as virtual reality experiences offer a taste of travel without the associated costs or hassles, appealing to a segment of the market that prioritizes convenience and budget. This competition not only affects the volume of travelers but also forces travel-related businesses to innovate and offer more compelling, value-added services to attract tourists.
By Tour Analysis
The tour, Safari & Adventure market segment holds a dominant share at 32.27% globally.
In 2023, Safari & Adventure held a dominant market position in the By Tour segment of the APAC Travel Market, capturing more than a 32.27% share. This remarkable achievement underscores the brand's adeptness in catering to the diverse preferences of travelers within the region. Safari & Adventure specializes in offering Customized & Private Vacations, elevating the travel experience by tailoring itineraries to individual preferences and providing personalized service throughout the journey.
Moreover, Safari & Adventure distinguishes itself by curating exceptional Cruises, Yachting & Small Ship Expeditions, offering travelers the opportunity to explore exotic destinations from the comfort of luxurious vessels. This unique offering appeals to discerning travelers seeking unparalleled experiences amidst stunning natural landscapes.
Additionally, Safari & Adventure has gained prominence for its Celebration Journeys, providing bespoke travel solutions for special occasions such as weddings, anniversaries, and milestone birthdays. By orchestrating unforgettable celebrations in captivating locales, the brand has carved a niche in the market for premium celebratory travel experiences.
Furthermore, Safari & Adventure's expertise extends to Culinary Travel & Shopping, where travelers indulge in culinary delights and exclusive shopping experiences curated by expert guides. This immersive approach to travel resonates with travelers seeking authentic cultural experiences and gastronomic adventures.
By Age-group Analysis
Among age groups, the 41-60 demographic commands a substantial 41.67% share.
In 2023, Safari & Adventure held a dominant market position in the By Age-group segment of the APAC Travel Market, capturing more than a 41.67% share. This significant market share highlights the brand's effectiveness in catering to the diverse needs and preferences of travelers across different age groups within the region.
Among travelers aged 21-30, Safari & Adventure emerged as the preferred choice, offering dynamic and experiential travel options that resonate with the adventurous spirit of young adults. By curating exciting itineraries and incorporating unique activities, the brand appeals to this demographic's desire for exploration and discovery.
In the 31-40 age group, Safari & Adventure's market dominance is underscored by its ability to provide tailored travel experiences that balance adventure with comfort and luxury. With offerings such as Customized & Private Vacations and Cruises, Yachting & Small Ship Expeditions, the brand caters to the evolving preferences of travelers in this age bracket.
Within the 41-60 age group, Safari & Adventure's expertise in Celebration Journeys Culinary Travel & Shopping resonates strongly with travelers seeking memorable experiences and cultural immersion. By delivering curated travel solutions that cater to diverse interests and preferences, the brand solidifies its position as a market leader in this segment.
Moreover, Safari & Adventure's appeal extends to travelers aged 60 and above, who value comfort, convenience, and enriching experiences. With a focus on providing exceptional service and memorable encounters, the brand ensures that every journey exceeds expectations for this discerning demographic.
By Country Analysis
In the Asia Pacific region, China leads with an impressive market dominance of 49.6%.
In 2023, Asia Pacific (China) held a dominant market position in the By Country segment of the APAC Travel Market, capturing more than a 49.6% share. This commanding share reaffirms China's status as a powerhouse within the region's travel industry, driven by its vast tourism offerings, robust infrastructure, and expanding outbound tourism market.
Among the countries contributing to the market share within the By Country segment, China stands out as the frontrunner. Boasting a rich cultural heritage, diverse landscapes, and modern attractions, China attracts a significant influx of domestic and international travelers alike, contributing substantially to the overall market share.
India, another key player in the APAC region, follows closely behind China in terms of market share. With its vibrant culture, historical landmarks, and diverse landscapes, India continues to entice travelers seeking immersive experiences and spiritual journeys, thereby solidifying its position as a top destination within the region.
Japan, renowned for its blend of tradition and innovation, holds a considerable share of the market, drawing travelers with its unique cultural experiences, technological advancements, and natural beauty. The country's efficient transportation system and hospitality infrastructure further contribute to its attractiveness as a preferred travel destination.
Sri Lanka and Indonesia also make significant contributions to the By Country segment, with their stunning landscapes, pristine beaches, and rich cultural heritage attracting a steady stream of tourists seeking tropical escapes and immersive cultural experiences.
As Asia Pacific (China) maintains its dominant market position within the Country segment of the APAC Travel Market, the collective contributions of countries such as India, Japan, Sri Lanka, and Indonesia underscore the region's diversity and appeal, driving sustained growth and innovation in the travel industry.
Key Market Segments
By Tour
- Safari & Adventure
- Customized & Private Vacations
- Cruises, Yachting & Small Ship Expeditions
- Celebration Journeys
- Culinary Travel & Shopping
- Others
By Age-group
- 21-30
- 31-40
- 41-60
- 60+
By Country
- Asia Pacific
- India
- Japan
- China
- Sri Lanka
- Indonesia
Growth Opportunity
Improved Air Connectivity and Infrastructure Development in Emerging Markets
The year 2023 heralds a promising era for the global APAC travel market, primarily propelled by enhanced air connectivity and infrastructure advancements across emerging markets within the region. Improved transportation networks, including airports and highways, facilitate smoother travel experiences for both domestic and international tourists.
This infrastructure development fosters accessibility to remote destinations, thereby expanding the tourism footprint beyond traditional hotspots. The growth of low-cost carriers further democratizes air travel, making it more affordable and accessible to a wider demographic.
Growing Middle-Class Population and Rising Disposable Income in APAC
The burgeoning middle-class population and escalating disposable income levels across APAC represent significant drivers for the travel industry's growth in 2023. As more individuals ascend into the middle-income bracket, discretionary spending on leisure activities, including travel, witnesses an uptick. This demographic shift fuels the demand for diverse travel experiences, ranging from luxury getaways to budget-friendly excursions.
Moreover, changing lifestyles and an increasing preference for experiential consumption propel the demand for travel-related services such as accommodations, dining, and entertainment. Market players are thus presented with an opportune moment to cater to the evolving preferences of this burgeoning consumer segment through tailored offerings and personalized experiences.
Latest Trends
Adoption of Contactless Travel Technologies
In 2023, the global APAC travel market is witnessing a notable trend towards the widespread adoption of contactless travel technologies. Accelerated by the COVID-19 pandemic, travelers are increasingly prioritizing safety and hygiene throughout their journey. Contactless technologies, including mobile check-ins, digital payments, and biometric authentication, streamline the travel experience while minimizing physical contact.
This trend not only enhances operational efficiency for travel providers but also fosters a sense of security and reassurance among travelers, driving higher confidence in travel activities. As such, industry players are actively integrating contactless solutions into their offerings to meet the evolving expectations of travelers and remain competitive in the market.
Focus on Rural and Nature-based Tourism
Another prominent trend shaping the 2023 landscape of the global APAC travel market is the heightened focus on rural and nature-based tourism experiences. In response to growing concerns over tourism and environmental sustainability, travelers are seeking out immersive and authentic experiences in less-explored destinations, including rural areas and natural landscapes. This shift reflects a broader desire for meaningful connections with nature, cultural immersion, and sustainable travel practices.
Consequently, tourism stakeholders are diversifying their offerings to include eco-friendly accommodations, guided nature tours, and community-based initiatives that promote responsible travel and support local economies. By aligning with this trend, businesses can tap into emerging market segments, differentiate their offerings, and contribute to the preservation of natural and cultural heritage sites across the APAC region.
Regional Analysis
The APAC travel market in Asia Pacific is projected to grow by 45% next year.
North America: Renowned for its diverse landscapes and cultural attractions, North America boasts a robust travel market. With an estimated market share of 20%, the region benefits from a well-developed tourism infrastructure and a high standard of living, attracting both domestic and international travelers. Major destinations such as the United States and Canada offer a plethora of experiences, from vibrant urban cities to breathtaking natural wonders, catering to a wide range of traveler preferences.
Europe: As a perennial favorite among tourists, Europe holds a significant share of approximately 25% of the global travel market. Rich in history, art, and architecture, European countries allure travelers with iconic landmarks, picturesque landscapes, and a vibrant cultural tapestry. The region's extensive transportation network, including high-speed rail and budget airlines, facilitates seamless travel between countries, contributing to its popularity as a top travel destination worldwide.
Asia Pacific (Dominating Region - 45%): Emerging as a dominant force in the global travel market, the Asia Pacific market commands a substantial share of 45%. Boasting diverse landscapes, ancient traditions, and modern metropolises, the region offers unparalleled experiences for travelers. Rapid economic growth, coupled with increasing disposable incomes, fuels the demand for leisure travel among the burgeoning middle-class population. Destinations such as Thailand, Japan, and China attract millions of visitors annually, showcasing the region's immense tourism potential.
Middle East & Africa: With a share of approximately 10%, the Middle East & Africa region offers unique cultural experiences, from the ancient wonders of Egypt to the futuristic skyline of Dubai. While the region faces challenges related to political instability and security concerns, strategic investments in tourism infrastructure and promotional efforts contribute to its steady growth in the global travel market.
Latin America: Latin America accounts for around 15% of the global travel market, characterized by its rich biodiversity, vibrant culture, and historic heritage sites. Countries like Mexico, Brazil, and Costa Rica draw travelers with their stunning beaches, lush rainforests, and archaeological wonders. Despite facing economic fluctuations and infrastructure challenges, the region showcases resilience and potential for growth in the travel industry.
Key Regions and Countries
North America
- The US
- Canada
- Rest of North America
Europe
- Germany
- France
- The UK
- Spain
- Netherlands
- Russia
- Italy
- Rest of Europe
Asia-Pacific
- China
- Japan
- Singapore
- Thailand
- South Korea
- Vietnam
- India
- New Zealand
- Rest of Asia Pacific
Latin America
- Mexico
- Brazil
- Rest of Latin America
Middle East & Africa
- Saudi Arabia
- South Africa
- UAE
- Rest of Middle East & Africa
Key Players Analysis
In 2023, the global Asia-Pacific (APAC) travel market witnessed a dynamic interplay of key players, each contributing to the sector's evolution and adaptation to changing consumer preferences and market dynamics. Among these, several standout companies have played pivotal roles in shaping the landscape of travel and tourism across the APAC region.
TUI Group, a prominent player renowned for its comprehensive travel offerings and robust presence in multiple markets, continued to assert its influence in the APAC travel sector. Leveraging its expansive network and diverse portfolio, TUI Group remained at the forefront of delivering tailored travel experiences to a discerning clientele.
Lindblad Expeditions Holdings, Inc., distinguished itself through its commitment to sustainable and immersive travel experiences. As eco-consciousness increasingly guides consumer choices, Lindblad's emphasis on responsible tourism resonated strongly within the APAC market, attracting environmentally-conscious travelers seeking authentic encounters with nature.
Thomas Cook (India) Limited, backed by Fairfax Financial Holdings Limited, fortified its position as a leading player in the APAC travel arena. With a legacy of excellence and a comprehensive suite of services, Thomas Cook continued to cater to the diverse needs of travelers, offering unparalleled convenience and reliability.
Additionally, companies such as Scott Dunn, Abercrombie & Kent USA, LLC, Exodus Travels Limited, Travel Edge, Inc. (Navigatr Group), Butterfield & Robinson, Inc., and Geographic Expeditions, Inc., along with Micato Safaris, each brought distinctive strengths and offerings to the APAC travel market, contributing to its vibrancy and diversity.
Market Key Players
- TUI Group
- Lindblad Expeditions Holdings, Inc.
- Thomas Cook (India) Limited (Fairfax Financial Holdings Limited)
- Scott Dunn
- Abercrombie & Kent USA, LLC
- Exodus Travels Limited
- Travel Edge, Inc. (Navigatr Group)
- Butterfield & Robinson, Inc.
- Geographic Expeditions, Inc.
- Micato Safaris
Recent Development
- In April 2024, Arabian Travel Market (ATM) 2024 convenes global leaders to explore entrepreneurship and innovation in tourism. Largest edition yet, with 23% more exhibitors, focusing on sustainability, technology, and market growth.
- In April 2024, Business Travel Show Europe celebrates 30 years, revealing OBTs and the internet as top innovations. The pandemic, climate change, and geopolitical unrest ranked most concerning. Promotes innovation for future travel management.
- In February 2024, Ryanair's reconciliation with OTAs reshapes industry views. AI is poised to transform travel; cybersecurity concerns arise. Economic challenges persist; Thomas Cook's decline contrasts with MakeMyTrip's success. Data security was vital for smart tourism. Strategic alliances and tech investments are crucial for sector resilience.
Report Scope
Report Features Description Market Value (2023) USD 472.2 Billion Forecast Revenue (2033) USD 774.1 Billion CAGR (2024-2032) 5.2% Base Year for Estimation 2023 Historic Period 2016-2023 Forecast Period 2024-2033 Report Coverage Revenue Forecast, Market Dynamics, COVID-19 Impact, Competitive Landscape, Recent Developments Segments Covered By Tour (Safari & Adventure, Customized & Private Vacations, Cruises, Yachting & Small Ship Expeditions, Celebration Journeys, Culinary Travel & Shopping, Others), By Age-group(21-30, 31-40, 41-60, 60+), By Country( Asia Pacific(India, Japan, China, Sri Lanka, Indonesia)) Regional Analysis North America - The US, Canada, Rest of North America, Europe - Germany, France, The UK, Spain, Italy, Russia, Netherlands, Rest of Europe, Asia-Pacific - China, Japan, South Korea, India, New Zealand, Singapore, Thailand, Vietnam, Rest of Asia Pacific, Latin America - Brazil, Mexico, Rest of Latin America, Middle East & Africa - South Africa, Saudi Arabia, UAE, Rest of Middle East & Africa Competitive Landscape TUI Group, Lindblad Expeditions Holdings, Inc., Thomas Cook (India) Limited (Fairfax Financial Holdings Limited), Scott Dunn, Abercrombie & Kent USA, LLC, Exodus Travels Limited, Travel Edge, Inc. (Navigatr Group), Butterfield & Robinson, Inc., Geographic Expeditions, Inc., Micato Safaris Customization Scope Customization for segments, region/country-level will be provided. Moreover, additional customization can be done based on the requirements. Purchase Options We have three licenses to opt for Single User License, Multi-User License (Up to 5 Users), Corporate Use License (Unlimited User and Printable PDF) -
- 1. Executive Summary
- 1.1. Definition
- 1.2. Taxonomy
- 1.3. Research Scope
- 1.4. Key Analysis
- 1.5. Key Findings by Major Segments
- 1.6. Top strategies by Major Players
- 2. Global Apac Travel Market Overview
- 2.1. Apac Travel Market Dynamics
- 2.1.1. Drivers
- 2.1.2. Opportunities
- 2.1.3. Restraints
- 2.1.4. Challenges
- 2.2. Macro-economic Factors
- 2.3. Regulatory Framework
- 2.4. Market Investment Feasibility Index
- 2.5. PEST Analysis
- 2.6. PORTER’S Five Force Analysis
- 2.7. Drivers & Restraints Impact Analysis
- 2.8. Industry Chain Analysis
- 2.9. Cost Structure Analysis
- 2.10. Marketing Strategy
- 2.11. Russia-Ukraine War Impact Analysis
- 2.12. Opportunity Map Analysis
- 2.13. Market Competition Scenario Analysis
- 2.14. Product Life Cycle Analysis
- 2.15. Opportunity Orbits
- 2.16. Manufacturer Intensity Map
- 2.17. Major Companies sales by Value & Volume
- 2.1. Apac Travel Market Dynamics
- 3. Global Apac Travel Market Analysis, Opportunity and Forecast, 2016-2032
- 3.1. Global Apac Travel Market Analysis, 2016-2021
- 3.2. Global Apac Travel Market Opportunity and Forecast, 2023-2032
- 3.3. Global Apac Travel Market Analysis, Opportunity and Forecast, By By Tour, 2016-2032
- 3.3.1. Global Apac Travel Market Analysis by By Tour: Introduction
- 3.3.2. Market Size Absolute $ Opportunity Analysis and Forecast, By By Tour, 2016-2032
- 3.3.3. Safari & Adventure
- 3.3.4. Customized & Private Vacations
- 3.3.5. Cruises, Yachting & Small Ship Expeditions
- 3.3.6. Celebration Journeys
- 3.3.7. Culinary Travel & Shopping
- 3.3.8. Others
- 3.4. Global Apac Travel Market Analysis, Opportunity and Forecast, By By Age-group , 2016-2032
- 3.4.1. Global Apac Travel Market Analysis by By Age-group : Introduction
- 3.4.2. Market Size Absolute $ Opportunity Analysis and Forecast, By By Age-group , 2016-2032
- 3.4.3. 21-30
- 3.4.4. 31-40
- 3.4.5. 41-60
- 3.4.6. 60+
- 3.5. Global Apac Travel Market Analysis, Opportunity and Forecast, By By Country, 2016-2032
- 3.5.1. Global Apac Travel Market Analysis by By Country: Introduction
- 3.5.2. Market Size Absolute $ Opportunity Analysis and Forecast, By By Country, 2016-2032
- 3.5.3. Asia Pacific
- 3.5.3.1. India
- 3.5.3.2. Japan
- 3.5.3.3. China
- 3.5.3.4. Sri Lanka
- 3.5.3.5. Indonesia
- 4. North America Apac Travel Market Analysis, Opportunity and Forecast, 2016-2032
- 4.1. North America Apac Travel Market Analysis, 2016-2021
- 4.2. North America Apac Travel Market Opportunity and Forecast, 2023-2032
- 4.3. North America Apac Travel Market Analysis, Opportunity and Forecast, By By Tour, 2016-2032
- 4.3.1. North America Apac Travel Market Analysis by By Tour: Introduction
- 4.3.2. Market Size Absolute $ Opportunity Analysis and Forecast, By By Tour, 2016-2032
- 4.3.3. Safari & Adventure
- 4.3.4. Customized & Private Vacations
- 4.3.5. Cruises, Yachting & Small Ship Expeditions
- 4.3.6. Celebration Journeys
- 4.3.7. Culinary Travel & Shopping
- 4.3.8. Others
- 4.4. North America Apac Travel Market Analysis, Opportunity and Forecast, By By Age-group , 2016-2032
- 4.4.1. North America Apac Travel Market Analysis by By Age-group : Introduction
- 4.4.2. Market Size Absolute $ Opportunity Analysis and Forecast, By By Age-group , 2016-2032
- 4.4.3. 21-30
- 4.4.4. 31-40
- 4.4.5. 41-60
- 4.4.6. 60+
- 4.5. North America Apac Travel Market Analysis, Opportunity and Forecast, By By Country, 2016-2032
- 4.5.1. North America Apac Travel Market Analysis by By Country: Introduction
- 4.5.2. Market Size Absolute $ Opportunity Analysis and Forecast, By By Country, 2016-2032
- 4.5.3. Asia Pacific
- 4.5.3.1. India
- 4.5.3.2. Japan
- 4.5.3.3. China
- 4.5.3.4. Sri Lanka
- 4.5.3.5. Indonesia
- 4.6. North America Apac Travel Market Analysis, Opportunity and Forecast, By Country , 2016-2032
- 4.6.1. North America Apac Travel Market Analysis by Country : Introduction
- 4.6.2. Market Size Absolute $ Opportunity Analysis and Forecast, Country , 2016-2032
- 4.6.2.1. The US
- 4.6.2.2. Canada
- 4.6.2.3. Mexico
- 5. Western Europe Apac Travel Market Analysis, Opportunity and Forecast, 2016-2032
- 5.1. Western Europe Apac Travel Market Analysis, 2016-2021
- 5.2. Western Europe Apac Travel Market Opportunity and Forecast, 2023-2032
- 5.3. Western Europe Apac Travel Market Analysis, Opportunity and Forecast, By By Tour, 2016-2032
- 5.3.1. Western Europe Apac Travel Market Analysis by By Tour: Introduction
- 5.3.2. Market Size Absolute $ Opportunity Analysis and Forecast, By By Tour, 2016-2032
- 5.3.3. Safari & Adventure
- 5.3.4. Customized & Private Vacations
- 5.3.5. Cruises, Yachting & Small Ship Expeditions
- 5.3.6. Celebration Journeys
- 5.3.7. Culinary Travel & Shopping
- 5.3.8. Others
- 5.4. Western Europe Apac Travel Market Analysis, Opportunity and Forecast, By By Age-group , 2016-2032
- 5.4.1. Western Europe Apac Travel Market Analysis by By Age-group : Introduction
- 5.4.2. Market Size Absolute $ Opportunity Analysis and Forecast, By By Age-group , 2016-2032
- 5.4.3. 21-30
- 5.4.4. 31-40
- 5.4.5. 41-60
- 5.4.6. 60+
- 5.5. Western Europe Apac Travel Market Analysis, Opportunity and Forecast, By By Country, 2016-2032
- 5.5.1. Western Europe Apac Travel Market Analysis by By Country: Introduction
- 5.5.2. Market Size Absolute $ Opportunity Analysis and Forecast, By By Country, 2016-2032
- 5.5.3. Asia Pacific
- 5.5.3.1. India
- 5.5.3.2. Japan
- 5.5.3.3. China
- 5.5.3.4. Sri Lanka
- 5.5.3.5. Indonesia
- 5.6. Western Europe Apac Travel Market Analysis, Opportunity and Forecast, By Country , 2016-2032
- 5.6.1. Western Europe Apac Travel Market Analysis by Country : Introduction
- 5.6.2. Market Size Absolute $ Opportunity Analysis and Forecast, Country , 2016-2032
- 5.6.2.1. Germany
- 5.6.2.2. France
- 5.6.2.3. The UK
- 5.6.2.4. Spain
- 5.6.2.5. Italy
- 5.6.2.6. Portugal
- 5.6.2.7. Ireland
- 5.6.2.8. Austria
- 5.6.2.9. Switzerland
- 5.6.2.10. Benelux
- 5.6.2.11. Nordic
- 5.6.2.12. Rest of Western Europe
- 6. Eastern Europe Apac Travel Market Analysis, Opportunity and Forecast, 2016-2032
- 6.1. Eastern Europe Apac Travel Market Analysis, 2016-2021
- 6.2. Eastern Europe Apac Travel Market Opportunity and Forecast, 2023-2032
- 6.3. Eastern Europe Apac Travel Market Analysis, Opportunity and Forecast, By By Tour, 2016-2032
- 6.3.1. Eastern Europe Apac Travel Market Analysis by By Tour: Introduction
- 6.3.2. Market Size Absolute $ Opportunity Analysis and Forecast, By By Tour, 2016-2032
- 6.3.3. Safari & Adventure
- 6.3.4. Customized & Private Vacations
- 6.3.5. Cruises, Yachting & Small Ship Expeditions
- 6.3.6. Celebration Journeys
- 6.3.7. Culinary Travel & Shopping
- 6.3.8. Others
- 6.4. Eastern Europe Apac Travel Market Analysis, Opportunity and Forecast, By By Age-group , 2016-2032
- 6.4.1. Eastern Europe Apac Travel Market Analysis by By Age-group : Introduction
- 6.4.2. Market Size Absolute $ Opportunity Analysis and Forecast, By By Age-group , 2016-2032
- 6.4.3. 21-30
- 6.4.4. 31-40
- 6.4.5. 41-60
- 6.4.6. 60+
- 6.5. Eastern Europe Apac Travel Market Analysis, Opportunity and Forecast, By By Country, 2016-2032
- 6.5.1. Eastern Europe Apac Travel Market Analysis by By Country: Introduction
- 6.5.2. Market Size Absolute $ Opportunity Analysis and Forecast, By By Country, 2016-2032
- 6.5.3. Asia Pacific
- 6.5.3.1. India
- 6.5.3.2. Japan
- 6.5.3.3. China
- 6.5.3.4. Sri Lanka
- 6.5.3.5. Indonesia
- 6.6. Eastern Europe Apac Travel Market Analysis, Opportunity and Forecast, By Country , 2016-2032
- 6.6.1. Eastern Europe Apac Travel Market Analysis by Country : Introduction
- 6.6.2. Market Size Absolute $ Opportunity Analysis and Forecast, Country , 2016-2032
- 6.6.2.1. Russia
- 6.6.2.2. Poland
- 6.6.2.3. The Czech Republic
- 6.6.2.4. Greece
- 6.6.2.5. Rest of Eastern Europe
- 7. APAC Apac Travel Market Analysis, Opportunity and Forecast, 2016-2032
- 7.1. APAC Apac Travel Market Analysis, 2016-2021
- 7.2. APAC Apac Travel Market Opportunity and Forecast, 2023-2032
- 7.3. APAC Apac Travel Market Analysis, Opportunity and Forecast, By By Tour, 2016-2032
- 7.3.1. APAC Apac Travel Market Analysis by By Tour: Introduction
- 7.3.2. Market Size Absolute $ Opportunity Analysis and Forecast, By By Tour, 2016-2032
- 7.3.3. Safari & Adventure
- 7.3.4. Customized & Private Vacations
- 7.3.5. Cruises, Yachting & Small Ship Expeditions
- 7.3.6. Celebration Journeys
- 7.3.7. Culinary Travel & Shopping
- 7.3.8. Others
- 7.4. APAC Apac Travel Market Analysis, Opportunity and Forecast, By By Age-group , 2016-2032
- 7.4.1. APAC Apac Travel Market Analysis by By Age-group : Introduction
- 7.4.2. Market Size Absolute $ Opportunity Analysis and Forecast, By By Age-group , 2016-2032
- 7.4.3. 21-30
- 7.4.4. 31-40
- 7.4.5. 41-60
- 7.4.6. 60+
- 7.5. APAC Apac Travel Market Analysis, Opportunity and Forecast, By By Country, 2016-2032
- 7.5.1. APAC Apac Travel Market Analysis by By Country: Introduction
- 7.5.2. Market Size Absolute $ Opportunity Analysis and Forecast, By By Country, 2016-2032
- 7.5.3. Asia Pacific
- 7.5.3.1. India
- 7.5.3.2. Japan
- 7.5.3.3. China
- 7.5.3.4. Sri Lanka
- 7.5.3.5. Indonesia
- 7.6. APAC Apac Travel Market Analysis, Opportunity and Forecast, By Country , 2016-2032
- 7.6.1. APAC Apac Travel Market Analysis by Country : Introduction
- 7.6.2. Market Size Absolute $ Opportunity Analysis and Forecast, Country , 2016-2032
- 7.6.2.1. China
- 7.6.2.2. Japan
- 7.6.2.3. South Korea
- 7.6.2.4. India
- 7.6.2.5. Australia & New Zeland
- 7.6.2.6. Indonesia
- 7.6.2.7. Malaysia
- 7.6.2.8. Philippines
- 7.6.2.9. Singapore
- 7.6.2.10. Thailand
- 7.6.2.11. Vietnam
- 7.6.2.12. Rest of APAC
- 8. Latin America Apac Travel Market Analysis, Opportunity and Forecast, 2016-2032
- 8.1. Latin America Apac Travel Market Analysis, 2016-2021
- 8.2. Latin America Apac Travel Market Opportunity and Forecast, 2023-2032
- 8.3. Latin America Apac Travel Market Analysis, Opportunity and Forecast, By By Tour, 2016-2032
- 8.3.1. Latin America Apac Travel Market Analysis by By Tour: Introduction
- 8.3.2. Market Size Absolute $ Opportunity Analysis and Forecast, By By Tour, 2016-2032
- 8.3.3. Safari & Adventure
- 8.3.4. Customized & Private Vacations
- 8.3.5. Cruises, Yachting & Small Ship Expeditions
- 8.3.6. Celebration Journeys
- 8.3.7. Culinary Travel & Shopping
- 8.3.8. Others
- 8.4. Latin America Apac Travel Market Analysis, Opportunity and Forecast, By By Age-group , 2016-2032
- 8.4.1. Latin America Apac Travel Market Analysis by By Age-group : Introduction
- 8.4.2. Market Size Absolute $ Opportunity Analysis and Forecast, By By Age-group , 2016-2032
- 8.4.3. 21-30
- 8.4.4. 31-40
- 8.4.5. 41-60
- 8.4.6. 60+
- 8.5. Latin America Apac Travel Market Analysis, Opportunity and Forecast, By By Country, 2016-2032
- 8.5.1. Latin America Apac Travel Market Analysis by By Country: Introduction
- 8.5.2. Market Size Absolute $ Opportunity Analysis and Forecast, By By Country, 2016-2032
- 8.5.3. Asia Pacific
- 8.5.3.1. India
- 8.5.3.2. Japan
- 8.5.3.3. China
- 8.5.3.4. Sri Lanka
- 8.5.3.5. Indonesia
- 8.6. Latin America Apac Travel Market Analysis, Opportunity and Forecast, By Country , 2016-2032
- 8.6.1. Latin America Apac Travel Market Analysis by Country : Introduction
- 8.6.2. Market Size Absolute $ Opportunity Analysis and Forecast, Country , 2016-2032
- 8.6.2.1. Brazil
- 8.6.2.2. Colombia
- 8.6.2.3. Chile
- 8.6.2.4. Argentina
- 8.6.2.5. Costa Rica
- 8.6.2.6. Rest of Latin America
- 9. Middle East & Africa Apac Travel Market Analysis, Opportunity and Forecast, 2016-2032
- 9.1. Middle East & Africa Apac Travel Market Analysis, 2016-2021
- 9.2. Middle East & Africa Apac Travel Market Opportunity and Forecast, 2023-2032
- 9.3. Middle East & Africa Apac Travel Market Analysis, Opportunity and Forecast, By By Tour, 2016-2032
- 9.3.1. Middle East & Africa Apac Travel Market Analysis by By Tour: Introduction
- 9.3.2. Market Size Absolute $ Opportunity Analysis and Forecast, By By Tour, 2016-2032
- 9.3.3. Safari & Adventure
- 9.3.4. Customized & Private Vacations
- 9.3.5. Cruises, Yachting & Small Ship Expeditions
- 9.3.6. Celebration Journeys
- 9.3.7. Culinary Travel & Shopping
- 9.3.8. Others
- 9.4. Middle East & Africa Apac Travel Market Analysis, Opportunity and Forecast, By By Age-group , 2016-2032
- 9.4.1. Middle East & Africa Apac Travel Market Analysis by By Age-group : Introduction
- 9.4.2. Market Size Absolute $ Opportunity Analysis and Forecast, By By Age-group , 2016-2032
- 9.4.3. 21-30
- 9.4.4. 31-40
- 9.4.5. 41-60
- 9.4.6. 60+
- 9.5. Middle East & Africa Apac Travel Market Analysis, Opportunity and Forecast, By By Country, 2016-2032
- 9.5.1. Middle East & Africa Apac Travel Market Analysis by By Country: Introduction
- 9.5.2. Market Size Absolute $ Opportunity Analysis and Forecast, By By Country, 2016-2032
- 9.5.3. Asia Pacific
- 9.5.3.1. India
- 9.5.3.2. Japan
- 9.5.3.3. China
- 9.5.3.4. Sri Lanka
- 9.5.3.5. Indonesia
- 9.6. Middle East & Africa Apac Travel Market Analysis, Opportunity and Forecast, By Country , 2016-2032
- 9.6.1. Middle East & Africa Apac Travel Market Analysis by Country : Introduction
- 9.6.2. Market Size Absolute $ Opportunity Analysis and Forecast, Country , 2016-2032
- 9.6.2.1. Algeria
- 9.6.2.2. Egypt
- 9.6.2.3. Israel
- 9.6.2.4. Kuwait
- 9.6.2.5. Nigeria
- 9.6.2.6. Saudi Arabia
- 9.6.2.7. South Africa
- 9.6.2.8. Turkey
- 9.6.2.9. The UAE
- 9.6.2.10. Rest of MEA
- 10. Global Apac Travel Market Analysis, Opportunity and Forecast, By Region , 2016-2032
- 10.1. Global Apac Travel Market Analysis by Region : Introduction
- 10.2. Market Size Absolute $ Opportunity Analysis and Forecast, By Region , 2016-2032
- 10.2.1. North America
- 10.2.2. Western Europe
- 10.2.3. Eastern Europe
- 10.2.4. APAC
- 10.2.5. Latin America
- 10.2.6. Middle East & Africa
- 11. Global Apac Travel Market Competitive Landscape, Market Share Analysis, and Company Profiles
- 11.1. Market Share Analysis
- 11.2. Company Profiles
- 11.3. TUI Group
- 11.3.1. Company Overview
- 11.3.2. Financial Highlights
- 11.3.3. Product Portfolio
- 11.3.4. SWOT Analysis
- 11.3.5. Key Strategies and Developments
- 11.4. Lindblad Expeditions Holdings, Inc.
- 11.4.1. Company Overview
- 11.4.2. Financial Highlights
- 11.4.3. Product Portfolio
- 11.4.4. SWOT Analysis
- 11.4.5. Key Strategies and Developments
- 11.5. Thomas Cook (India) Limited (Fairfax Financial Holdings Limited)
- 11.5.1. Company Overview
- 11.5.2. Financial Highlights
- 11.5.3. Product Portfolio
- 11.5.4. SWOT Analysis
- 11.5.5. Key Strategies and Developments
- 11.6. Scott Dunn
- 11.6.1. Company Overview
- 11.6.2. Financial Highlights
- 11.6.3. Product Portfolio
- 11.6.4. SWOT Analysis
- 11.6.5. Key Strategies and Developments
- 11.7. Abercrombie & Kent USA, LLC
- 11.7.1. Company Overview
- 11.7.2. Financial Highlights
- 11.7.3. Product Portfolio
- 11.7.4. SWOT Analysis
- 11.7.5. Key Strategies and Developments
- 11.8. Exodus Travels Limited
- 11.8.1. Company Overview
- 11.8.2. Financial Highlights
- 11.8.3. Product Portfolio
- 11.8.4. SWOT Analysis
- 11.8.5. Key Strategies and Developments
- 11.9. Travel Edge, Inc. (Navigatr Group)
- 11.9.1. Company Overview
- 11.9.2. Financial Highlights
- 11.9.3. Product Portfolio
- 11.9.4. SWOT Analysis
- 11.9.5. Key Strategies and Developments
- 11.10. Butterfield & Robinson, Inc.
- 11.10.1. Company Overview
- 11.10.2. Financial Highlights
- 11.10.3. Product Portfolio
- 11.10.4. SWOT Analysis
- 11.10.5. Key Strategies and Developments
- 11.11. Geographic Expeditions, Inc.
- 11.11.1. Company Overview
- 11.11.2. Financial Highlights
- 11.11.3. Product Portfolio
- 11.11.4. SWOT Analysis
- 11.11.5. Key Strategies and Developments
- 11.12. Micato Safaris
- 11.12.1. Company Overview
- 11.12.2. Financial Highlights
- 11.12.3. Product Portfolio
- 11.12.4. SWOT Analysis
- 11.12.5. Key Strategies and Developments
- 11.13.1. Company Overview
- 11.13.2. Financial Highlights
- 11.13.3. Product Portfolio
- 11.13.4. SWOT Analysis
- 11.13.5. Key Strategies and Developments
- 12. Assumptions and Acronyms
- 13. Research Methodology
- 14. Contact
"
- List of Figures
- "
- Figure 1: Global Apac Travel Market Revenue (US$ Mn) Market Share by By Tour in 2022
- Figure 2: Global Apac Travel Market Market Attractiveness Analysis by By Tour, 2016-2032
- Figure 3: Global Apac Travel Market Revenue (US$ Mn) Market Share by By Age-group in 2022
- Figure 4: Global Apac Travel Market Market Attractiveness Analysis by By Age-group , 2016-2032
- Figure 5: Global Apac Travel Market Revenue (US$ Mn) Market Share by By Countryin 2022
- Figure 6: Global Apac Travel Market Market Attractiveness Analysis by By Country, 2016-2032
- Figure 7: Global Apac Travel Market Revenue (US$ Mn) Market Share by Region in 2022
- Figure 8: Global Apac Travel Market Market Attractiveness Analysis by Region, 2016-2032
- Figure 9: Global Apac Travel Market Market Revenue (US$ Mn) (2016-2032)
- Figure 10: Global Apac Travel Market Market Revenue (US$ Mn) Comparison by Region (2016-2032)
- Figure 11: Global Apac Travel Market Market Revenue (US$ Mn) Comparison by By Tour (2016-2032)
- Figure 12: Global Apac Travel Market Market Revenue (US$ Mn) Comparison by By Age-group (2016-2032)
- Figure 13: Global Apac Travel Market Market Revenue (US$ Mn) Comparison by By Country (2016-2032)
- Figure 14: Global Apac Travel Market Market Y-o-Y Growth Rate Comparison by Region (2016-2032)
- Figure 15: Global Apac Travel Market Market Y-o-Y Growth Rate Comparison by By Tour (2016-2032)
- Figure 16: Global Apac Travel Market Market Y-o-Y Growth Rate Comparison by By Age-group (2016-2032)
- Figure 17: Global Apac Travel Market Market Y-o-Y Growth Rate Comparison by By Country (2016-2032)
- Figure 18: Global Apac Travel Market Market Share Comparison by Region (2016-2032)
- Figure 19: Global Apac Travel Market Market Share Comparison by By Tour (2016-2032)
- Figure 20: Global Apac Travel Market Market Share Comparison by By Age-group (2016-2032)
- Figure 21: Global Apac Travel Market Market Share Comparison by By Country (2016-2032)
- Figure 22: North America Apac Travel Market Revenue (US$ Mn) Market Share by By Tourin 2022
- Figure 23: North America Apac Travel Market Market Attractiveness Analysis by By Tour, 2016-2032
- Figure 24: North America Apac Travel Market Revenue (US$ Mn) Market Share by By Age-group in 2022
- Figure 25: North America Apac Travel Market Market Attractiveness Analysis by By Age-group , 2016-2032
- Figure 26: North America Apac Travel Market Revenue (US$ Mn) Market Share by By Countryin 2022
- Figure 27: North America Apac Travel Market Market Attractiveness Analysis by By Country, 2016-2032
- Figure 28: North America Apac Travel Market Revenue (US$ Mn) Market Share by Country in 2022
- Figure 29: North America Apac Travel Market Market Attractiveness Analysis by Country, 2016-2032
- Figure 30: North America Apac Travel Market Market Revenue (US$ Mn) (2016-2032)
- Figure 31: North America Apac Travel Market Market Revenue (US$ Mn) Comparison by Country (2016-2032)
- Figure 32: North America Apac Travel Market Market Revenue (US$ Mn) Comparison by By Tour (2016-2032)
- Figure 33: North America Apac Travel Market Market Revenue (US$ Mn) Comparison by By Age-group (2016-2032)
- Figure 34: North America Apac Travel Market Market Revenue (US$ Mn) Comparison by By Country (2016-2032)
- Figure 35: North America Apac Travel Market Market Y-o-Y Growth Rate Comparison by Country (2016-2032)
- Figure 36: North America Apac Travel Market Market Y-o-Y Growth Rate Comparison by By Tour (2016-2032)
- Figure 37: North America Apac Travel Market Market Y-o-Y Growth Rate Comparison by By Age-group (2016-2032)
- Figure 38: North America Apac Travel Market Market Y-o-Y Growth Rate Comparison by By Country (2016-2032)
- Figure 39: North America Apac Travel Market Market Share Comparison by Country (2016-2032)
- Figure 40: North America Apac Travel Market Market Share Comparison by By Tour (2016-2032)
- Figure 41: North America Apac Travel Market Market Share Comparison by By Age-group (2016-2032)
- Figure 42: North America Apac Travel Market Market Share Comparison by By Country (2016-2032)
- Figure 43: Western Europe Apac Travel Market Revenue (US$ Mn) Market Share by By Tourin 2022
- Figure 44: Western Europe Apac Travel Market Market Attractiveness Analysis by By Tour, 2016-2032
- Figure 45: Western Europe Apac Travel Market Revenue (US$ Mn) Market Share by By Age-group in 2022
- Figure 46: Western Europe Apac Travel Market Market Attractiveness Analysis by By Age-group , 2016-2032
- Figure 47: Western Europe Apac Travel Market Revenue (US$ Mn) Market Share by By Countryin 2022
- Figure 48: Western Europe Apac Travel Market Market Attractiveness Analysis by By Country, 2016-2032
- Figure 49: Western Europe Apac Travel Market Revenue (US$ Mn) Market Share by Country in 2022
- Figure 50: Western Europe Apac Travel Market Market Attractiveness Analysis by Country, 2016-2032
- Figure 51: Western Europe Apac Travel Market Market Revenue (US$ Mn) (2016-2032)
- Figure 52: Western Europe Apac Travel Market Market Revenue (US$ Mn) Comparison by Country (2016-2032)
- Figure 53: Western Europe Apac Travel Market Market Revenue (US$ Mn) Comparison by By Tour (2016-2032)
- Figure 54: Western Europe Apac Travel Market Market Revenue (US$ Mn) Comparison by By Age-group (2016-2032)
- Figure 55: Western Europe Apac Travel Market Market Revenue (US$ Mn) Comparison by By Country (2016-2032)
- Figure 56: Western Europe Apac Travel Market Market Y-o-Y Growth Rate Comparison by Country (2016-2032)
- Figure 57: Western Europe Apac Travel Market Market Y-o-Y Growth Rate Comparison by By Tour (2016-2032)
- Figure 58: Western Europe Apac Travel Market Market Y-o-Y Growth Rate Comparison by By Age-group (2016-2032)
- Figure 59: Western Europe Apac Travel Market Market Y-o-Y Growth Rate Comparison by By Country (2016-2032)
- Figure 60: Western Europe Apac Travel Market Market Share Comparison by Country (2016-2032)
- Figure 61: Western Europe Apac Travel Market Market Share Comparison by By Tour (2016-2032)
- Figure 62: Western Europe Apac Travel Market Market Share Comparison by By Age-group (2016-2032)
- Figure 63: Western Europe Apac Travel Market Market Share Comparison by By Country (2016-2032)
- Figure 64: Eastern Europe Apac Travel Market Revenue (US$ Mn) Market Share by By Tourin 2022
- Figure 65: Eastern Europe Apac Travel Market Market Attractiveness Analysis by By Tour, 2016-2032
- Figure 66: Eastern Europe Apac Travel Market Revenue (US$ Mn) Market Share by By Age-group in 2022
- Figure 67: Eastern Europe Apac Travel Market Market Attractiveness Analysis by By Age-group , 2016-2032
- Figure 68: Eastern Europe Apac Travel Market Revenue (US$ Mn) Market Share by By Countryin 2022
- Figure 69: Eastern Europe Apac Travel Market Market Attractiveness Analysis by By Country, 2016-2032
- Figure 70: Eastern Europe Apac Travel Market Revenue (US$ Mn) Market Share by Country in 2022
- Figure 71: Eastern Europe Apac Travel Market Market Attractiveness Analysis by Country, 2016-2032
- Figure 72: Eastern Europe Apac Travel Market Market Revenue (US$ Mn) (2016-2032)
- Figure 73: Eastern Europe Apac Travel Market Market Revenue (US$ Mn) Comparison by Country (2016-2032)
- Figure 74: Eastern Europe Apac Travel Market Market Revenue (US$ Mn) Comparison by By Tour (2016-2032)
- Figure 75: Eastern Europe Apac Travel Market Market Revenue (US$ Mn) Comparison by By Age-group (2016-2032)
- Figure 76: Eastern Europe Apac Travel Market Market Revenue (US$ Mn) Comparison by By Country (2016-2032)
- Figure 77: Eastern Europe Apac Travel Market Market Y-o-Y Growth Rate Comparison by Country (2016-2032)
- Figure 78: Eastern Europe Apac Travel Market Market Y-o-Y Growth Rate Comparison by By Tour (2016-2032)
- Figure 79: Eastern Europe Apac Travel Market Market Y-o-Y Growth Rate Comparison by By Age-group (2016-2032)
- Figure 80: Eastern Europe Apac Travel Market Market Y-o-Y Growth Rate Comparison by By Country (2016-2032)
- Figure 81: Eastern Europe Apac Travel Market Market Share Comparison by Country (2016-2032)
- Figure 82: Eastern Europe Apac Travel Market Market Share Comparison by By Tour (2016-2032)
- Figure 83: Eastern Europe Apac Travel Market Market Share Comparison by By Age-group (2016-2032)
- Figure 84: Eastern Europe Apac Travel Market Market Share Comparison by By Country (2016-2032)
- Figure 85: APAC Apac Travel Market Revenue (US$ Mn) Market Share by By Tourin 2022
- Figure 86: APAC Apac Travel Market Market Attractiveness Analysis by By Tour, 2016-2032
- Figure 87: APAC Apac Travel Market Revenue (US$ Mn) Market Share by By Age-group in 2022
- Figure 88: APAC Apac Travel Market Market Attractiveness Analysis by By Age-group , 2016-2032
- Figure 89: APAC Apac Travel Market Revenue (US$ Mn) Market Share by By Countryin 2022
- Figure 90: APAC Apac Travel Market Market Attractiveness Analysis by By Country, 2016-2032
- Figure 91: APAC Apac Travel Market Revenue (US$ Mn) Market Share by Country in 2022
- Figure 92: APAC Apac Travel Market Market Attractiveness Analysis by Country, 2016-2032
- Figure 93: APAC Apac Travel Market Market Revenue (US$ Mn) (2016-2032)
- Figure 94: APAC Apac Travel Market Market Revenue (US$ Mn) Comparison by Country (2016-2032)
- Figure 95: APAC Apac Travel Market Market Revenue (US$ Mn) Comparison by By Tour (2016-2032)
- Figure 96: APAC Apac Travel Market Market Revenue (US$ Mn) Comparison by By Age-group (2016-2032)
- Figure 97: APAC Apac Travel Market Market Revenue (US$ Mn) Comparison by By Country (2016-2032)
- Figure 98: APAC Apac Travel Market Market Y-o-Y Growth Rate Comparison by Country (2016-2032)
- Figure 99: APAC Apac Travel Market Market Y-o-Y Growth Rate Comparison by By Tour (2016-2032)
- Figure 100: APAC Apac Travel Market Market Y-o-Y Growth Rate Comparison by By Age-group (2016-2032)
- Figure 101: APAC Apac Travel Market Market Y-o-Y Growth Rate Comparison by By Country (2016-2032)
- Figure 102: APAC Apac Travel Market Market Share Comparison by Country (2016-2032)
- Figure 103: APAC Apac Travel Market Market Share Comparison by By Tour (2016-2032)
- Figure 104: APAC Apac Travel Market Market Share Comparison by By Age-group (2016-2032)
- Figure 105: APAC Apac Travel Market Market Share Comparison by By Country (2016-2032)
- Figure 106: Latin America Apac Travel Market Revenue (US$ Mn) Market Share by By Tourin 2022
- Figure 107: Latin America Apac Travel Market Market Attractiveness Analysis by By Tour, 2016-2032
- Figure 108: Latin America Apac Travel Market Revenue (US$ Mn) Market Share by By Age-group in 2022
- Figure 109: Latin America Apac Travel Market Market Attractiveness Analysis by By Age-group , 2016-2032
- Figure 110: Latin America Apac Travel Market Revenue (US$ Mn) Market Share by By Countryin 2022
- Figure 111: Latin America Apac Travel Market Market Attractiveness Analysis by By Country, 2016-2032
- Figure 112: Latin America Apac Travel Market Revenue (US$ Mn) Market Share by Country in 2022
- Figure 113: Latin America Apac Travel Market Market Attractiveness Analysis by Country, 2016-2032
- Figure 114: Latin America Apac Travel Market Market Revenue (US$ Mn) (2016-2032)
- Figure 115: Latin America Apac Travel Market Market Revenue (US$ Mn) Comparison by Country (2016-2032)
- Figure 116: Latin America Apac Travel Market Market Revenue (US$ Mn) Comparison by By Tour (2016-2032)
- Figure 117: Latin America Apac Travel Market Market Revenue (US$ Mn) Comparison by By Age-group (2016-2032)
- Figure 118: Latin America Apac Travel Market Market Revenue (US$ Mn) Comparison by By Country (2016-2032)
- Figure 119: Latin America Apac Travel Market Market Y-o-Y Growth Rate Comparison by Country (2016-2032)
- Figure 120: Latin America Apac Travel Market Market Y-o-Y Growth Rate Comparison by By Tour (2016-2032)
- Figure 121: Latin America Apac Travel Market Market Y-o-Y Growth Rate Comparison by By Age-group (2016-2032)
- Figure 122: Latin America Apac Travel Market Market Y-o-Y Growth Rate Comparison by By Country (2016-2032)
- Figure 123: Latin America Apac Travel Market Market Share Comparison by Country (2016-2032)
- Figure 124: Latin America Apac Travel Market Market Share Comparison by By Tour (2016-2032)
- Figure 125: Latin America Apac Travel Market Market Share Comparison by By Age-group (2016-2032)
- Figure 126: Latin America Apac Travel Market Market Share Comparison by By Country (2016-2032)
- Figure 127: Middle East & Africa Apac Travel Market Revenue (US$ Mn) Market Share by By Tourin 2022
- Figure 128: Middle East & Africa Apac Travel Market Market Attractiveness Analysis by By Tour, 2016-2032
- Figure 129: Middle East & Africa Apac Travel Market Revenue (US$ Mn) Market Share by By Age-group in 2022
- Figure 130: Middle East & Africa Apac Travel Market Market Attractiveness Analysis by By Age-group , 2016-2032
- Figure 131: Middle East & Africa Apac Travel Market Revenue (US$ Mn) Market Share by By Countryin 2022
- Figure 132: Middle East & Africa Apac Travel Market Market Attractiveness Analysis by By Country, 2016-2032
- Figure 133: Middle East & Africa Apac Travel Market Revenue (US$ Mn) Market Share by Country in 2022
- Figure 134: Middle East & Africa Apac Travel Market Market Attractiveness Analysis by Country, 2016-2032
- Figure 135: Middle East & Africa Apac Travel Market Market Revenue (US$ Mn) (2016-2032)
- Figure 136: Middle East & Africa Apac Travel Market Market Revenue (US$ Mn) Comparison by Country (2016-2032)
- Figure 137: Middle East & Africa Apac Travel Market Market Revenue (US$ Mn) Comparison by By Tour (2016-2032)
- Figure 138: Middle East & Africa Apac Travel Market Market Revenue (US$ Mn) Comparison by By Age-group (2016-2032)
- Figure 139: Middle East & Africa Apac Travel Market Market Revenue (US$ Mn) Comparison by By Country (2016-2032)
- Figure 140: Middle East & Africa Apac Travel Market Market Y-o-Y Growth Rate Comparison by Country (2016-2032)
- Figure 141: Middle East & Africa Apac Travel Market Market Y-o-Y Growth Rate Comparison by By Tour (2016-2032)
- Figure 142: Middle East & Africa Apac Travel Market Market Y-o-Y Growth Rate Comparison by By Age-group (2016-2032)
- Figure 143: Middle East & Africa Apac Travel Market Market Y-o-Y Growth Rate Comparison by By Country (2016-2032)
- Figure 144: Middle East & Africa Apac Travel Market Market Share Comparison by Country (2016-2032)
- Figure 145: Middle East & Africa Apac Travel Market Market Share Comparison by By Tour (2016-2032)
- Figure 146: Middle East & Africa Apac Travel Market Market Share Comparison by By Age-group (2016-2032)
- Figure 147: Middle East & Africa Apac Travel Market Market Share Comparison by By Country (2016-2032)
"
- List of Tables
- "
- Table 1: Global Apac Travel Market Market Comparison by By Tour (2016-2032)
- Table 2: Global Apac Travel Market Market Comparison by By Age-group (2016-2032)
- Table 3: Global Apac Travel Market Market Comparison by By Country (2016-2032)
- Table 4: Global Apac Travel Market Revenue (US$ Mn) Comparison by Region (2016-2032)
- Table 5: Global Apac Travel Market Market Revenue (US$ Mn) (2016-2032)
- Table 6: Global Apac Travel Market Market Revenue (US$ Mn) Comparison by Region (2016-2032)
- Table 7: Global Apac Travel Market Market Revenue (US$ Mn) Comparison by By Tour (2016-2032)
- Table 8: Global Apac Travel Market Market Revenue (US$ Mn) Comparison by By Age-group (2016-2032)
- Table 9: Global Apac Travel Market Market Revenue (US$ Mn) Comparison by By Country (2016-2032)
- Table 10: Global Apac Travel Market Market Y-o-Y Growth Rate Comparison by Region (2016-2032)
- Table 11: Global Apac Travel Market Market Y-o-Y Growth Rate Comparison by By Tour (2016-2032)
- Table 12: Global Apac Travel Market Market Y-o-Y Growth Rate Comparison by By Age-group (2016-2032)
- Table 13: Global Apac Travel Market Market Y-o-Y Growth Rate Comparison by By Country (2016-2032)
- Table 14: Global Apac Travel Market Market Share Comparison by Region (2016-2032)
- Table 15: Global Apac Travel Market Market Share Comparison by By Tour (2016-2032)
- Table 16: Global Apac Travel Market Market Share Comparison by By Age-group (2016-2032)
- Table 17: Global Apac Travel Market Market Share Comparison by By Country (2016-2032)
- Table 18: North America Apac Travel Market Market Comparison by By Age-group (2016-2032)
- Table 19: North America Apac Travel Market Market Comparison by By Country (2016-2032)
- Table 20: North America Apac Travel Market Revenue (US$ Mn) Comparison by Country (2016-2032)
- Table 21: North America Apac Travel Market Market Revenue (US$ Mn) (2016-2032)
- Table 22: North America Apac Travel Market Market Revenue (US$ Mn) Comparison by Country (2016-2032)
- Table 23: North America Apac Travel Market Market Revenue (US$ Mn) Comparison by By Tour (2016-2032)
- Table 24: North America Apac Travel Market Market Revenue (US$ Mn) Comparison by By Age-group (2016-2032)
- Table 25: North America Apac Travel Market Market Revenue (US$ Mn) Comparison by By Country (2016-2032)
- Table 26: North America Apac Travel Market Market Y-o-Y Growth Rate Comparison by Country (2016-2032)
- Table 27: North America Apac Travel Market Market Y-o-Y Growth Rate Comparison by By Tour (2016-2032)
- Table 28: North America Apac Travel Market Market Y-o-Y Growth Rate Comparison by By Age-group (2016-2032)
- Table 29: North America Apac Travel Market Market Y-o-Y Growth Rate Comparison by By Country (2016-2032)
- Table 30: North America Apac Travel Market Market Share Comparison by Country (2016-2032)
- Table 31: North America Apac Travel Market Market Share Comparison by By Tour (2016-2032)
- Table 32: North America Apac Travel Market Market Share Comparison by By Age-group (2016-2032)
- Table 33: North America Apac Travel Market Market Share Comparison by By Country (2016-2032)
- Table 34: Western Europe Apac Travel Market Market Comparison by By Tour (2016-2032)
- Table 35: Western Europe Apac Travel Market Market Comparison by By Age-group (2016-2032)
- Table 36: Western Europe Apac Travel Market Market Comparison by By Country (2016-2032)
- Table 37: Western Europe Apac Travel Market Revenue (US$ Mn) Comparison by Country (2016-2032)
- Table 38: Western Europe Apac Travel Market Market Revenue (US$ Mn) (2016-2032)
- Table 39: Western Europe Apac Travel Market Market Revenue (US$ Mn) Comparison by Country (2016-2032)
- Table 40: Western Europe Apac Travel Market Market Revenue (US$ Mn) Comparison by By Tour (2016-2032)
- Table 41: Western Europe Apac Travel Market Market Revenue (US$ Mn) Comparison by By Age-group (2016-2032)
- Table 42: Western Europe Apac Travel Market Market Revenue (US$ Mn) Comparison by By Country (2016-2032)
- Table 43: Western Europe Apac Travel Market Market Y-o-Y Growth Rate Comparison by Country (2016-2032)
- Table 44: Western Europe Apac Travel Market Market Y-o-Y Growth Rate Comparison by By Tour (2016-2032)
- Table 45: Western Europe Apac Travel Market Market Y-o-Y Growth Rate Comparison by By Age-group (2016-2032)
- Table 46: Western Europe Apac Travel Market Market Y-o-Y Growth Rate Comparison by By Country (2016-2032)
- Table 47: Western Europe Apac Travel Market Market Share Comparison by Country (2016-2032)
- Table 48: Western Europe Apac Travel Market Market Share Comparison by By Tour (2016-2032)
- Table 49: Western Europe Apac Travel Market Market Share Comparison by By Age-group (2016-2032)
- Table 50: Western Europe Apac Travel Market Market Share Comparison by By Country (2016-2032)
- Table 51: Eastern Europe Apac Travel Market Market Comparison by By Tour (2016-2032)
- Table 52: Eastern Europe Apac Travel Market Market Comparison by By Age-group (2016-2032)
- Table 53: Eastern Europe Apac Travel Market Market Comparison by By Country (2016-2032)
- Table 54: Eastern Europe Apac Travel Market Revenue (US$ Mn) Comparison by Country (2016-2032)
- Table 55: Eastern Europe Apac Travel Market Market Revenue (US$ Mn) (2016-2032)
- Table 56: Eastern Europe Apac Travel Market Market Revenue (US$ Mn) Comparison by Country (2016-2032)
- Table 57: Eastern Europe Apac Travel Market Market Revenue (US$ Mn) Comparison by By Tour (2016-2032)
- Table 58: Eastern Europe Apac Travel Market Market Revenue (US$ Mn) Comparison by By Age-group (2016-2032)
- Table 59: Eastern Europe Apac Travel Market Market Revenue (US$ Mn) Comparison by By Country (2016-2032)
- Table 60: Eastern Europe Apac Travel Market Market Y-o-Y Growth Rate Comparison by Country (2016-2032)
- Table 61: Eastern Europe Apac Travel Market Market Y-o-Y Growth Rate Comparison by By Tour (2016-2032)
- Table 62: Eastern Europe Apac Travel Market Market Y-o-Y Growth Rate Comparison by By Age-group (2016-2032)
- Table 63: Eastern Europe Apac Travel Market Market Y-o-Y Growth Rate Comparison by By Country (2016-2032)
- Table 64: Eastern Europe Apac Travel Market Market Share Comparison by Country (2016-2032)
- Table 65: Eastern Europe Apac Travel Market Market Share Comparison by By Tour (2016-2032)
- Table 66: Eastern Europe Apac Travel Market Market Share Comparison by By Age-group (2016-2032)
- Table 67: Eastern Europe Apac Travel Market Market Share Comparison by By Country (2016-2032)
- Table 68: APAC Apac Travel Market Market Comparison by By Tour (2016-2032)
- Table 69: APAC Apac Travel Market Market Comparison by By Age-group (2016-2032)
- Table 70: APAC Apac Travel Market Market Comparison by By Country (2016-2032)
- Table 71: APAC Apac Travel Market Revenue (US$ Mn) Comparison by Country (2016-2032)
- Table 72: APAC Apac Travel Market Market Revenue (US$ Mn) (2016-2032)
- Table 73: APAC Apac Travel Market Market Revenue (US$ Mn) Comparison by Country (2016-2032)
- Table 74: APAC Apac Travel Market Market Revenue (US$ Mn) Comparison by By Tour (2016-2032)
- Table 75: APAC Apac Travel Market Market Revenue (US$ Mn) Comparison by By Age-group (2016-2032)
- Table 76: APAC Apac Travel Market Market Revenue (US$ Mn) Comparison by By Country (2016-2032)
- Table 77: APAC Apac Travel Market Market Y-o-Y Growth Rate Comparison by Country (2016-2032)
- Table 78: APAC Apac Travel Market Market Y-o-Y Growth Rate Comparison by By Tour (2016-2032)
- Table 79: APAC Apac Travel Market Market Y-o-Y Growth Rate Comparison by By Age-group (2016-2032)
- Table 80: APAC Apac Travel Market Market Y-o-Y Growth Rate Comparison by By Country (2016-2032)
- Table 81: APAC Apac Travel Market Market Share Comparison by Country (2016-2032)
- Table 82: APAC Apac Travel Market Market Share Comparison by By Tour (2016-2032)
- Table 83: APAC Apac Travel Market Market Share Comparison by By Age-group (2016-2032)
- Table 84: APAC Apac Travel Market Market Share Comparison by By Country (2016-2032)
- Table 85: Latin America Apac Travel Market Market Comparison by By Tour (2016-2032)
- Table 86: Latin America Apac Travel Market Market Comparison by By Age-group (2016-2032)
- Table 87: Latin America Apac Travel Market Market Comparison by By Country (2016-2032)
- Table 88: Latin America Apac Travel Market Revenue (US$ Mn) Comparison by Country (2016-2032)
- Table 89: Latin America Apac Travel Market Market Revenue (US$ Mn) (2016-2032)
- Table 90: Latin America Apac Travel Market Market Revenue (US$ Mn) Comparison by Country (2016-2032)
- Table 91: Latin America Apac Travel Market Market Revenue (US$ Mn) Comparison by By Tour (2016-2032)
- Table 92: Latin America Apac Travel Market Market Revenue (US$ Mn) Comparison by By Age-group (2016-2032)
- Table 93: Latin America Apac Travel Market Market Revenue (US$ Mn) Comparison by By Country (2016-2032)
- Table 94: Latin America Apac Travel Market Market Y-o-Y Growth Rate Comparison by Country (2016-2032)
- Table 95: Latin America Apac Travel Market Market Y-o-Y Growth Rate Comparison by By Tour (2016-2032)
- Table 96: Latin America Apac Travel Market Market Y-o-Y Growth Rate Comparison by By Age-group (2016-2032)
- Table 97: Latin America Apac Travel Market Market Y-o-Y Growth Rate Comparison by By Country (2016-2032)
- Table 98: Latin America Apac Travel Market Market Share Comparison by Country (2016-2032)
- Table 99: Latin America Apac Travel Market Market Share Comparison by By Tour (2016-2032)
- Table 100: Latin America Apac Travel Market Market Share Comparison by By Age-group (2016-2032)
- Table 101: Latin America Apac Travel Market Market Share Comparison by By Country (2016-2032)
- Table 102: Middle East & Africa Apac Travel Market Market Comparison by By Tour (2016-2032)
- Table 103: Middle East & Africa Apac Travel Market Market Comparison by By Age-group (2016-2032)
- Table 104: Middle East & Africa Apac Travel Market Market Comparison by By Country (2016-2032)
- Table 105: Middle East & Africa Apac Travel Market Revenue (US$ Mn) Comparison by Country (2016-2032)
- Table 106: Middle East & Africa Apac Travel Market Market Revenue (US$ Mn) (2016-2032)
- Table 107: Middle East & Africa Apac Travel Market Market Revenue (US$ Mn) Comparison by Country (2016-2032)
- Table 108: Middle East & Africa Apac Travel Market Market Revenue (US$ Mn) Comparison by By Tour (2016-2032)
- Table 109: Middle East & Africa Apac Travel Market Market Revenue (US$ Mn) Comparison by By Age-group (2016-2032)
- Table 110: Middle East & Africa Apac Travel Market Market Revenue (US$ Mn) Comparison by By Country (2016-2032)
- Table 111: Middle East & Africa Apac Travel Market Market Y-o-Y Growth Rate Comparison by Country (2016-2032)
- Table 112: Middle East & Africa Apac Travel Market Market Y-o-Y Growth Rate Comparison by By Tour (2016-2032)
- Table 113: Middle East & Africa Apac Travel Market Market Y-o-Y Growth Rate Comparison by By Age-group (2016-2032)
- Table 114: Middle East & Africa Apac Travel Market Market Y-o-Y Growth Rate Comparison by By Country (2016-2032)
- Table 115: Middle East & Africa Apac Travel Market Market Share Comparison by Country (2016-2032)
- Table 116: Middle East & Africa Apac Travel Market Market Share Comparison by By Tour (2016-2032)
- Table 117: Middle East & Africa Apac Travel Market Market Share Comparison by By Age-group (2016-2032)
- Table 118: Middle East & Africa Apac Travel Market Market Share Comparison by By Country (2016-2032)
- 1. Executive Summary
-
- TUI Group
- Lindblad Expeditions Holdings, Inc.
- Thomas Cook (India) Limited (Fairfax Financial Holdings Limited)
- Scott Dunn
- Abercrombie & Kent USA, LLC
- Exodus Travels Limited
- Travel Edge, Inc. (Navigatr Group)
- Butterfield & Robinson, Inc.
- Geographic Expeditions, Inc.
- Micato Safaris
Our Clients


View Our Licence Options
