AI in Space Exploration Market By Type (Rovers, Robotic Arms, Space Probes, Other Types), By Application (Robotics, Remote Sensing and Monitoring, Data Analytics, Asteroid Mining, Manned Vehicles and Reusable Launch, Communications, Others), By End-user (Government, Commercial), By Region And Companies - Industry Segment Outlook, Market Assessment, Competition Scenario, Trends, And Forecast 2024-2033
-
51300
-
September 2024
-
300
-


-
This report was compiled by Vishwa Gaul Vishwa is an experienced market research and consulting professional with over 8 years of expertise in the ICT industry, contributing to over 700 reports across telecommunications, software, hardware, and digital solutions. Correspondence Team Lead- ICT Linkedin | Detailed Market research Methodology Our methodology involves a mix of primary research, including interviews with leading mental health experts, and secondary research from reputable medical journals and databases. View Detailed Methodology Page
-
Quick Navigation
Report Overview
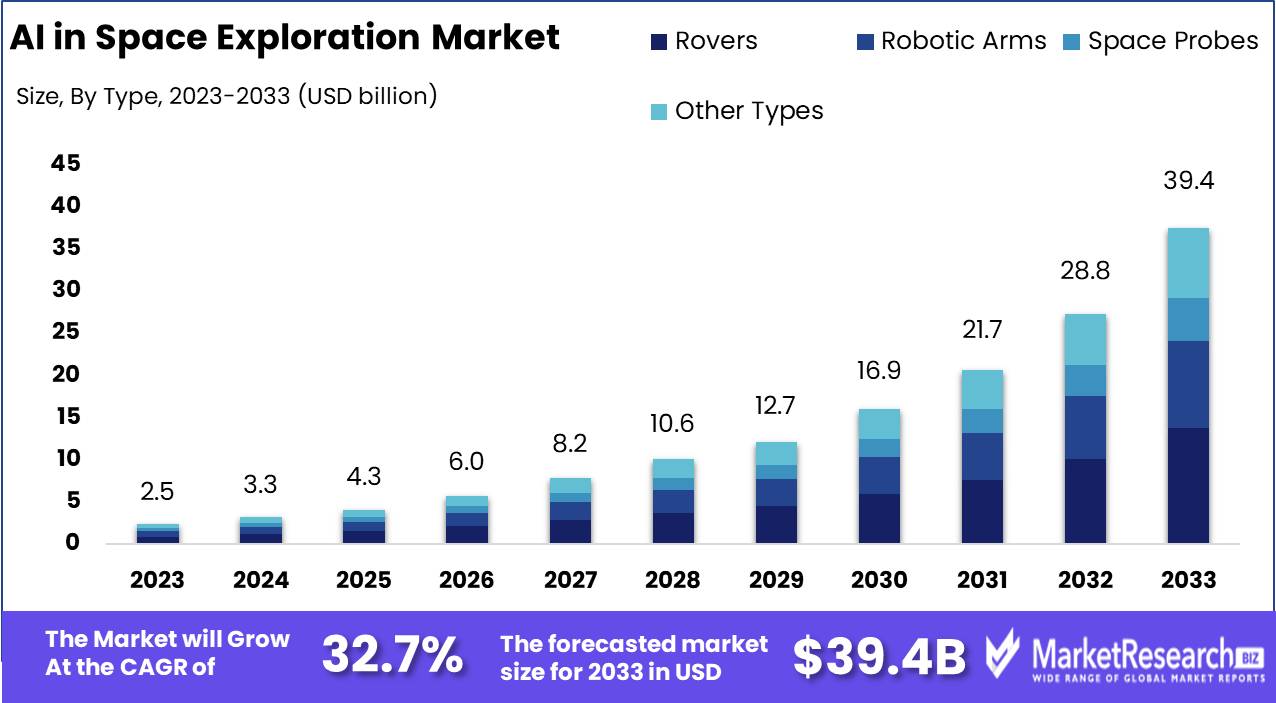
The AI in Space Exploration Market was valued at USD 2.5 billion in 2023. It is expected to reach USD 39.4 billion by 2033, with a CAGR of 32.7% during the forecast period from 2024 to 2033.
The AI in Space Exploration Market encompasses the integration of artificial intelligence technologies into various aspects of space exploration, including mission planning, data analysis, autonomous navigation, and robotic operations. This market is driven by the increasing complexity of space missions and the need for enhanced decision-making capabilities. AI applications facilitate real-time processing of vast datasets generated by space missions, improving efficiency and reducing operational costs.
The AI in the space exploration market is poised for significant transformation, driven by several pivotal factors influencing its trajectory. The increasing complexity of space missions necessitates advanced technological solutions, where artificial intelligence (AI) plays a critical role in enhancing mission efficiency and safety. AI systems are increasingly being employed to optimize mission planning, automate operations, and improve data analysis, thereby addressing the multifaceted challenges inherent in contemporary space exploration.
Furthermore, a marked surge in investment from the private space sector is propelling innovation and facilitating the development of cutting-edge AI applications. This influx of capital not only supports research and development but also fosters a competitive environment that accelerates technological advancements.
However, the market also faces considerable challenges, particularly regarding high initial costs and substantial resource requirements associated with the integration of AI technologies into space missions. These factors can deter potential entrants and limit the scalability of AI applications in this sector. Additionally, reliability and safety concerns remain paramount, as stakeholders prioritize the successful execution of missions without compromising operational integrity. As the landscape evolves, market participants need to navigate these complexities carefully, ensuring that AI solutions are both robust and reliable. Ultimately, the successful integration of AI in space exploration hinges on the ability to balance innovation with safety and cost-effectiveness, positioning AI as an indispensable asset in the quest for deeper space exploration and utilization.
Key Takeaways
- Market Growth: The AI in Space Exploration Market was valued at USD 2.5 billion in 2023. It is expected to reach USD 39.4 billion by 2033, with a CAGR of 32.7% during the forecast period from 2024 to 2033.
- By Type: Rovers dominated the AI in the Space Exploration Market through advanced technology.
- By Application: Robotics dominated AI applications in space exploration advancements.
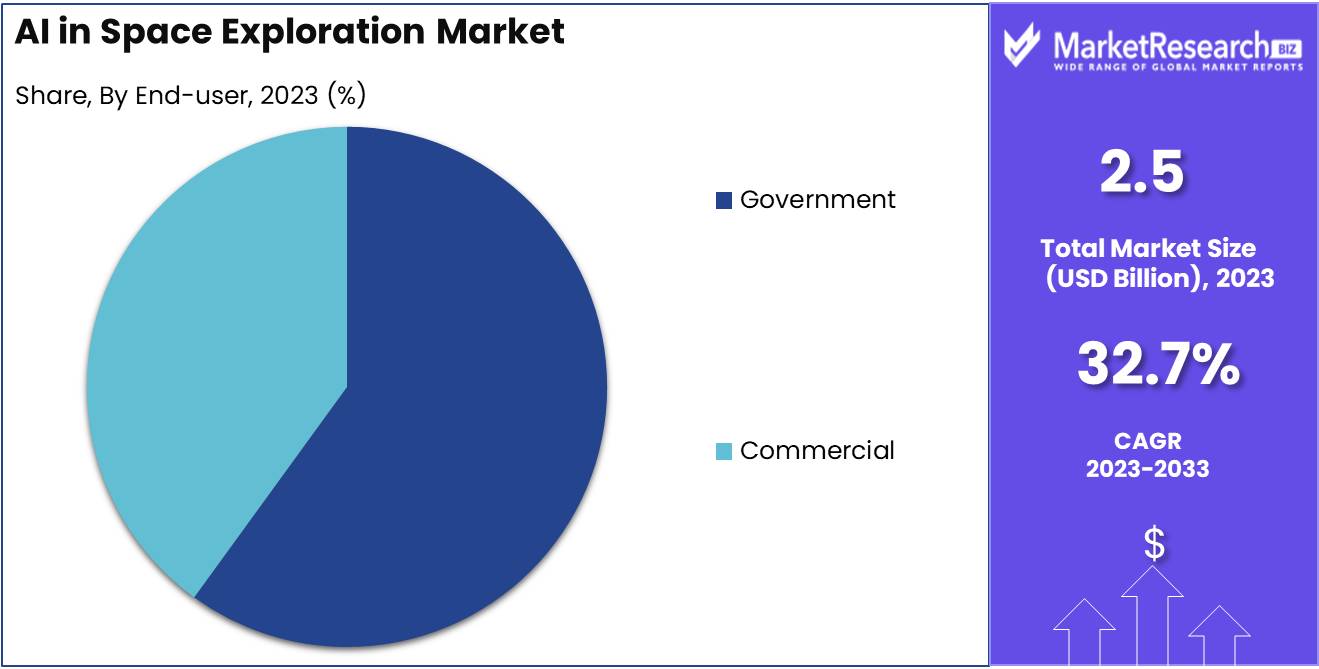
- By End-user: The government dominated AI in the space exploration market.
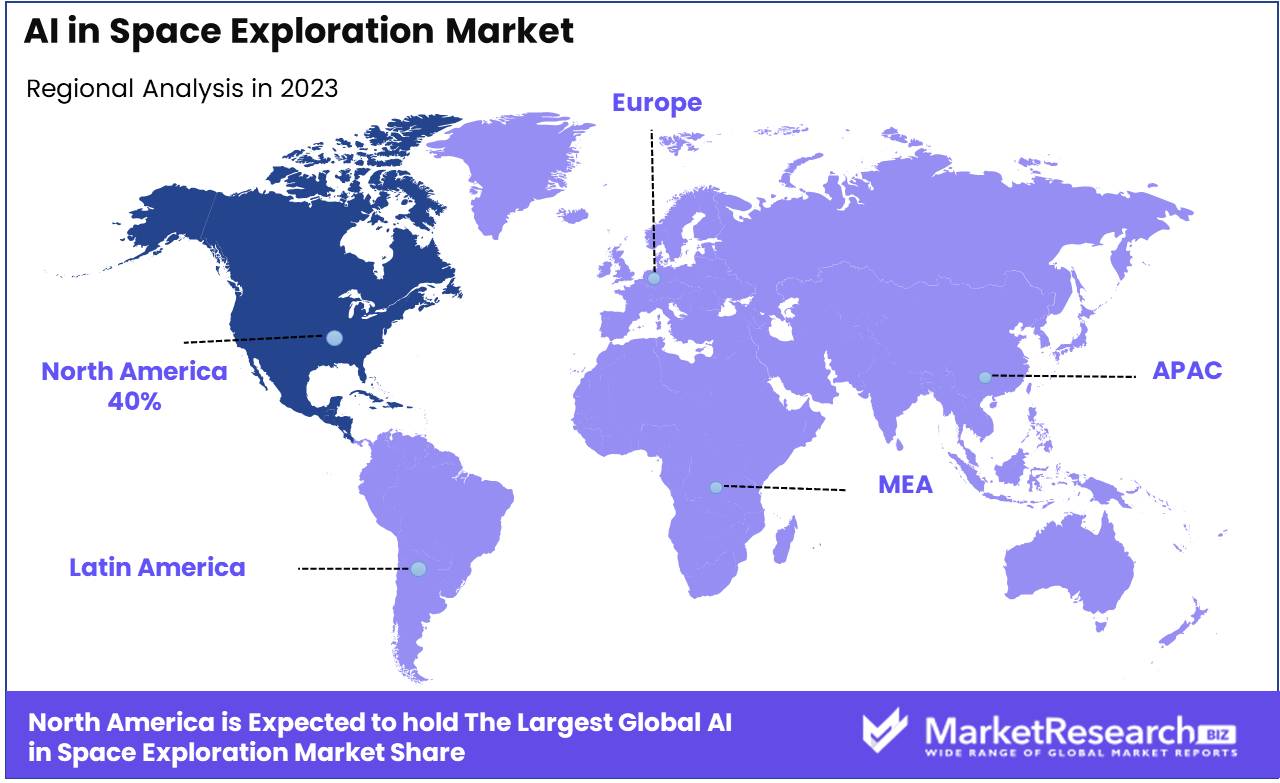
- Regional Dominance: North America dominates the AI in space exploration market with a 40% largest market share.
- Growth Opportunity: The AI in space exploration market will grow significantly, driven by enhanced data processing and the rise of autonomous systems, optimizing mission efficiency and minimizing operational costs.
Driving factors
Demand for Autonomous Operations Fuels Efficiency and Risk Mitigation in Space Exploration
The demand for autonomous operations has significantly influenced the growth of AI in the space exploration market. Space missions often involve complex, prolonged operations in environments that are inhospitable for human intervention. Autonomous systems, powered by AI, are increasingly essential in executing tasks that are either too dangerous or impossible for humans to perform directly. AI enables spacecraft and rovers to operate independently of ground control, reducing reliance on human oversight and facilitating real-time decision-making, particularly in distant and time-sensitive missions, such as those on Mars or the Moon.
AI-driven autonomous systems reduce the communication lag inherent in deep space missions, optimizing spacecraft navigation, conducting on-board analysis, and allowing vehicles to respond to unforeseen events. For example, NASA's Mars rovers utilize AI to autonomously plan routes and avoid hazards. As the complexity of space missions increases, the demand for enhanced autonomous capabilities is projected to grow, thus expanding the market for AI-enabled systems in space exploration.
Robotic Exploration Paves the Way for Advanced AI Integration
Robotic exploration serves as a primary driver for the implementation of AI in space exploration. Robots are a crucial component of space missions, tasked with gathering data, navigating harsh environments, and performing scientific experiments. AI allows these robotic systems to process vast amounts of data and adapt to their environments, enhancing the accuracy and success rates of space missions.
For example, AI-enhanced robotic systems such as NASA's Perseverance rover use machine learning algorithms to analyze terrain and select the most appropriate sites for sampling. These systems also enable data analysis without the need for direct human intervention, increasing the speed and efficiency of scientific research conducted in space.
The growing reliance on robotic systems to explore distant celestial bodies and perform maintenance on satellites and space stations is driving the integration of advanced AI technologies. This convergence accelerates the demand for AI solutions, which provide the computational power necessary for real-time decision-making in hostile, unknown environments. In turn, the continued investment in robotic exploration by space agencies and private enterprises is expected to significantly contribute to the expansion of AI applications in space.
Advancements in AI Technology Accelerate Market Innovation and Capabilities
Advancements in AI technology, particularly in areas such as machine learning, deep learning, and neural networks, are a fundamental driver of growth in the AI in space exploration market. These technologies enable the development of more sophisticated algorithms that can process massive amounts of data generated during space missions. As AI capabilities evolve, they provide enhanced precision, adaptability, and automation, transforming how space missions are designed and executed.
Machine learning models, for instance, are being applied to optimize spacecraft trajectories, improve image recognition for astronomical data, and enhance the predictive maintenance of satellites. This results in cost savings, improved mission efficiency, and a higher success rate in space exploration endeavors. Moreover, advancements in hardware, such as quantum computing, are expected to further enhance the processing capabilities of AI systems, enabling real-time analysis of vast data sets and empowering space agencies to make faster, more informed decisions.
These technological breakthroughs are attracting significant investments from both governmental space agencies and private space companies. The continuous improvement in AI tools and applications is thus positioning the market for sustained growth, as AI becomes an indispensable element in overcoming the inherent challenges of space exploration.
Restraining Factors
High Costs of Implementation: A Significant Barrier to Growth
The high costs associated with the implementation of artificial intelligence (AI) technologies in space exploration serve as a substantial restraining factor in the market. Investment in AI solutions, which includes advanced hardware, software development, and integration into existing systems, often requires significant financial resources. According to recent estimates, the overall expenditure for AI technologies in space could exceed $3 billion annually by 2025. This financial burden can deter smaller organizations and startups from entering the market, thereby limiting innovation and competition.
Furthermore, the capital-intensive nature of space missions, which already face high operational costs, compounds the issue. The necessity for substantial upfront investment in AI can restrict funding availability for other critical mission components, such as launch vehicles and scientific instruments. As a result, the market experiences slowed growth, particularly in sectors where cost sensitivity is paramount.
Communication Delays and Data Transmission Issues: Hindering Real-Time Operations
Communication delays and data transmission issues present another significant challenge to the growth of AI in space exploration. The vast distances involved in space missions lead to inherent latency in communication between Earth and spacecraft. For example, signals sent to Mars can take between 5 to 20 minutes to arrive, depending on the relative positions of the two planets. This delay severely restricts the capability for real-time data processing and decision-making, which are critical components of effective AI implementation.
Additionally, data transmission issues can result in incomplete or corrupted data being sent back to Earth, further complicating the analysis and interpretation processes. As a result, AI systems may not function optimally due to the lack of timely and accurate information, which is crucial for tasks such as autonomous navigation and real-time anomaly detection. This restriction hampers the development of robust AI applications, thereby impeding market growth.
By Type Analysis
Rovers dominated the AI in the Space Exploration Market through advanced technology.
In 2023, Rovers held a dominant market position in the Rovers segment of the AI in Space Exploration Market, driven by their critical role in planetary exploration and surface analysis. Rovers are equipped with advanced AI algorithms that facilitate autonomous navigation, obstacle avoidance, and data collection, enhancing mission efficiency and safety. The increasing investment in planetary missions by government agencies and private companies has further augmented demand for rover technology.
Robotic Arms, constituting the second major segment, are primarily utilized for assembly tasks and maintenance in space environments. Their precision and dexterity are crucial for complex operations, particularly on space stations. Space Probes, which encompass unmanned spacecraft designed for deep space exploration, also represent a significant segment, offering invaluable data on celestial bodies.
Other Types, including satellites and drones, contribute to the overall growth of the AI in Space Exploration Market by expanding capabilities in monitoring and communication. Collectively, these segments illustrate the diverse applications of AI technologies in enhancing exploration strategies and outcomes within the aerospace sector.
By Application Analysis
In 2023, Robotics dominated AI applications in space exploration advancements.
In 2023, Robotics held a dominant market position in the By Application segment of the AI in Space Exploration Market. The integration of advanced robotics technology has significantly enhanced operational efficiency and precision in various space exploration tasks. This sector benefits from autonomous robotic systems, which are essential for conducting complex missions such as planetary exploration and spacecraft maintenance.
Remote Sensing and Monitoring emerged as another critical application, leveraging AI to process vast amounts of data collected from space missions. This technology enables real-time analysis of planetary conditions, facilitating informed decision-making in mission planning and execution.
Data Analytics has gained traction, driven by the need to interpret complex datasets generated during space missions. Advanced analytics tools assist in extracting valuable insights, thereby optimizing mission outcomes.
Asteroid Mining is an emerging application area, where AI-driven robotics plays a pivotal role in the exploration and extraction of valuable resources from asteroids, promising significant economic potential for future space endeavors.
Manned Vehicles and Reusable Launch Systems are increasingly incorporating AI to enhance safety and operational capabilities, supporting both crewed missions and cost-effective launches.
Lastly, Communications technology benefits from AI by improving data transmission between space assets and ground stations, ensuring seamless information flow.
By End-user Analysis
In 2023, The Government dominated AI in the space exploration market.
In 2023, The Government Sector held a dominant market position in the "By End-user" segment of the AI in Space Exploration Market, driven by increasing investments in space agencies and national security applications. Government initiatives, particularly from organizations such as NASA, ESA, and ISRO, spearheaded advancements in AI for space missions, enhancing autonomous spacecraft operations, data analytics for planetary research, and orbital debris tracking. This dominance can be attributed to large-scale funding allocations and the strategic importance of AI in enhancing defense capabilities, space-based communications, and Earth observation systems.
In contrast, the commercial sector has exhibited rapid growth, fueled by private space ventures like SpaceX and Blue Origin. The commercialization of AI-driven space technologies, including satellite deployment and space tourism, has gained traction, providing a competitive edge to private enterprises. Collaborations between government space agencies and commercial firms further catalyze innovation. While governments dominate in terms of resources and mission scope, the commercial sector is expected to experience accelerated growth in the coming years, driven by market demand for cost-effective, AI-enhanced space technologies and services.
Key Market Segments
By Type
- Rovers
- Robotic Arms
- Space Probes
- Other Types
By Application
- Robotics
- Remote Sensing and Monitoring
- Data Analytics
- Asteroid Mining
- Manned Vehicles and Reusable Launch
- Communications
- Others
By End-user
- Government
- Commercial
Growth Opportunity
Enhanced Data Processing and Analysis
The increasing volume of data generated by space missions presents significant growth opportunities for the AI in space exploration market. Enhanced data processing capabilities, driven by advanced AI algorithms, allow for real-time analysis and interpretation of vast datasets collected from satellites and exploratory missions. As of 2023, it is estimated that satellite data generation will exceed 10 petabytes per day, necessitating robust AI solutions for efficient data management and extraction of actionable insights. The implementation of AI-powered analytics tools is expected to improve mission outcomes by enabling faster decision-making processes and identifying patterns that may otherwise remain undetected.
Autonomous Operations
The shift towards autonomous operations in space exploration is another critical growth area for AI technologies. Autonomous systems can significantly reduce the need for human intervention, thus minimizing operational risks and costs. The adoption of AI-driven autonomous spacecraft is projected to increase by 30%, facilitating missions to remote or hazardous environments. These autonomous capabilities enhance mission safety, efficiency, and precision, allowing for more complex exploration activities without direct human oversight. Moreover, AI can optimize navigation and resource utilization in real-time, which is essential for long-duration missions such as those targeting Mars.
Latest Trends
Integration of AI-Powered Robots and Autonomous Systems
The integration of AI-powered robots and autonomous systems is anticipated to revolutionize space exploration. These technologies enable real-time data processing and decision-making capabilities, significantly enhancing the efficiency and safety of missions. AI systems are expected to assist in tasks ranging from planetary exploration to satellite maintenance. The use of autonomous drones and robotic rovers will facilitate remote operations on celestial bodies, thus reducing human risk and operational costs. As advancements in machine learning and computer vision continue, the precision and functionality of these systems are projected to improve, leading to more sophisticated exploratory missions.
Increasing the Number of Space Missions and Launches
The increasing number of space missions and launches represents a pivotal trend for the AI in space exploration market. As global interest in space exploration grows, driven by governmental and private sector initiatives, the frequency of launches is expected to rise significantly. This trend is bolstered by the burgeoning commercial space industry, which is poised to leverage AI for mission planning, trajectory optimization, and anomaly detection. With organizations such as NASA and SpaceX undertaking ambitious projects, the demand for AI technologies to support these missions is forecasted to escalate. Consequently, investments in AI-driven solutions are likely to experience substantial growth, reflecting a broader commitment to enhancing space exploration capabilities through technology.
Regional Analysis
North America dominates the AI in space exploration market with a 40% largest market share.
The AI in the space exploration market exhibits significant regional variation, driven by investments, technological advancements, and governmental support. North America dominates the global market, accounting for approximately 40% of the market share. The region’s leadership is fueled by heavy investments from NASA, private space exploration companies like SpaceX, and prominent AI technology firms. The United States contributes substantially to this dominance, with government funding and private sector collaboration accelerating AI innovations in space missions.
Europe holds the second-largest market share, driven by initiatives from the European Space Agency (ESA) and key collaborations between aerospace companies and AI research institutions. The European AI in space exploration market is projected to grow at a steady rate, with an emphasis on satellite technology and planetary exploration.
The Asia Pacific region is emerging as a significant market, with countries like China, Japan, and India increasing their investments in space programs. China’s space program, which includes AI-driven lunar exploration and satellite deployment, positions the region as a key growth area, with market growth expected at a CAGR of 18.5% over the next five years.
In the Middle East & Africa, AI space initiatives are at a nascent stage, but growing interest is observed in countries like the UAE, driven by its space ambitions and partnerships with global technology providers.
Latin America, while smaller in market size, shows gradual progress as nations collaborate with international agencies for satellite-based AI systems.
Key Regions and Countries
North America
- The US
- Canada
- Rest of North America
Europe
- Germany
- France
- The UK
- Spain
- Netherlands
- Russia
- Italy
- Rest of Europe
Asia-Pacific
- China
- Japan
- Singapore
- Thailand
- South Korea
- Vietnam
- India
- New Zealand
- Rest of Asia Pacific
Latin America
- Mexico
- Brazil
- Rest of Latin America
Middle East & Africa
- Saudi Arabia
- South Africa
- UAE
- Rest of the Middle East & Africa
Key Players Analysis
The global AI in Space Exploration market is expected to witness substantial contributions from several key players, driven by their strategic initiatives, technological innovations, and growing investments in AI capabilities.
Lockheed Martin and Northrop Grumman, as established defense contractors, are likely to leverage their expertise in satellite systems and space infrastructure, integrating AI to enhance mission accuracy, automation, and predictive analytics. Airbus, with its extensive aerospace experience, is also expected to focus on AI for optimizing satellite communications and space station management.
IBM and Hewlett Packard Enterprise (HPE) are positioned to capitalize on AI-driven data processing and cloud computing solutions for space missions, enabling more efficient data analysis and decision-making in real-time during space operations. Their expertise in artificial intelligence and high-performance computing will be crucial for handling large datasets generated from space exploration activities.
SpaceX, a leader in private space exploration, is expected to continue pushing the boundaries of AI for autonomous spacecraft, deep space exploration, and AI-guided rockets. Similarly, emerging players like Maxar Technologies, Astroscale, and Planet Labs Inc. are anticipated to advance AI applications for Earth observation, debris management, and satellite imaging.
Smaller players like Capella Space, Iceye, and BlackSky Global are likely to focus on leveraging AI for real-time data acquisition and analysis, particularly in areas like synthetic aperture radar (SAR) technology. Collectively, these companies are expected to drive growth in AI applications within the space exploration market, enhancing operational efficiencies and accelerating scientific discoveries.
Market Key Players
- Lockheed Martin
- Airbus
- IBM
- Northrup Grumman
- Hewlett Packard Enterprise (HPE)
- Thales Group
- Booz Allen Hamilton
- Spacex
- Maxar Technologies Inc.
- Astroscale
- Planet Labs Inc.
- Spire Global
- Iceye
- Capella Space
- Blacksky Global
- Hawkeye 360
- D-Orbit
- Other Key Players
Recent Development
- In June 2024, Slingshot Aerospace, in collaboration with DARPA, developed "Agatha," an AI-enabled system to monitor and predict satellite anomalies. The system uses advanced AI techniques, such as inverse reinforcement learning, to detect malfunctioning satellites or hidden threats in large constellations. Agatha's anomaly detection capabilities are being refined with simulated data for real-world applications.
- In May 2024, The Center for AEroSpace Autonomy Research (CAESAR), supported by corporate partners like Redwire Space and Blue Origin, was launched to enhance spacecraft autonomy through AI. CAESAR focuses on machine learning models for space rendezvous and docking operations, including the development of the Spacecraft Pose estimation Network (SPN) for robust position and orientation detection of spacecraft. This initiative is poised to revolutionize how spacecraft interact autonomously in orbit.
- In January 2024, IBM and NASA launched a partnership to develop the Prithvi weather-climate AI model. This initiative focuses on improving weather and climate predictions by utilizing AI to process vast amounts of Earth science data. The model leverages machine learning to better understand local weather phenomena, making it particularly useful for satellite-based monitoring of planetary conditions.
Report Scope
Report Features Description Market Value (2023) USD 2.5 Billion Forecast Revenue (2033) USD 39.4 Billion CAGR (2024-2032) 32.7% Base Year for Estimation 2023 Historic Period 2016-2023 Forecast Period 2024-2033 Report Coverage Revenue Forecast, Market Dynamics, COVID-19 Impact, Competitive Landscape, Recent Developments Segments Covered By Type (Rovers, Robotic Arms, Space Probes, Other Types), By Application (Robotics, Remote Sensing and Monitoring, Data Analytics, Asteroid Mining, Manned Vehicles and Reusable Launch, Communications, Others), By End-user (Government, Commercial) Regional Analysis North America - The US, Canada, Rest of North America, Europe - Germany, France, The UK, Spain, Italy, Russia, Netherlands, Rest of Europe, Asia-Pacific - China, Japan, South Korea, India, New Zealand, Singapore, Thailand, Vietnam, Rest of Asia Pacific, Latin America - Brazil, Mexico, Rest of Latin America, Middle East & Africa - South Africa, Saudi Arabia, UAE, Rest of Middle East & Africa Competitive Landscape Lockheed Martin, Airbus, IBM, Northrup Grumman, Hewlett Packard Enterprise (HPE), Thales Group, Booz Allen Hamilton, Spacex, Maxar Technologies Inc., Astroscale, Planet Labs Inc., Spire Global, Iceye, Capella Space, Blacksky Global, Hawkeye 360, D-Orbit, Other Key Players Customization Scope Customization for segments, region/country-level will be provided. Moreover, additional customization can be done based on the requirements. Purchase Options We have three licenses to opt for Single User License, Multi-User License (Up to 5 Users), Corporate Use License (Unlimited User and Printable PDF) -
- 1. Executive Summary
- 1.1. Definition
- 1.2. Taxonomy
- 1.3. Research Scope
- 1.4. Key Analysis
- 1.5. Key Findings by Major Segments
- 1.6. Top strategies by Major Players
- 2. Global AI in Space Exploration Market Overview
- 2.1. AI in Space Exploration Market Dynamics
- 2.1.1. Drivers
- 2.1.2. Opportunities
- 2.1.3. Restraints
- 2.1.4. Challenges
- 2.2. Macro-economic Factors
- 2.3. Regulatory Framework
- 2.4. Market Investment Feasibility Index
- 2.5. PEST Analysis
- 2.6. PORTER’S Five Force Analysis
- 2.7. Drivers & Restraints Impact Analysis
- 2.8. Industry Chain Analysis
- 2.9. Cost Structure Analysis
- 2.10. Marketing Strategy
- 2.11. Russia-Ukraine War Impact Analysis
- 2.12. Opportunity Map Analysis
- 2.13. Market Competition Scenario Analysis
- 2.14. Product Life Cycle Analysis
- 2.15. Opportunity Orbits
- 2.16. Manufacturer Intensity Map
- 2.17. Major Companies sales by Value & Volume
- 2.1. AI in Space Exploration Market Dynamics
- 3. Global AI in Space Exploration Market Analysis, Opportunity and Forecast, 2016-2032
- 3.1. Global AI in Space Exploration Market Analysis, 2016-2021
- 3.2. Global AI in Space Exploration Market Opportunity and Forecast, 2023-2032
- 3.3. Global AI in Space Exploration Market Analysis, Opportunity and Forecast, By Type, 2016-2032
- 3.3.1. Global AI in Space Exploration Market Analysis by Type: Introduction
- 3.3.2. Market Size Absolute $ Opportunity Analysis and Forecast, By Type, 2016-2032
- 3.3.3. Rovers
- 3.3.4. Robotic Arms
- 3.3.5. Space Probes
- 3.3.6. Other Types
- 3.4. Global AI in Space Exploration Market Analysis, Opportunity and Forecast, By Application, 2016-2032
- 3.4.1. Global AI in Space Exploration Market Analysis by Application: Introduction
- 3.4.2. Market Size Absolute $ Opportunity Analysis and Forecast, By Application, 2016-2032
- 3.4.3. Robotics
- 3.4.4. Remote Sensing and Monitoring
- 3.4.5. Data Analytics
- 3.4.6. Asteroid Mining
- 3.4.7. Manned Vehicles and Reusable Launch
- 3.4.8. Communications
- 3.4.9. Others
- 3.5. Global AI in Space Exploration Market Analysis, Opportunity and Forecast, By End-user, 2016-2032
- 3.5.1. Global AI in Space Exploration Market Analysis by End-user: Introduction
- 3.5.2. Market Size Absolute $ Opportunity Analysis and Forecast, By End-user, 2016-2032
- 3.5.3. Government
- 3.5.4. Commercial
- 4. North America AI in Space Exploration Market Analysis, Opportunity and Forecast, 2016-2032
- 4.1. North America AI in Space Exploration Market Analysis, 2016-2021
- 4.2. North America AI in Space Exploration Market Opportunity and Forecast, 2023-2032
- 4.3. North America AI in Space Exploration Market Analysis, Opportunity and Forecast, By Type, 2016-2032
- 4.3.1. North America AI in Space Exploration Market Analysis by Type: Introduction
- 4.3.2. Market Size Absolute $ Opportunity Analysis and Forecast, By Type, 2016-2032
- 4.3.3. Rovers
- 4.3.4. Robotic Arms
- 4.3.5. Space Probes
- 4.3.6. Other Types
- 4.4. North America AI in Space Exploration Market Analysis, Opportunity and Forecast, By Application, 2016-2032
- 4.4.1. North America AI in Space Exploration Market Analysis by Application: Introduction
- 4.4.2. Market Size Absolute $ Opportunity Analysis and Forecast, By Application, 2016-2032
- 4.4.3. Robotics
- 4.4.4. Remote Sensing and Monitoring
- 4.4.5. Data Analytics
- 4.4.6. Asteroid Mining
- 4.4.7. Manned Vehicles and Reusable Launch
- 4.4.8. Communications
- 4.4.9. Others
- 4.5. North America AI in Space Exploration Market Analysis, Opportunity and Forecast, By End-user, 2016-2032
- 4.5.1. North America AI in Space Exploration Market Analysis by End-user: Introduction
- 4.5.2. Market Size Absolute $ Opportunity Analysis and Forecast, By End-user, 2016-2032
- 4.5.3. Government
- 4.5.4. Commercial
- 4.6. North America AI in Space Exploration Market Analysis, Opportunity and Forecast, By Country , 2016-2032
- 4.6.1. North America AI in Space Exploration Market Analysis by Country : Introduction
- 4.6.2. Market Size Absolute $ Opportunity Analysis and Forecast, Country , 2016-2032
- 4.6.2.1. The US
- 4.6.2.2. Canada
- 4.6.2.3. Mexico
- 5. Western Europe AI in Space Exploration Market Analysis, Opportunity and Forecast, 2016-2032
- 5.1. Western Europe AI in Space Exploration Market Analysis, 2016-2021
- 5.2. Western Europe AI in Space Exploration Market Opportunity and Forecast, 2023-2032
- 5.3. Western Europe AI in Space Exploration Market Analysis, Opportunity and Forecast, By Type, 2016-2032
- 5.3.1. Western Europe AI in Space Exploration Market Analysis by Type: Introduction
- 5.3.2. Market Size Absolute $ Opportunity Analysis and Forecast, By Type, 2016-2032
- 5.3.3. Rovers
- 5.3.4. Robotic Arms
- 5.3.5. Space Probes
- 5.3.6. Other Types
- 5.4. Western Europe AI in Space Exploration Market Analysis, Opportunity and Forecast, By Application, 2016-2032
- 5.4.1. Western Europe AI in Space Exploration Market Analysis by Application: Introduction
- 5.4.2. Market Size Absolute $ Opportunity Analysis and Forecast, By Application, 2016-2032
- 5.4.3. Robotics
- 5.4.4. Remote Sensing and Monitoring
- 5.4.5. Data Analytics
- 5.4.6. Asteroid Mining
- 5.4.7. Manned Vehicles and Reusable Launch
- 5.4.8. Communications
- 5.4.9. Others
- 5.5. Western Europe AI in Space Exploration Market Analysis, Opportunity and Forecast, By End-user, 2016-2032
- 5.5.1. Western Europe AI in Space Exploration Market Analysis by End-user: Introduction
- 5.5.2. Market Size Absolute $ Opportunity Analysis and Forecast, By End-user, 2016-2032
- 5.5.3. Government
- 5.5.4. Commercial
- 5.6. Western Europe AI in Space Exploration Market Analysis, Opportunity and Forecast, By Country , 2016-2032
- 5.6.1. Western Europe AI in Space Exploration Market Analysis by Country : Introduction
- 5.6.2. Market Size Absolute $ Opportunity Analysis and Forecast, Country , 2016-2032
- 5.6.2.1. Germany
- 5.6.2.2. France
- 5.6.2.3. The UK
- 5.6.2.4. Spain
- 5.6.2.5. Italy
- 5.6.2.6. Portugal
- 5.6.2.7. Ireland
- 5.6.2.8. Austria
- 5.6.2.9. Switzerland
- 5.6.2.10. Benelux
- 5.6.2.11. Nordic
- 5.6.2.12. Rest of Western Europe
- 6. Eastern Europe AI in Space Exploration Market Analysis, Opportunity and Forecast, 2016-2032
- 6.1. Eastern Europe AI in Space Exploration Market Analysis, 2016-2021
- 6.2. Eastern Europe AI in Space Exploration Market Opportunity and Forecast, 2023-2032
- 6.3. Eastern Europe AI in Space Exploration Market Analysis, Opportunity and Forecast, By Type, 2016-2032
- 6.3.1. Eastern Europe AI in Space Exploration Market Analysis by Type: Introduction
- 6.3.2. Market Size Absolute $ Opportunity Analysis and Forecast, By Type, 2016-2032
- 6.3.3. Rovers
- 6.3.4. Robotic Arms
- 6.3.5. Space Probes
- 6.3.6. Other Types
- 6.4. Eastern Europe AI in Space Exploration Market Analysis, Opportunity and Forecast, By Application, 2016-2032
- 6.4.1. Eastern Europe AI in Space Exploration Market Analysis by Application: Introduction
- 6.4.2. Market Size Absolute $ Opportunity Analysis and Forecast, By Application, 2016-2032
- 6.4.3. Robotics
- 6.4.4. Remote Sensing and Monitoring
- 6.4.5. Data Analytics
- 6.4.6. Asteroid Mining
- 6.4.7. Manned Vehicles and Reusable Launch
- 6.4.8. Communications
- 6.4.9. Others
- 6.5. Eastern Europe AI in Space Exploration Market Analysis, Opportunity and Forecast, By End-user, 2016-2032
- 6.5.1. Eastern Europe AI in Space Exploration Market Analysis by End-user: Introduction
- 6.5.2. Market Size Absolute $ Opportunity Analysis and Forecast, By End-user, 2016-2032
- 6.5.3. Government
- 6.5.4. Commercial
- 6.6. Eastern Europe AI in Space Exploration Market Analysis, Opportunity and Forecast, By Country , 2016-2032
- 6.6.1. Eastern Europe AI in Space Exploration Market Analysis by Country : Introduction
- 6.6.2. Market Size Absolute $ Opportunity Analysis and Forecast, Country , 2016-2032
- 6.6.2.1. Russia
- 6.6.2.2. Poland
- 6.6.2.3. The Czech Republic
- 6.6.2.4. Greece
- 6.6.2.5. Rest of Eastern Europe
- 7. APAC AI in Space Exploration Market Analysis, Opportunity and Forecast, 2016-2032
- 7.1. APAC AI in Space Exploration Market Analysis, 2016-2021
- 7.2. APAC AI in Space Exploration Market Opportunity and Forecast, 2023-2032
- 7.3. APAC AI in Space Exploration Market Analysis, Opportunity and Forecast, By Type, 2016-2032
- 7.3.1. APAC AI in Space Exploration Market Analysis by Type: Introduction
- 7.3.2. Market Size Absolute $ Opportunity Analysis and Forecast, By Type, 2016-2032
- 7.3.3. Rovers
- 7.3.4. Robotic Arms
- 7.3.5. Space Probes
- 7.3.6. Other Types
- 7.4. APAC AI in Space Exploration Market Analysis, Opportunity and Forecast, By Application, 2016-2032
- 7.4.1. APAC AI in Space Exploration Market Analysis by Application: Introduction
- 7.4.2. Market Size Absolute $ Opportunity Analysis and Forecast, By Application, 2016-2032
- 7.4.3. Robotics
- 7.4.4. Remote Sensing and Monitoring
- 7.4.5. Data Analytics
- 7.4.6. Asteroid Mining
- 7.4.7. Manned Vehicles and Reusable Launch
- 7.4.8. Communications
- 7.4.9. Others
- 7.5. APAC AI in Space Exploration Market Analysis, Opportunity and Forecast, By End-user, 2016-2032
- 7.5.1. APAC AI in Space Exploration Market Analysis by End-user: Introduction
- 7.5.2. Market Size Absolute $ Opportunity Analysis and Forecast, By End-user, 2016-2032
- 7.5.3. Government
- 7.5.4. Commercial
- 7.6. APAC AI in Space Exploration Market Analysis, Opportunity and Forecast, By Country , 2016-2032
- 7.6.1. APAC AI in Space Exploration Market Analysis by Country : Introduction
- 7.6.2. Market Size Absolute $ Opportunity Analysis and Forecast, Country , 2016-2032
- 7.6.2.1. China
- 7.6.2.2. Japan
- 7.6.2.3. South Korea
- 7.6.2.4. India
- 7.6.2.5. Australia & New Zeland
- 7.6.2.6. Indonesia
- 7.6.2.7. Malaysia
- 7.6.2.8. Philippines
- 7.6.2.9. Singapore
- 7.6.2.10. Thailand
- 7.6.2.11. Vietnam
- 7.6.2.12. Rest of APAC
- 8. Latin America AI in Space Exploration Market Analysis, Opportunity and Forecast, 2016-2032
- 8.1. Latin America AI in Space Exploration Market Analysis, 2016-2021
- 8.2. Latin America AI in Space Exploration Market Opportunity and Forecast, 2023-2032
- 8.3. Latin America AI in Space Exploration Market Analysis, Opportunity and Forecast, By Type, 2016-2032
- 8.3.1. Latin America AI in Space Exploration Market Analysis by Type: Introduction
- 8.3.2. Market Size Absolute $ Opportunity Analysis and Forecast, By Type, 2016-2032
- 8.3.3. Rovers
- 8.3.4. Robotic Arms
- 8.3.5. Space Probes
- 8.3.6. Other Types
- 8.4. Latin America AI in Space Exploration Market Analysis, Opportunity and Forecast, By Application, 2016-2032
- 8.4.1. Latin America AI in Space Exploration Market Analysis by Application: Introduction
- 8.4.2. Market Size Absolute $ Opportunity Analysis and Forecast, By Application, 2016-2032
- 8.4.3. Robotics
- 8.4.4. Remote Sensing and Monitoring
- 8.4.5. Data Analytics
- 8.4.6. Asteroid Mining
- 8.4.7. Manned Vehicles and Reusable Launch
- 8.4.8. Communications
- 8.4.9. Others
- 8.5. Latin America AI in Space Exploration Market Analysis, Opportunity and Forecast, By End-user, 2016-2032
- 8.5.1. Latin America AI in Space Exploration Market Analysis by End-user: Introduction
- 8.5.2. Market Size Absolute $ Opportunity Analysis and Forecast, By End-user, 2016-2032
- 8.5.3. Government
- 8.5.4. Commercial
- 8.6. Latin America AI in Space Exploration Market Analysis, Opportunity and Forecast, By Country , 2016-2032
- 8.6.1. Latin America AI in Space Exploration Market Analysis by Country : Introduction
- 8.6.2. Market Size Absolute $ Opportunity Analysis and Forecast, Country , 2016-2032
- 8.6.2.1. Brazil
- 8.6.2.2. Colombia
- 8.6.2.3. Chile
- 8.6.2.4. Argentina
- 8.6.2.5. Costa Rica
- 8.6.2.6. Rest of Latin America
- 9. Middle East & Africa AI in Space Exploration Market Analysis, Opportunity and Forecast, 2016-2032
- 9.1. Middle East & Africa AI in Space Exploration Market Analysis, 2016-2021
- 9.2. Middle East & Africa AI in Space Exploration Market Opportunity and Forecast, 2023-2032
- 9.3. Middle East & Africa AI in Space Exploration Market Analysis, Opportunity and Forecast, By Type, 2016-2032
- 9.3.1. Middle East & Africa AI in Space Exploration Market Analysis by Type: Introduction
- 9.3.2. Market Size Absolute $ Opportunity Analysis and Forecast, By Type, 2016-2032
- 9.3.3. Rovers
- 9.3.4. Robotic Arms
- 9.3.5. Space Probes
- 9.3.6. Other Types
- 9.4. Middle East & Africa AI in Space Exploration Market Analysis, Opportunity and Forecast, By Application, 2016-2032
- 9.4.1. Middle East & Africa AI in Space Exploration Market Analysis by Application: Introduction
- 9.4.2. Market Size Absolute $ Opportunity Analysis and Forecast, By Application, 2016-2032
- 9.4.3. Robotics
- 9.4.4. Remote Sensing and Monitoring
- 9.4.5. Data Analytics
- 9.4.6. Asteroid Mining
- 9.4.7. Manned Vehicles and Reusable Launch
- 9.4.8. Communications
- 9.4.9. Others
- 9.5. Middle East & Africa AI in Space Exploration Market Analysis, Opportunity and Forecast, By End-user, 2016-2032
- 9.5.1. Middle East & Africa AI in Space Exploration Market Analysis by End-user: Introduction
- 9.5.2. Market Size Absolute $ Opportunity Analysis and Forecast, By End-user, 2016-2032
- 9.5.3. Government
- 9.5.4. Commercial
- 9.6. Middle East & Africa AI in Space Exploration Market Analysis, Opportunity and Forecast, By Country , 2016-2032
- 9.6.1. Middle East & Africa AI in Space Exploration Market Analysis by Country : Introduction
- 9.6.2. Market Size Absolute $ Opportunity Analysis and Forecast, Country , 2016-2032
- 9.6.2.1. Algeria
- 9.6.2.2. Egypt
- 9.6.2.3. Israel
- 9.6.2.4. Kuwait
- 9.6.2.5. Nigeria
- 9.6.2.6. Saudi Arabia
- 9.6.2.7. South Africa
- 9.6.2.8. Turkey
- 9.6.2.9. The UAE
- 9.6.2.10. Rest of MEA
- 10. Global AI in Space Exploration Market Analysis, Opportunity and Forecast, By Region , 2016-2032
- 10.1. Global AI in Space Exploration Market Analysis by Region : Introduction
- 10.2. Market Size Absolute $ Opportunity Analysis and Forecast, By Region , 2016-2032
- 10.2.1. North America
- 10.2.2. Western Europe
- 10.2.3. Eastern Europe
- 10.2.4. APAC
- 10.2.5. Latin America
- 10.2.6. Middle East & Africa
- 11. Global AI in Space Exploration Market Competitive Landscape, Market Share Analysis, and Company Profiles
- 11.1. Market Share Analysis
- 11.2. Company Profiles
- 11.3. Lockheed Martin
- 11.3.1. Company Overview
- 11.3.2. Financial Highlights
- 11.3.3. Product Portfolio
- 11.3.4. SWOT Analysis
- 11.3.5. Key Strategies and Developments
- 11.4. Airbus
- 11.4.1. Company Overview
- 11.4.2. Financial Highlights
- 11.4.3. Product Portfolio
- 11.4.4. SWOT Analysis
- 11.4.5. Key Strategies and Developments
- 11.5. IBM
- 11.5.1. Company Overview
- 11.5.2. Financial Highlights
- 11.5.3. Product Portfolio
- 11.5.4. SWOT Analysis
- 11.5.5. Key Strategies and Developments
- 11.6. Northrup Grumman
- 11.6.1. Company Overview
- 11.6.2. Financial Highlights
- 11.6.3. Product Portfolio
- 11.6.4. SWOT Analysis
- 11.6.5. Key Strategies and Developments
- 11.7. Hewlett Packard Enterprise (HPE)
- 11.7.1. Company Overview
- 11.7.2. Financial Highlights
- 11.7.3. Product Portfolio
- 11.7.4. SWOT Analysis
- 11.7.5. Key Strategies and Developments
- 11.8. Thales Group
- 11.8.1. Company Overview
- 11.8.2. Financial Highlights
- 11.8.3. Product Portfolio
- 11.8.4. SWOT Analysis
- 11.8.5. Key Strategies and Developments
- 11.9. Booz Allen Hamilton
- 11.9.1. Company Overview
- 11.9.2. Financial Highlights
- 11.9.3. Product Portfolio
- 11.9.4. SWOT Analysis
- 11.9.5. Key Strategies and Developments
- 11.10. Spacex
- 11.10.1. Company Overview
- 11.10.2. Financial Highlights
- 11.10.3. Product Portfolio
- 11.10.4. SWOT Analysis
- 11.10.5. Key Strategies and Developments
- 11.11. Maxar Technologies Inc.
- 11.11.1. Company Overview
- 11.11.2. Financial Highlights
- 11.11.3. Product Portfolio
- 11.11.4. SWOT Analysis
- 11.11.5. Key Strategies and Developments
- 11.12. Astroscale
- 11.12.1. Company Overview
- 11.12.2. Financial Highlights
- 11.12.3. Product Portfolio
- 11.12.4. SWOT Analysis
- 11.12.5. Key Strategies and Developments
- 11.13.1. Company Overview
- 11.13.2. Financial Highlights
- 11.13.3. Product Portfolio
- 11.13.4. SWOT Analysis
- 11.13.5. Key Strategies and Developments
- 11.14. Planet Labs Inc.
- 11.14.1. Company Overview
- 11.14.2. Financial Highlights
- 11.14.3. Product Portfolio
- 11.14.4. SWOT Analysis
- 11.14.5. Key Strategies and Developments
- 11.15. Iceye
- 11.15.1. Company Overview
- 11.15.2. Financial Highlights
- 11.15.3. Product Portfolio
- 11.15.4. SWOT Analysis
- 11.15.5. Key Strategies and Developments
- 11.16. Capella Space
- 11.16.1. Company Overview
- 11.16.2. Financial Highlights
- 11.16.3. Product Portfolio
- 11.16.4. SWOT Analysis
- 11.16.5. Key Strategies and Developments
- 11.17. Blacksky Global
- 11.17.1. Company Overview
- 11.17.2. Financial Highlights
- 11.17.3. Product Portfolio
- 11.17.4. SWOT Analysis
- 11.17.5. Key Strategies and Developments
- 11.18. Hawkeye 360
- 11.18.1. Company Overview
- 11.18.2. Financial Highlights
- 11.18.3. Product Portfolio
- 11.18.4. SWOT Analysis
- 11.18.5. Key Strategies and Developments
- 11.19. D-Orbit
- 11.19.1. Company Overview
- 11.19.2. Financial Highlights
- 11.19.3. Product Portfolio
- 11.19.4. SWOT Analysis
- 11.19.5. Key Strategies and Developments
- 11.20. Other Key Players
- 11.20.1. Company Overview
- 11.20.2. Financial Highlights
- 11.20.3. Product Portfolio
- 11.20.4. SWOT Analysis
- 11.20.5. Key Strategies and Developments
- 12. Assumptions and Acronyms
- 13. Research Methodology
- 14. Contact
"
- List of Figures
- "
- Figure 1: Global AI in Space Exploration Market Revenue (US$ Mn) Market Share by Type in 2022
- Figure 2: Global AI in Space Exploration Market Market Attractiveness Analysis by Type, 2016-2032
- Figure 3: Global AI in Space Exploration Market Revenue (US$ Mn) Market Share by Applicationin 2022
- Figure 4: Global AI in Space Exploration Market Market Attractiveness Analysis by Application, 2016-2032
- Figure 5: Global AI in Space Exploration Market Revenue (US$ Mn) Market Share by End-userin 2022
- Figure 6: Global AI in Space Exploration Market Market Attractiveness Analysis by End-user, 2016-2032
- Figure 7: Global AI in Space Exploration Market Revenue (US$ Mn) Market Share by Region in 2022
- Figure 8: Global AI in Space Exploration Market Market Attractiveness Analysis by Region, 2016-2032
- Figure 9: Global AI in Space Exploration Market Market Revenue (US$ Mn) (2016-2032)
- Figure 10: Global AI in Space Exploration Market Market Revenue (US$ Mn) Comparison by Region (2016-2032)
- Figure 11: Global AI in Space Exploration Market Market Revenue (US$ Mn) Comparison by Type (2016-2032)
- Figure 12: Global AI in Space Exploration Market Market Revenue (US$ Mn) Comparison by Application (2016-2032)
- Figure 13: Global AI in Space Exploration Market Market Revenue (US$ Mn) Comparison by End-user (2016-2032)
- Figure 14: Global AI in Space Exploration Market Market Y-o-Y Growth Rate Comparison by Region (2016-2032)
- Figure 15: Global AI in Space Exploration Market Market Y-o-Y Growth Rate Comparison by Type (2016-2032)
- Figure 16: Global AI in Space Exploration Market Market Y-o-Y Growth Rate Comparison by Application (2016-2032)
- Figure 17: Global AI in Space Exploration Market Market Y-o-Y Growth Rate Comparison by End-user (2016-2032)
- Figure 18: Global AI in Space Exploration Market Market Share Comparison by Region (2016-2032)
- Figure 19: Global AI in Space Exploration Market Market Share Comparison by Type (2016-2032)
- Figure 20: Global AI in Space Exploration Market Market Share Comparison by Application (2016-2032)
- Figure 21: Global AI in Space Exploration Market Market Share Comparison by End-user (2016-2032)
- Figure 22: North America AI in Space Exploration Market Revenue (US$ Mn) Market Share by Typein 2022
- Figure 23: North America AI in Space Exploration Market Market Attractiveness Analysis by Type, 2016-2032
- Figure 24: North America AI in Space Exploration Market Revenue (US$ Mn) Market Share by Applicationin 2022
- Figure 25: North America AI in Space Exploration Market Market Attractiveness Analysis by Application, 2016-2032
- Figure 26: North America AI in Space Exploration Market Revenue (US$ Mn) Market Share by End-userin 2022
- Figure 27: North America AI in Space Exploration Market Market Attractiveness Analysis by End-user, 2016-2032
- Figure 28: North America AI in Space Exploration Market Revenue (US$ Mn) Market Share by Country in 2022
- Figure 29: North America AI in Space Exploration Market Market Attractiveness Analysis by Country, 2016-2032
- Figure 30: North America AI in Space Exploration Market Market Revenue (US$ Mn) (2016-2032)
- Figure 31: North America AI in Space Exploration Market Market Revenue (US$ Mn) Comparison by Country (2016-2032)
- Figure 32: North America AI in Space Exploration Market Market Revenue (US$ Mn) Comparison by Type (2016-2032)
- Figure 33: North America AI in Space Exploration Market Market Revenue (US$ Mn) Comparison by Application (2016-2032)
- Figure 34: North America AI in Space Exploration Market Market Revenue (US$ Mn) Comparison by End-user (2016-2032)
- Figure 35: North America AI in Space Exploration Market Market Y-o-Y Growth Rate Comparison by Country (2016-2032)
- Figure 36: North America AI in Space Exploration Market Market Y-o-Y Growth Rate Comparison by Type (2016-2032)
- Figure 37: North America AI in Space Exploration Market Market Y-o-Y Growth Rate Comparison by Application (2016-2032)
- Figure 38: North America AI in Space Exploration Market Market Y-o-Y Growth Rate Comparison by End-user (2016-2032)
- Figure 39: North America AI in Space Exploration Market Market Share Comparison by Country (2016-2032)
- Figure 40: North America AI in Space Exploration Market Market Share Comparison by Type (2016-2032)
- Figure 41: North America AI in Space Exploration Market Market Share Comparison by Application (2016-2032)
- Figure 42: North America AI in Space Exploration Market Market Share Comparison by End-user (2016-2032)
- Figure 43: Western Europe AI in Space Exploration Market Revenue (US$ Mn) Market Share by Typein 2022
- Figure 44: Western Europe AI in Space Exploration Market Market Attractiveness Analysis by Type, 2016-2032
- Figure 45: Western Europe AI in Space Exploration Market Revenue (US$ Mn) Market Share by Applicationin 2022
- Figure 46: Western Europe AI in Space Exploration Market Market Attractiveness Analysis by Application, 2016-2032
- Figure 47: Western Europe AI in Space Exploration Market Revenue (US$ Mn) Market Share by End-userin 2022
- Figure 48: Western Europe AI in Space Exploration Market Market Attractiveness Analysis by End-user, 2016-2032
- Figure 49: Western Europe AI in Space Exploration Market Revenue (US$ Mn) Market Share by Country in 2022
- Figure 50: Western Europe AI in Space Exploration Market Market Attractiveness Analysis by Country, 2016-2032
- Figure 51: Western Europe AI in Space Exploration Market Market Revenue (US$ Mn) (2016-2032)
- Figure 52: Western Europe AI in Space Exploration Market Market Revenue (US$ Mn) Comparison by Country (2016-2032)
- Figure 53: Western Europe AI in Space Exploration Market Market Revenue (US$ Mn) Comparison by Type (2016-2032)
- Figure 54: Western Europe AI in Space Exploration Market Market Revenue (US$ Mn) Comparison by Application (2016-2032)
- Figure 55: Western Europe AI in Space Exploration Market Market Revenue (US$ Mn) Comparison by End-user (2016-2032)
- Figure 56: Western Europe AI in Space Exploration Market Market Y-o-Y Growth Rate Comparison by Country (2016-2032)
- Figure 57: Western Europe AI in Space Exploration Market Market Y-o-Y Growth Rate Comparison by Type (2016-2032)
- Figure 58: Western Europe AI in Space Exploration Market Market Y-o-Y Growth Rate Comparison by Application (2016-2032)
- Figure 59: Western Europe AI in Space Exploration Market Market Y-o-Y Growth Rate Comparison by End-user (2016-2032)
- Figure 60: Western Europe AI in Space Exploration Market Market Share Comparison by Country (2016-2032)
- Figure 61: Western Europe AI in Space Exploration Market Market Share Comparison by Type (2016-2032)
- Figure 62: Western Europe AI in Space Exploration Market Market Share Comparison by Application (2016-2032)
- Figure 63: Western Europe AI in Space Exploration Market Market Share Comparison by End-user (2016-2032)
- Figure 64: Eastern Europe AI in Space Exploration Market Revenue (US$ Mn) Market Share by Typein 2022
- Figure 65: Eastern Europe AI in Space Exploration Market Market Attractiveness Analysis by Type, 2016-2032
- Figure 66: Eastern Europe AI in Space Exploration Market Revenue (US$ Mn) Market Share by Applicationin 2022
- Figure 67: Eastern Europe AI in Space Exploration Market Market Attractiveness Analysis by Application, 2016-2032
- Figure 68: Eastern Europe AI in Space Exploration Market Revenue (US$ Mn) Market Share by End-userin 2022
- Figure 69: Eastern Europe AI in Space Exploration Market Market Attractiveness Analysis by End-user, 2016-2032
- Figure 70: Eastern Europe AI in Space Exploration Market Revenue (US$ Mn) Market Share by Country in 2022
- Figure 71: Eastern Europe AI in Space Exploration Market Market Attractiveness Analysis by Country, 2016-2032
- Figure 72: Eastern Europe AI in Space Exploration Market Market Revenue (US$ Mn) (2016-2032)
- Figure 73: Eastern Europe AI in Space Exploration Market Market Revenue (US$ Mn) Comparison by Country (2016-2032)
- Figure 74: Eastern Europe AI in Space Exploration Market Market Revenue (US$ Mn) Comparison by Type (2016-2032)
- Figure 75: Eastern Europe AI in Space Exploration Market Market Revenue (US$ Mn) Comparison by Application (2016-2032)
- Figure 76: Eastern Europe AI in Space Exploration Market Market Revenue (US$ Mn) Comparison by End-user (2016-2032)
- Figure 77: Eastern Europe AI in Space Exploration Market Market Y-o-Y Growth Rate Comparison by Country (2016-2032)
- Figure 78: Eastern Europe AI in Space Exploration Market Market Y-o-Y Growth Rate Comparison by Type (2016-2032)
- Figure 79: Eastern Europe AI in Space Exploration Market Market Y-o-Y Growth Rate Comparison by Application (2016-2032)
- Figure 80: Eastern Europe AI in Space Exploration Market Market Y-o-Y Growth Rate Comparison by End-user (2016-2032)
- Figure 81: Eastern Europe AI in Space Exploration Market Market Share Comparison by Country (2016-2032)
- Figure 82: Eastern Europe AI in Space Exploration Market Market Share Comparison by Type (2016-2032)
- Figure 83: Eastern Europe AI in Space Exploration Market Market Share Comparison by Application (2016-2032)
- Figure 84: Eastern Europe AI in Space Exploration Market Market Share Comparison by End-user (2016-2032)
- Figure 85: APAC AI in Space Exploration Market Revenue (US$ Mn) Market Share by Typein 2022
- Figure 86: APAC AI in Space Exploration Market Market Attractiveness Analysis by Type, 2016-2032
- Figure 87: APAC AI in Space Exploration Market Revenue (US$ Mn) Market Share by Applicationin 2022
- Figure 88: APAC AI in Space Exploration Market Market Attractiveness Analysis by Application, 2016-2032
- Figure 89: APAC AI in Space Exploration Market Revenue (US$ Mn) Market Share by End-userin 2022
- Figure 90: APAC AI in Space Exploration Market Market Attractiveness Analysis by End-user, 2016-2032
- Figure 91: APAC AI in Space Exploration Market Revenue (US$ Mn) Market Share by Country in 2022
- Figure 92: APAC AI in Space Exploration Market Market Attractiveness Analysis by Country, 2016-2032
- Figure 93: APAC AI in Space Exploration Market Market Revenue (US$ Mn) (2016-2032)
- Figure 94: APAC AI in Space Exploration Market Market Revenue (US$ Mn) Comparison by Country (2016-2032)
- Figure 95: APAC AI in Space Exploration Market Market Revenue (US$ Mn) Comparison by Type (2016-2032)
- Figure 96: APAC AI in Space Exploration Market Market Revenue (US$ Mn) Comparison by Application (2016-2032)
- Figure 97: APAC AI in Space Exploration Market Market Revenue (US$ Mn) Comparison by End-user (2016-2032)
- Figure 98: APAC AI in Space Exploration Market Market Y-o-Y Growth Rate Comparison by Country (2016-2032)
- Figure 99: APAC AI in Space Exploration Market Market Y-o-Y Growth Rate Comparison by Type (2016-2032)
- Figure 100: APAC AI in Space Exploration Market Market Y-o-Y Growth Rate Comparison by Application (2016-2032)
- Figure 101: APAC AI in Space Exploration Market Market Y-o-Y Growth Rate Comparison by End-user (2016-2032)
- Figure 102: APAC AI in Space Exploration Market Market Share Comparison by Country (2016-2032)
- Figure 103: APAC AI in Space Exploration Market Market Share Comparison by Type (2016-2032)
- Figure 104: APAC AI in Space Exploration Market Market Share Comparison by Application (2016-2032)
- Figure 105: APAC AI in Space Exploration Market Market Share Comparison by End-user (2016-2032)
- Figure 106: Latin America AI in Space Exploration Market Revenue (US$ Mn) Market Share by Typein 2022
- Figure 107: Latin America AI in Space Exploration Market Market Attractiveness Analysis by Type, 2016-2032
- Figure 108: Latin America AI in Space Exploration Market Revenue (US$ Mn) Market Share by Applicationin 2022
- Figure 109: Latin America AI in Space Exploration Market Market Attractiveness Analysis by Application, 2016-2032
- Figure 110: Latin America AI in Space Exploration Market Revenue (US$ Mn) Market Share by End-userin 2022
- Figure 111: Latin America AI in Space Exploration Market Market Attractiveness Analysis by End-user, 2016-2032
- Figure 112: Latin America AI in Space Exploration Market Revenue (US$ Mn) Market Share by Country in 2022
- Figure 113: Latin America AI in Space Exploration Market Market Attractiveness Analysis by Country, 2016-2032
- Figure 114: Latin America AI in Space Exploration Market Market Revenue (US$ Mn) (2016-2032)
- Figure 115: Latin America AI in Space Exploration Market Market Revenue (US$ Mn) Comparison by Country (2016-2032)
- Figure 116: Latin America AI in Space Exploration Market Market Revenue (US$ Mn) Comparison by Type (2016-2032)
- Figure 117: Latin America AI in Space Exploration Market Market Revenue (US$ Mn) Comparison by Application (2016-2032)
- Figure 118: Latin America AI in Space Exploration Market Market Revenue (US$ Mn) Comparison by End-user (2016-2032)
- Figure 119: Latin America AI in Space Exploration Market Market Y-o-Y Growth Rate Comparison by Country (2016-2032)
- Figure 120: Latin America AI in Space Exploration Market Market Y-o-Y Growth Rate Comparison by Type (2016-2032)
- Figure 121: Latin America AI in Space Exploration Market Market Y-o-Y Growth Rate Comparison by Application (2016-2032)
- Figure 122: Latin America AI in Space Exploration Market Market Y-o-Y Growth Rate Comparison by End-user (2016-2032)
- Figure 123: Latin America AI in Space Exploration Market Market Share Comparison by Country (2016-2032)
- Figure 124: Latin America AI in Space Exploration Market Market Share Comparison by Type (2016-2032)
- Figure 125: Latin America AI in Space Exploration Market Market Share Comparison by Application (2016-2032)
- Figure 126: Latin America AI in Space Exploration Market Market Share Comparison by End-user (2016-2032)
- Figure 127: Middle East & Africa AI in Space Exploration Market Revenue (US$ Mn) Market Share by Typein 2022
- Figure 128: Middle East & Africa AI in Space Exploration Market Market Attractiveness Analysis by Type, 2016-2032
- Figure 129: Middle East & Africa AI in Space Exploration Market Revenue (US$ Mn) Market Share by Applicationin 2022
- Figure 130: Middle East & Africa AI in Space Exploration Market Market Attractiveness Analysis by Application, 2016-2032
- Figure 131: Middle East & Africa AI in Space Exploration Market Revenue (US$ Mn) Market Share by End-userin 2022
- Figure 132: Middle East & Africa AI in Space Exploration Market Market Attractiveness Analysis by End-user, 2016-2032
- Figure 133: Middle East & Africa AI in Space Exploration Market Revenue (US$ Mn) Market Share by Country in 2022
- Figure 134: Middle East & Africa AI in Space Exploration Market Market Attractiveness Analysis by Country, 2016-2032
- Figure 135: Middle East & Africa AI in Space Exploration Market Market Revenue (US$ Mn) (2016-2032)
- Figure 136: Middle East & Africa AI in Space Exploration Market Market Revenue (US$ Mn) Comparison by Country (2016-2032)
- Figure 137: Middle East & Africa AI in Space Exploration Market Market Revenue (US$ Mn) Comparison by Type (2016-2032)
- Figure 138: Middle East & Africa AI in Space Exploration Market Market Revenue (US$ Mn) Comparison by Application (2016-2032)
- Figure 139: Middle East & Africa AI in Space Exploration Market Market Revenue (US$ Mn) Comparison by End-user (2016-2032)
- Figure 140: Middle East & Africa AI in Space Exploration Market Market Y-o-Y Growth Rate Comparison by Country (2016-2032)
- Figure 141: Middle East & Africa AI in Space Exploration Market Market Y-o-Y Growth Rate Comparison by Type (2016-2032)
- Figure 142: Middle East & Africa AI in Space Exploration Market Market Y-o-Y Growth Rate Comparison by Application (2016-2032)
- Figure 143: Middle East & Africa AI in Space Exploration Market Market Y-o-Y Growth Rate Comparison by End-user (2016-2032)
- Figure 144: Middle East & Africa AI in Space Exploration Market Market Share Comparison by Country (2016-2032)
- Figure 145: Middle East & Africa AI in Space Exploration Market Market Share Comparison by Type (2016-2032)
- Figure 146: Middle East & Africa AI in Space Exploration Market Market Share Comparison by Application (2016-2032)
- Figure 147: Middle East & Africa AI in Space Exploration Market Market Share Comparison by End-user (2016-2032)
"
- List of Tables
- "
- Table 1: Global AI in Space Exploration Market Market Comparison by Type (2016-2032)
- Table 2: Global AI in Space Exploration Market Market Comparison by Application (2016-2032)
- Table 3: Global AI in Space Exploration Market Market Comparison by End-user (2016-2032)
- Table 4: Global AI in Space Exploration Market Revenue (US$ Mn) Comparison by Region (2016-2032)
- Table 5: Global AI in Space Exploration Market Market Revenue (US$ Mn) (2016-2032)
- Table 6: Global AI in Space Exploration Market Market Revenue (US$ Mn) Comparison by Region (2016-2032)
- Table 7: Global AI in Space Exploration Market Market Revenue (US$ Mn) Comparison by Type (2016-2032)
- Table 8: Global AI in Space Exploration Market Market Revenue (US$ Mn) Comparison by Application (2016-2032)
- Table 9: Global AI in Space Exploration Market Market Revenue (US$ Mn) Comparison by End-user (2016-2032)
- Table 10: Global AI in Space Exploration Market Market Y-o-Y Growth Rate Comparison by Region (2016-2032)
- Table 11: Global AI in Space Exploration Market Market Y-o-Y Growth Rate Comparison by Type (2016-2032)
- Table 12: Global AI in Space Exploration Market Market Y-o-Y Growth Rate Comparison by Application (2016-2032)
- Table 13: Global AI in Space Exploration Market Market Y-o-Y Growth Rate Comparison by End-user (2016-2032)
- Table 14: Global AI in Space Exploration Market Market Share Comparison by Region (2016-2032)
- Table 15: Global AI in Space Exploration Market Market Share Comparison by Type (2016-2032)
- Table 16: Global AI in Space Exploration Market Market Share Comparison by Application (2016-2032)
- Table 17: Global AI in Space Exploration Market Market Share Comparison by End-user (2016-2032)
- Table 18: North America AI in Space Exploration Market Market Comparison by Application (2016-2032)
- Table 19: North America AI in Space Exploration Market Market Comparison by End-user (2016-2032)
- Table 20: North America AI in Space Exploration Market Revenue (US$ Mn) Comparison by Country (2016-2032)
- Table 21: North America AI in Space Exploration Market Market Revenue (US$ Mn) (2016-2032)
- Table 22: North America AI in Space Exploration Market Market Revenue (US$ Mn) Comparison by Country (2016-2032)
- Table 23: North America AI in Space Exploration Market Market Revenue (US$ Mn) Comparison by Type (2016-2032)
- Table 24: North America AI in Space Exploration Market Market Revenue (US$ Mn) Comparison by Application (2016-2032)
- Table 25: North America AI in Space Exploration Market Market Revenue (US$ Mn) Comparison by End-user (2016-2032)
- Table 26: North America AI in Space Exploration Market Market Y-o-Y Growth Rate Comparison by Country (2016-2032)
- Table 27: North America AI in Space Exploration Market Market Y-o-Y Growth Rate Comparison by Type (2016-2032)
- Table 28: North America AI in Space Exploration Market Market Y-o-Y Growth Rate Comparison by Application (2016-2032)
- Table 29: North America AI in Space Exploration Market Market Y-o-Y Growth Rate Comparison by End-user (2016-2032)
- Table 30: North America AI in Space Exploration Market Market Share Comparison by Country (2016-2032)
- Table 31: North America AI in Space Exploration Market Market Share Comparison by Type (2016-2032)
- Table 32: North America AI in Space Exploration Market Market Share Comparison by Application (2016-2032)
- Table 33: North America AI in Space Exploration Market Market Share Comparison by End-user (2016-2032)
- Table 34: Western Europe AI in Space Exploration Market Market Comparison by Type (2016-2032)
- Table 35: Western Europe AI in Space Exploration Market Market Comparison by Application (2016-2032)
- Table 36: Western Europe AI in Space Exploration Market Market Comparison by End-user (2016-2032)
- Table 37: Western Europe AI in Space Exploration Market Revenue (US$ Mn) Comparison by Country (2016-2032)
- Table 38: Western Europe AI in Space Exploration Market Market Revenue (US$ Mn) (2016-2032)
- Table 39: Western Europe AI in Space Exploration Market Market Revenue (US$ Mn) Comparison by Country (2016-2032)
- Table 40: Western Europe AI in Space Exploration Market Market Revenue (US$ Mn) Comparison by Type (2016-2032)
- Table 41: Western Europe AI in Space Exploration Market Market Revenue (US$ Mn) Comparison by Application (2016-2032)
- Table 42: Western Europe AI in Space Exploration Market Market Revenue (US$ Mn) Comparison by End-user (2016-2032)
- Table 43: Western Europe AI in Space Exploration Market Market Y-o-Y Growth Rate Comparison by Country (2016-2032)
- Table 44: Western Europe AI in Space Exploration Market Market Y-o-Y Growth Rate Comparison by Type (2016-2032)
- Table 45: Western Europe AI in Space Exploration Market Market Y-o-Y Growth Rate Comparison by Application (2016-2032)
- Table 46: Western Europe AI in Space Exploration Market Market Y-o-Y Growth Rate Comparison by End-user (2016-2032)
- Table 47: Western Europe AI in Space Exploration Market Market Share Comparison by Country (2016-2032)
- Table 48: Western Europe AI in Space Exploration Market Market Share Comparison by Type (2016-2032)
- Table 49: Western Europe AI in Space Exploration Market Market Share Comparison by Application (2016-2032)
- Table 50: Western Europe AI in Space Exploration Market Market Share Comparison by End-user (2016-2032)
- Table 51: Eastern Europe AI in Space Exploration Market Market Comparison by Type (2016-2032)
- Table 52: Eastern Europe AI in Space Exploration Market Market Comparison by Application (2016-2032)
- Table 53: Eastern Europe AI in Space Exploration Market Market Comparison by End-user (2016-2032)
- Table 54: Eastern Europe AI in Space Exploration Market Revenue (US$ Mn) Comparison by Country (2016-2032)
- Table 55: Eastern Europe AI in Space Exploration Market Market Revenue (US$ Mn) (2016-2032)
- Table 56: Eastern Europe AI in Space Exploration Market Market Revenue (US$ Mn) Comparison by Country (2016-2032)
- Table 57: Eastern Europe AI in Space Exploration Market Market Revenue (US$ Mn) Comparison by Type (2016-2032)
- Table 58: Eastern Europe AI in Space Exploration Market Market Revenue (US$ Mn) Comparison by Application (2016-2032)
- Table 59: Eastern Europe AI in Space Exploration Market Market Revenue (US$ Mn) Comparison by End-user (2016-2032)
- Table 60: Eastern Europe AI in Space Exploration Market Market Y-o-Y Growth Rate Comparison by Country (2016-2032)
- Table 61: Eastern Europe AI in Space Exploration Market Market Y-o-Y Growth Rate Comparison by Type (2016-2032)
- Table 62: Eastern Europe AI in Space Exploration Market Market Y-o-Y Growth Rate Comparison by Application (2016-2032)
- Table 63: Eastern Europe AI in Space Exploration Market Market Y-o-Y Growth Rate Comparison by End-user (2016-2032)
- Table 64: Eastern Europe AI in Space Exploration Market Market Share Comparison by Country (2016-2032)
- Table 65: Eastern Europe AI in Space Exploration Market Market Share Comparison by Type (2016-2032)
- Table 66: Eastern Europe AI in Space Exploration Market Market Share Comparison by Application (2016-2032)
- Table 67: Eastern Europe AI in Space Exploration Market Market Share Comparison by End-user (2016-2032)
- Table 68: APAC AI in Space Exploration Market Market Comparison by Type (2016-2032)
- Table 69: APAC AI in Space Exploration Market Market Comparison by Application (2016-2032)
- Table 70: APAC AI in Space Exploration Market Market Comparison by End-user (2016-2032)
- Table 71: APAC AI in Space Exploration Market Revenue (US$ Mn) Comparison by Country (2016-2032)
- Table 72: APAC AI in Space Exploration Market Market Revenue (US$ Mn) (2016-2032)
- Table 73: APAC AI in Space Exploration Market Market Revenue (US$ Mn) Comparison by Country (2016-2032)
- Table 74: APAC AI in Space Exploration Market Market Revenue (US$ Mn) Comparison by Type (2016-2032)
- Table 75: APAC AI in Space Exploration Market Market Revenue (US$ Mn) Comparison by Application (2016-2032)
- Table 76: APAC AI in Space Exploration Market Market Revenue (US$ Mn) Comparison by End-user (2016-2032)
- Table 77: APAC AI in Space Exploration Market Market Y-o-Y Growth Rate Comparison by Country (2016-2032)
- Table 78: APAC AI in Space Exploration Market Market Y-o-Y Growth Rate Comparison by Type (2016-2032)
- Table 79: APAC AI in Space Exploration Market Market Y-o-Y Growth Rate Comparison by Application (2016-2032)
- Table 80: APAC AI in Space Exploration Market Market Y-o-Y Growth Rate Comparison by End-user (2016-2032)
- Table 81: APAC AI in Space Exploration Market Market Share Comparison by Country (2016-2032)
- Table 82: APAC AI in Space Exploration Market Market Share Comparison by Type (2016-2032)
- Table 83: APAC AI in Space Exploration Market Market Share Comparison by Application (2016-2032)
- Table 84: APAC AI in Space Exploration Market Market Share Comparison by End-user (2016-2032)
- Table 85: Latin America AI in Space Exploration Market Market Comparison by Type (2016-2032)
- Table 86: Latin America AI in Space Exploration Market Market Comparison by Application (2016-2032)
- Table 87: Latin America AI in Space Exploration Market Market Comparison by End-user (2016-2032)
- Table 88: Latin America AI in Space Exploration Market Revenue (US$ Mn) Comparison by Country (2016-2032)
- Table 89: Latin America AI in Space Exploration Market Market Revenue (US$ Mn) (2016-2032)
- Table 90: Latin America AI in Space Exploration Market Market Revenue (US$ Mn) Comparison by Country (2016-2032)
- Table 91: Latin America AI in Space Exploration Market Market Revenue (US$ Mn) Comparison by Type (2016-2032)
- Table 92: Latin America AI in Space Exploration Market Market Revenue (US$ Mn) Comparison by Application (2016-2032)
- Table 93: Latin America AI in Space Exploration Market Market Revenue (US$ Mn) Comparison by End-user (2016-2032)
- Table 94: Latin America AI in Space Exploration Market Market Y-o-Y Growth Rate Comparison by Country (2016-2032)
- Table 95: Latin America AI in Space Exploration Market Market Y-o-Y Growth Rate Comparison by Type (2016-2032)
- Table 96: Latin America AI in Space Exploration Market Market Y-o-Y Growth Rate Comparison by Application (2016-2032)
- Table 97: Latin America AI in Space Exploration Market Market Y-o-Y Growth Rate Comparison by End-user (2016-2032)
- Table 98: Latin America AI in Space Exploration Market Market Share Comparison by Country (2016-2032)
- Table 99: Latin America AI in Space Exploration Market Market Share Comparison by Type (2016-2032)
- Table 100: Latin America AI in Space Exploration Market Market Share Comparison by Application (2016-2032)
- Table 101: Latin America AI in Space Exploration Market Market Share Comparison by End-user (2016-2032)
- Table 102: Middle East & Africa AI in Space Exploration Market Market Comparison by Type (2016-2032)
- Table 103: Middle East & Africa AI in Space Exploration Market Market Comparison by Application (2016-2032)
- Table 104: Middle East & Africa AI in Space Exploration Market Market Comparison by End-user (2016-2032)
- Table 105: Middle East & Africa AI in Space Exploration Market Revenue (US$ Mn) Comparison by Country (2016-2032)
- Table 106: Middle East & Africa AI in Space Exploration Market Market Revenue (US$ Mn) (2016-2032)
- Table 107: Middle East & Africa AI in Space Exploration Market Market Revenue (US$ Mn) Comparison by Country (2016-2032)
- Table 108: Middle East & Africa AI in Space Exploration Market Market Revenue (US$ Mn) Comparison by Type (2016-2032)
- Table 109: Middle East & Africa AI in Space Exploration Market Market Revenue (US$ Mn) Comparison by Application (2016-2032)
- Table 110: Middle East & Africa AI in Space Exploration Market Market Revenue (US$ Mn) Comparison by End-user (2016-2032)
- Table 111: Middle East & Africa AI in Space Exploration Market Market Y-o-Y Growth Rate Comparison by Country (2016-2032)
- Table 112: Middle East & Africa AI in Space Exploration Market Market Y-o-Y Growth Rate Comparison by Type (2016-2032)
- Table 113: Middle East & Africa AI in Space Exploration Market Market Y-o-Y Growth Rate Comparison by Application (2016-2032)
- Table 114: Middle East & Africa AI in Space Exploration Market Market Y-o-Y Growth Rate Comparison by End-user (2016-2032)
- Table 115: Middle East & Africa AI in Space Exploration Market Market Share Comparison by Country (2016-2032)
- Table 116: Middle East & Africa AI in Space Exploration Market Market Share Comparison by Type (2016-2032)
- Table 117: Middle East & Africa AI in Space Exploration Market Market Share Comparison by Application (2016-2032)
- Table 118: Middle East & Africa AI in Space Exploration Market Market Share Comparison by End-user (2016-2032)
- 1. Executive Summary
-
- Lockheed Martin
- Airbus
- IBM
- Northrup Grumman
- Hewlett Packard Enterprise (HPE)
- Thales Group
- Booz Allen Hamilton
- Spacex
- Maxar Technologies Inc.
- Astroscale
- Planet Labs Inc.
- Spire Global
- Iceye
- Capella Space
- Blacksky Global
- Hawkeye 360
- D-Orbit
- Other Key Players
Our Clients


View Our Licence Options
