
Global 3D Scanning Market By Scanner Type (Optical Scanners, Laser Scanner And Other), By Technology (Laser Triangulation, Pattern Fringe Triangulation, And Others ), By Range (Medium Range Scanner, Short-Range Scanner, And Others ), Application Analysis (Reverse Engineering, Quality Control, and Other ), By Region And Companies - Industry Segment Outlook, Market Assessment, Competition Scenario, Trends, And Forecast 2023-2032
-
14519
-
May 2023
-
159
-


-
This report was compiled by Vishwa Gaul Vishwa is an experienced market research and consulting professional with over 8 years of expertise in the ICT industry, contributing to over 700 reports across telecommunications, software, hardware, and digital solutions. Correspondence Team Lead- ICT Linkedin | Detailed Market research Methodology Our methodology involves a mix of primary research, including interviews with leading mental health experts, and secondary research from reputable medical journals and databases. View Detailed Methodology Page
-
Quick Navigation
Report Overview
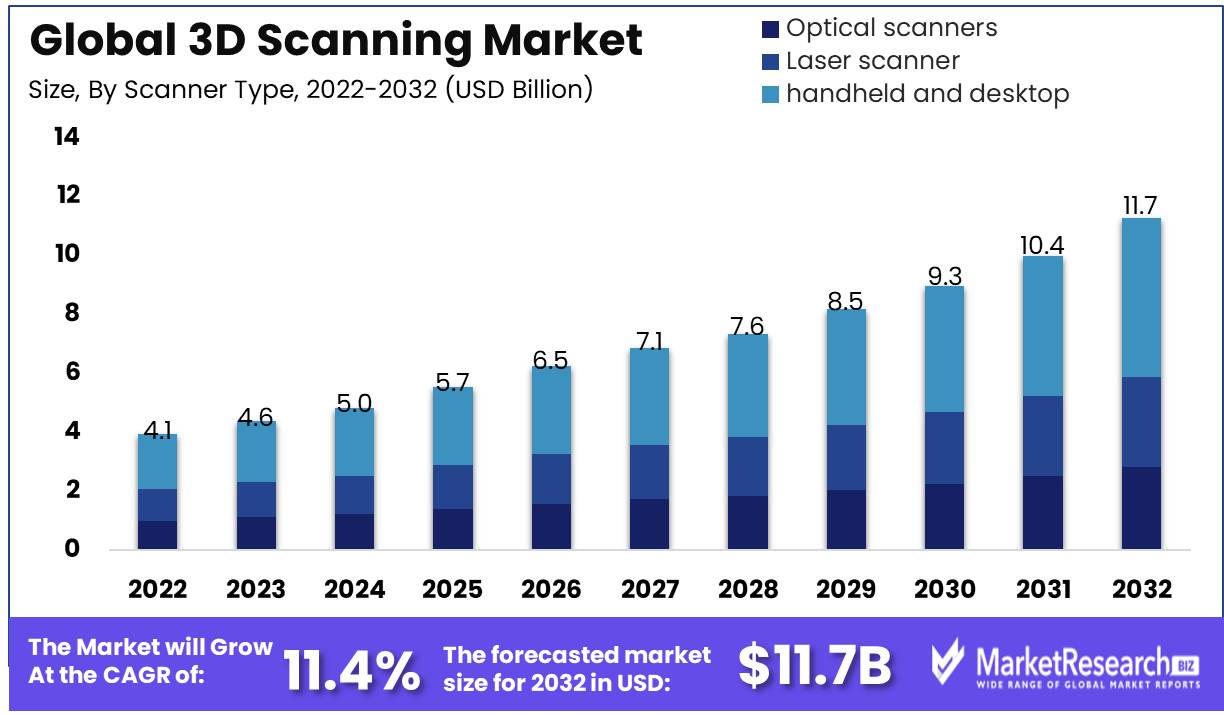
Global 3D scanning Market size is expected to be worth around USD 11.7 Bn by 2032 from USD 4.1 Bn in 2022, growing at a CAGR of 11.4% during the forecast period from 2023 to 2032.
3D scanning Market offers a fascinating look at obtaining digital data about physical objects' shape and size. This mysterious technique opens up many options, from creating immersive 3D models to meticulously inspecting quality control requirements. This technology combines ambiguity and burstiness, leading to creativity and advancement.One must explore the mysterious 3D scanning technology to understand its importance and benefits. Efficient workflows reduce waste and boost production in enterprises. 3D scanning Market's deep details modify design's landscape. Product design precision allows organizations to pursue excellence without compromise.
The insatiable desire for efficiency, precision, and cost-effectiveness drives the growth of 3D scanning technologies into the future. In this arena, applications span industries and conventions. In healthcare, 3D scanning creates custom prosthetics and implants, and in manufacturing, automotive, and aerospace, it ensures meticulous analysis and fault detection.Ethical issues arise in the huge ocean of options, obscuring progress. As 3D scanning technology improves, collecting and storing data on people and objects becomes easier, raising privacy and security concerns. As 3D scanning technology advances, the industry must embrace transparency, explainability, and responsibility.
3D scanning technology's uses in business are astounding, breaking barriers and revitalizing stagnant industries. Immerse yourself in automotive expertise, where every curve of car parts is thoroughly inspected, revealing defects that were previously invisible. In healthcare, 3D scanning technology allows humans to design custom prosthetics and implants that fit the human body. Enter the world of computer-generated visuals and captivating special effects, created by talent and technology.
In this symphony of invention, 3D scanning technology in production is impressive. 3D scanners methodically create digital copies of objects before they are physically created. This revolutionary technique reduces production costs by early identification of potential flaws, guaranteeing each creation is flawless. 3D scanning technology is shaping the future of healthcare by creating personalised prosthetics and implants that combine comfort and functionality.3D scanning technology is a monument to human ingenuity and perseverance. Its intricate details and brilliant flashes fascinate the mind and invite us to explore the unknown. Each development reveals more complexity and diversity, revealing the tangible world's mysteries.
As 3D scanning technology evolves, the symphony of bewilderment and burstiness crescendos, harmonizing human creativity and AI precision. Content creation's full potential lies in balancing complexity and variance to capture human expression. We explore the 3D scanning Market's intricacies and unlimited possibilities. From manufacturing's microscopic quality control to healthcare's life-changing discoveries, 3D scanning Market illuminates the fabric of industries.This technology is amazing, but it also raises moral and ethical questions. We consider the delicate balance between innovation and responsibility and urge the industry to employ 3D scanning technology with transparency, accountability, and conscientiousness.
Driving Factors
High-quality, precise 3D models are in demand
The rise in popularity of 3D printing and technological improvements have both contributed to an increase in demand for high-quality and accurate 3D models, which has been one of the primary drivers. This need has been fueled, in part, by advancements in technology. This has resulted in greater investment in 3D scanning technologies, which has led to the development of a growing selection of devices that are both advanced and cheap for usage in business and consumer settings. In the rapidly evolving 3D scanning market, the 3D Optical Profiler stands out for its precision and versatility.
3D scanning is used for more quality control and inspection
The expanding usage of 3D scanning technology in quality control and inspection applications has been another significant factor driving the market. These technologies have become a crucial instrument for quality assurance and process improvement in a variety of industries, ranging from manufacturing and engineering to healthcare and aerospace. Their measurements are extremely exact, and their visualizations are quite comprehensive.
Increased demand for cultural heritage protection and restoration
In addition, the market for 3D scanning has shown to be more attractive in the context of initiatives involving the preservation and restoration of cultural assets. The use of 3D scanning as a technique for the creation of digital models and virtual displays has become increasingly valuable as a result of the growing demand for technologies such as virtual and augmented reality that make it possible to participate in immersive experiences.
Construction monitoring and as-built 3D scanning
The construction industry is yet another sector that has adopted 3D scanning technologies for the purpose of developing as-built models and monitoring the progression of building. Due to its capacity to capture highly exact measurements and visuals, the 3D scanning market has also seen increased adoption in forensic investigations and the reconstruction of crime scenes.
VR/AR apps are getting popular
Alterations in consumer behavior and the emergence of new trends, such as the expanding use of augmented reality and virtual reality technologies, may have a substantial influence on the market for 3D scanning in the years to come. It is probable that there will be an increase in demand for highly precise and detailed 3D models as customers seek ever-more immersive experiences; this desire will further fuel the growth of an already fascinating market.
Restraining Factors
Expensiveness of sophisticated 3D scanning technologies
The excessive cost is one of the primary obstacles to the widespread adoption of advanced 3D scanning technologies. These systems are costly to acquire and maintain, which can be prohibitive for small and medium-sized businesses with limited funds. In addition, the expense of software upgrades and the requirement for specialized equipment can make the investment even more costly.
Lack of standardization in 3D scanning software and technology
Lack of standardization in technology and software is also a significant factor restraining the 3D scanning market. This issue complicates the process of comparing and evaluating various systems, making it difficult for users to identify the solution that best meets their requirements. In addition, differences between systems may influence the precision of the results obtained from 3D scanning technology, leading to the possibility of inconsistencies.
Limited availability of qualified personnel
Professionals with uncommonly specialized skills are in high demand in the 3D scanning market. Complexity of the technology necessitates advanced knowledge, specialized training, and operational and maintenance expertise. Companies that wish to implement 3D scanning face a challenge due to the limited availability of skilled professionals, especially if they cannot afford to hire trained personnel, resulting in a growing skills gap in the industry.
Concerning legal and ethical issues encircling 3D scanning
Optical 3D scanning Market has encountered legal and ethical concerns regarding privacy and security issues. As the technology enables the accumulation of granular data, it can raise concerns regarding data protection and usage rights, which may have legal or ethical repercussions. It is essential to take precautions when handling personal information to avoid violating privacy regulations.
There is limited compatibility between 3D scanning software and other CAD and CAM programs.
The last major drawback of 3D scanning technology is its limited compatibility with other CAD and CAM software. The incompatibilities create issues for users who employ multiple CAD or CAM software, as the models obtained from 3D scanning may not be compatible with their existing platforms, resulting in productivity- and cost-reducing compatibility issues.
Type of Scanner Analysis
The handheld and desktop segment of the swiftly expanding 3D scanning market has risen to prominence and become an indispensable tool for numerous industries. This analysis will delve deeper into this market segment's economic development, consumer behavior, and future growth potential in the coming years.
The handheld and desktop segment has dominated the 3D scanning market in recent years. The segment has captured a significant portion of the market due to its user-friendly characteristics, simplicity of operation, and outstanding performance. This market segment offers greater adaptability, portability, and affordability, which has contributed to its skyrocketing popularity.The handheld and desktop segment is adaptable and capable of scanning objects from a variety of angles, making it suitable for a vast array of applications. Additionally, its portability makes it an ideal option for users who frequently travel. In addition, it provides high-resolution scans with high precision, producing results that are superior to those of its competitors.Various industries have adopted 3D scanning technology due to the economic growth of emerging economies. Developing
Technology Analysis
Due to its high accuracy and precision, the structured light laser segment has dominated the 3D scanning market. This technology is suitable for industrial applications because it uses laser light to scan objects and record their physical aspect, size, and shape.The economic growth of emergent economies has been crucial to the spread of structured light laser technology. Its efficacy, velocity, and precision have enhanced manufacturing processes, resulting in optimal utilization of resources, time, and decreased production costs.
Especially in industries requiring high accuracy and precision, such as the automotive and aerospace industries, consumer trends and behavior regarding the structured light laser segment have increased significantly. In addition, there has been an increase in demand for more precise and efficient 3D scanning technology in quality control processes.Explaining Why the Structured Light Laser Segment of the 3D Scanning Market is Anticipated to Experience the Highest CAGR over the Next Few Years
In comparison to other 3D scanning technologies, the structured light laser segment is anticipated to experience the highest development rate in the coming years due to its high accuracy, enhanced efficiency, and speed. In addition, technological advancements and the rising demand for quality control in manufacturing processes are anticipated to fuel the expansion of this market.
Application Analysis
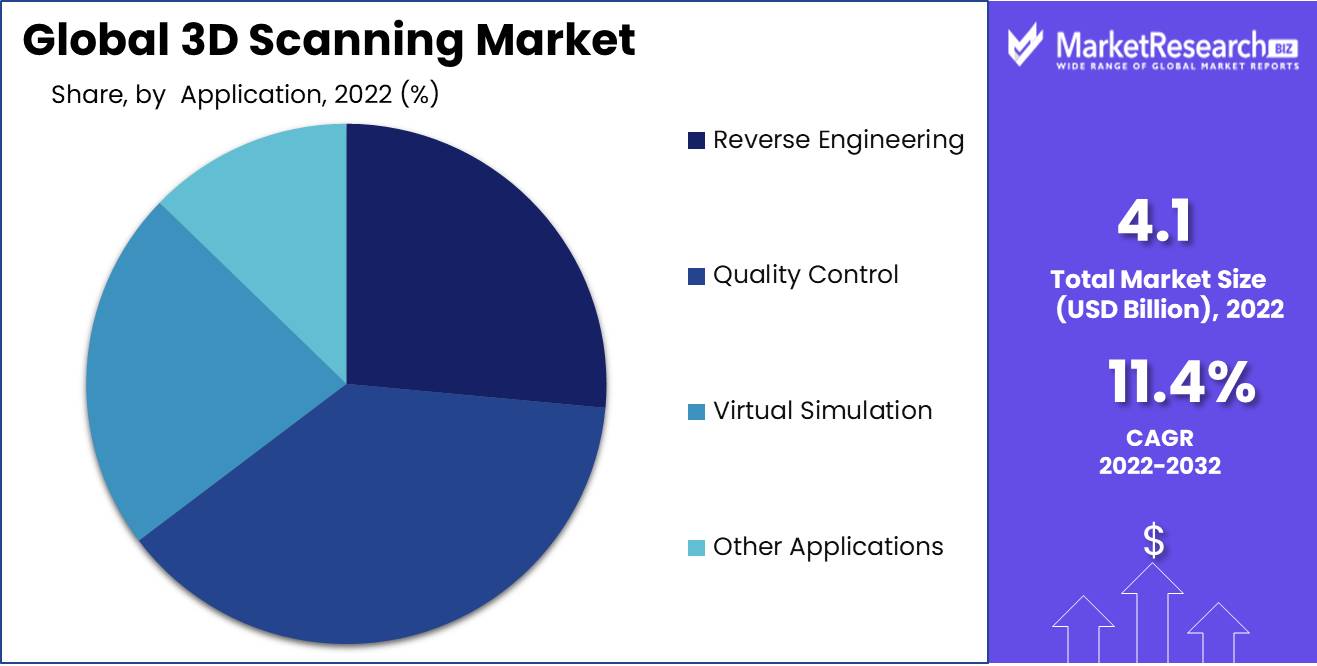
The quality control segment dominates the 3D scanning market, with an increasing number of businesses using this technology to ensure product quality and consistency.In the emerging economies, notably in China, India, and Brazil, quality control has become an indispensable aspect of manufacturing processes. The expansion of the nation's manufacturing industry has highlighted the significance of 3D scanning technology in quality control procedures.
The significance of product quality, consistency, and dependability drives consumer trends toward the quality control segment. It is necessary to provide high-quality products to acquire customer loyalty and increase business revenue.Due to its significance in manufacturing processes, it is anticipated that the quality control segment of the 3D scanning market will exhibit the highest growth rate over the next few years. The segment provides a non-invasive method for examining products and ensuring their precision and uniformity. Increasing demand for high-quality products and technological advances in 3D scanning will further propel the expansion of this market segment.
Analyses of End-User Industries
The automotive, aerospace, healthcare, and construction industries dominate the 3D scanning market due to their high demand for 3D scanning technology to increase their productivity and efficiency.Automotive, healthcare, and construction industries have increased their demand for 3D scanning technology as a result of the economic growth in emerging economies. Particularly in China and India, which have become the world's greatest markets for automobiles, the automotive industry in emerging economies has grown significantly.
Consumer trends in the automotive, aerospace, healthcare, and construction segment indicate a growing demand for 3D scanning technology to improve production accuracy and speed. This has led to an increase in 3D scanning technology adoption in these industries.Explanation of Why the Automotive, Aerospace, Healthcare, and Construction Segment of the 3D Scanning Market is Anticipated to Experience the Highest CAGR in the Coming Years
In the coming years, the segments of automotive, aerospace, healthcare, and construction are anticipated to experience the highest growth rates. Given the significance of 3D scanning in product development, quality control, and reverse engineering, it is anticipated that the expansion of these industries will increase the demand for this technology. Technology advancements and the growing adoption of 3D scanning technology in these industries will continue to fuel the expansion of this market.
Key Market Segments
By Scanner Type
- Optical scanners
- Laser scanner
- handheld and desktop
By Technology
- Laser Triangulation
- Pattern Fringe Triangulation
- Laser Pulse Based
- Laser Phase-shift Based
- structured light laser
By Range
- Medium range scanner
- Short-range scanner
- Long-range scanner
By Services
- Reverse engineering
- Quality inspection
- Rapid prototyping
- Face body scanning
Application Analysis
- Reverse Engineering
- Quality Control
- Virtual Simulation
- Other Applications
By Industry
- Entertainment & media
- Aerospace & defense
- Healthcare
- Civil & architecture
- Industrial manufacturing
- Energy & Power
- Mining
- Artifact & Heritage Preservation
- Others
Growth Opportunity
3D scanning for customized pharmaceutical and medical device manufacture in healthcare is growing
In recent years, the healthcare industry has swiftly adopted 3D scanning technology. Doctors can obtain precise measurements of a patient's body parts or organs, providing them with an accurate representation of the patient's anatomy, using this technology for personalized medicine.In addition, the 3D scanning market is extensively utilized in the production of medical devices, where precise measurements are essential. Using 3D scanning technology, manufacturers can readily create models of medical devices, which facilitates the production of customized devices that meet the specific needs of individual patients.
3D scanning for online goods sales is rising.
E-commerce companies have also employed 3D scanning technology to enhance the online purchasing experience for customers. Customers can gain a better comprehension of a product's features, size, and shape when 3D models are created.Using 3D scanning Market, businesses can also create virtual reality environments in which customers can experience the product in real time, thereby enhancing customer engagement and product comprehension. This has resulted in increased sales and levels of consumer satisfaction.
3D scanning in education for dynamic, immersive learning settings
3D scanning Market has been used in the education industry to create interactive and immersive learning environments. Teachers can use 3D models to elucidate complicated concepts and increase student engagement.In addition, the 3D scanning market has been used to create accurate replicas of historical sites and artifacts, allowing students to gain a deeper understanding of history and culture.
3D scanning for robotics and automation object recognition and monitoring is growing.
Utilizing 3D scanning technology, the robotics and automation industry has enhanced object recognition and monitoring. With 3D scanning Market, robots can identify and track objects more precisely, allowing them to perform their duties more efficiently and precisely.In addition, 3D scanning Market has been utilized to create highly accurate digital replicas of real-world objects, which can be used to teach robotics to accurately recognize and interact with physical objects.
Gaming companies are increasingly using 3D scanning to generate realistic 3D settings and characters.
The gaming industry has utilized 3D scanning technology to create 3D environments and characters that are genuine. Using 3D scanning Market, game developers are able to construct highly accurate models of real-world objects, people, and environments, providing a more immersive and engaging experience for players.In addition, 3D scanning Market has been utilized to create highly realistic virtual reality environments in which players can interact with the game's environment and characters in real time.
Latest Trends
Significant Market Tendencies in 3D Scanning Technology
As the world of 3D scanning technology continues to develop, we are observing a number of significant market-driving trends. With the increasing use of artificial intelligence (AI) and machine learning (ML) algorithms, the development of handheld and portable 3D scanners, and the increasing adoption of cloud-based scanning software, the market is currently being shaped by a number of intriguing new developments.
Intelligence Artificial and Machine Learning in 3D Scanning
Utilizing AI and ML algorithms to automate the processing and analysis of digitized data is one of the most significant developments in 3D scanning technology. Using these cutting-edge technologies, 3D scanning software can identify and eliminate errors in scanned data, optimize the scanning process, and even generate complete 3D models from raw data.
Portable and Handheld Scanners
The development of lightweight, handheld, and portable scanners for use in a variety of applications is a significant trend in 3D scanning technology. These devices are intended to be portable and usable in a variety of domestic and outdoor environments. This makes them ideal for the construction industry, where they can be used to scan construction sites, and the medical field, where they can be used to scan patients on the go.
Cloud-based Software for Scanning
Cloud-based 3D scanning software that can be accessed from anywhere is becoming increasingly popular as the number of businesses and individuals seeking collaboration rises. Individuals can access scanned data from multiple devices, without the need for specialized software, making it simpler for teams to collaborate on large-scale 3D scanning projects.
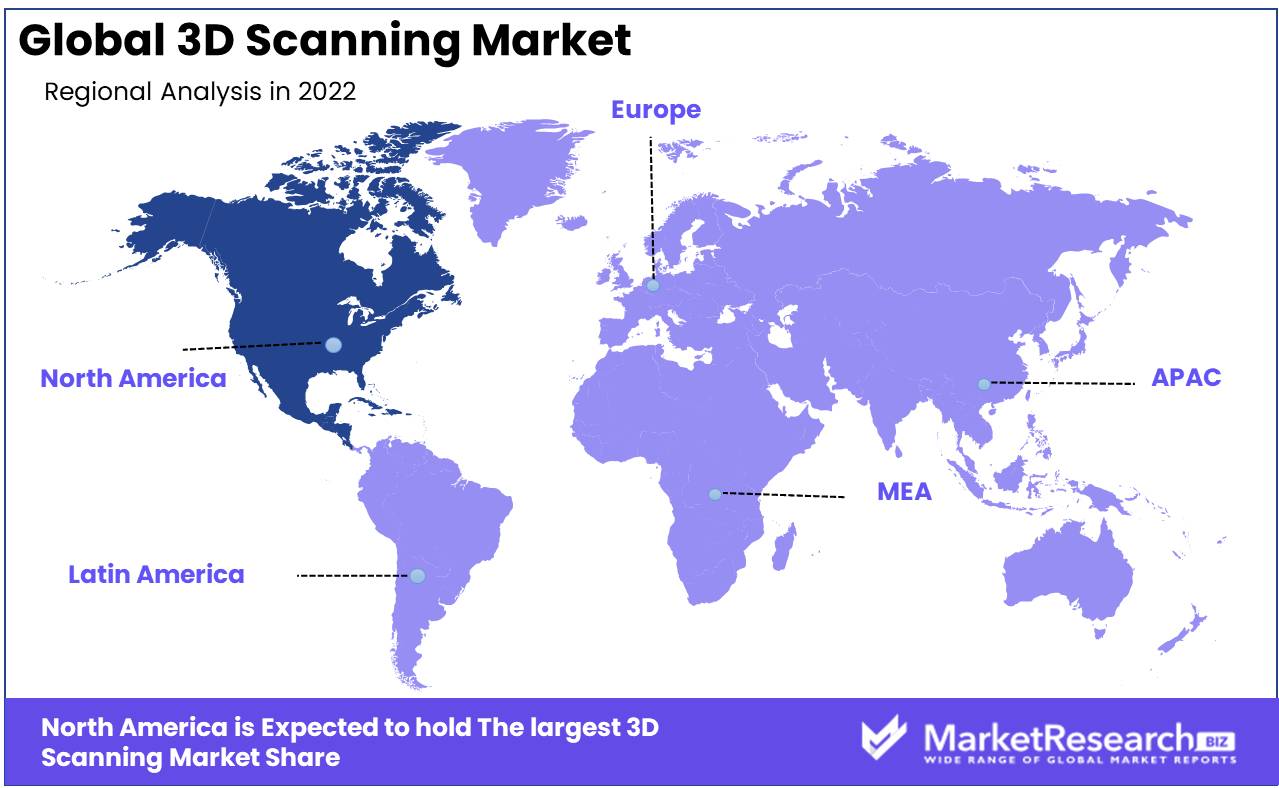
Regional Analysis
North America is a prominent 3D scanning market due to major market participants and high adoption rates, especially in aerospace and healthcare. This essay will explain why North America is the largest 3D scanning market.Major market players dominate North American 3D scanning. 3D Systems, Faro Technologies, and Hexagon Manufacturing Intelligence are promoting 3D scanning in the region. These companies have extensively invested in R&D, making technology inexpensive and accessible to diverse industries. These enterprises also improve their products, increasing 3D scanning technology demand.
Aerospace and healthcare adoption rates are another reason the North American market leads in 3D scanning technologies. Before flying, aerospace products need precise scans. Aerospace businesses now favor 3D scanning for data acquisition. The technology can accurately measure complicated parts and components and rapidly enhance manufacturing processes and spot flaws.North American healthcare uses 3D scanning technologies too. Orthopedics, dentistry, and plastic surgery employ the technology. 3D scanning technology improves diagnosis accuracy over traditional approaches. It creates comprehensive body scans for prosthetics, implants, and other medical devices.
Recent advances in 3D scanning technology have also helped North America adopt the technology. More precise and efficient scanners make it easier for firms to adopt the technology. Software and data management systems have improved data storage and analysis, enabling faster decision-making and better results. These advancements made 3D scanning technology available to more sectors.
Key Regions and Countries
North America
- US
- Canada
- Mexico
Western Europe
- Germany
- France
- The UK
- Spain
- Italy
- Portugal
- Ireland
- Austria
- Switzerland
- Benelux
- Nordic
- Rest of Western Europe
Eastern Europe
- Russia
- Poland
- The Czech Republic
- Greece
- Rest of Eastern Europe
APAC
- China
- Japan
- South Korea
- India
- Australia & New Zealand
- Indonesia
- Malaysia
- Philippines
- Singapore
- Thailand
- Vietnam
- Rest of APAC
Latin America
- Brazil
- Colombia
- Chile
- Argentina
- Costa Rica
- Rest of Latin America
Middle East & Africa
- Algeria
- Egypt
- Israel
- Kuwait
- Nigeria
- Saudi Arabia
- South Africa
- Turkey
- United Arab Emirates
- Rest of MEA
Key Players Analysis
The 3D scanning market is one of the fastest-growing IT markets. There are many major players seeking for market share. These companies offer several products and services to suit customer needs.Hexagon AB, a market leader, supplies high-tech 3D scanning products for aerospace, automotive, and industrial manufacture. Scanners, coordinate measuring devices, and metrology software are their products.
FARO Technologies, Inc. leads the 3D scanning market. The company offers construction BIM and laser scanning software and technology for 3D measurement and imaging in industrial and construction applications.Nikon Metrology, GOM GmbH, Creaform Inc., and Shining 3D also dominate the 3D scanning market. Each company sells different products and services to different markets. They all have customized industry solutions to fulfill consumer needs.
Top Key Players in 3D scanning Market
- Faro Technologies, Inc.
- Creaform, Inc.
- Direct Dimensions, Inc.
- GOM GmbH
- Konica Minolta, Inc.
- 3D Digital Corporation
- Autodesk, Inc.
- 3D Systems, Inc.
- Shape Grabber
- Maptek Pty Ltd.
Recent Development
Technological advances and company acquisitions have changed the 3D scanning market this year. Artec 3D, a leading provider of professional 3D scanning and image solutions, announced the Artec Ray 2 LIDAR scanner for industrial 3D scanning. This precision scanner is impressive for many sectors.
In August 2021, Hexagon AB revealed that it would buy PAS Technology. This would allow them to offer even more comprehensive non-destructive testing (NDT) solutions based on 3D scanning. PAS Technology is a well-known provider of 3D scanning-based NDT solutions for the construction and oil and gas industries.
In July 2021 introduction of Shining 3D's EinScan HX Pro multi-functional portable 3D scanner is another noteworthy advancement in the 3D scanning market. This scanner has incredibly fast scanning speeds and advanced data processing capabilities, allowing users to effortlessly generate high-quality scans.
In June 2021, Creaform released the HandySCAN 3D SILVER Series, a portable 3D scanner for inspection and reverse engineering. For effective scanning, this scanner is lightweight and portable.Autodesk's acquisition of Upchain, a cloud-based PLM provider featuring 3D scanning and modeling, garnered news. Autodesk can now offer more 3D scanning and modeling services thanks to this acquisition.
Report Scope
Report Features Description Market Value (2022) USD 4.1 Bn Forecast Revenue (2032) USD 11,7 Bn CAGR (2023-2032) 11.4% Base Year for Estimation 2022 Historic Period 2016-2022 Forecast Period 2023-2032 Report Coverage Revenue Forecast, Market Dynamics, COVID-19 Impact, Competitive Landscape, Recent Developments Segments Covered By Scanner Type (Optical scanners, Laser scanner, handheld and desktop), By Technology (Laser Triangulation, Pattern Fringe Triangulation, Laser Pulse Based, Laser Phase-shift Based, structured light laser), By Range (Medium range scanner, Short-range scanner, Long-range scanner), By Services (Reverse engineering, Quality inspection, Rapid prototyping, Face body scanning), Application Analysis (Reverse Engineering, Quality Control, Virtual Simulation, Other Applications), By Industry (Entertainment & media, Aerospace & defense, Healthcare, Civil & architecture, Industrial manufacturing, Energy & Power, Mining, Artifact & Heritage Preservation, Others) Regional Analysis North America – The US, Canada, & Mexico; Western Europe – Germany, France, The UK, Spain, Italy, Portugal, Ireland, Austria, Switzerland, Benelux, Nordic, & Rest of Western Europe; Eastern Europe – Russia, Poland, The Czech Republic, Greece, & Rest of Eastern Europe; APAC – China, Japan, South Korea, India, Australia & New Zealand, Indonesia, Malaysia, Philippines, Singapore, Thailand, Vietnam, & Rest of APAC; Latin America – Brazil, Colombia, Chile, Argentina, Costa Rica, & Rest of Latin America; Middle East & Africa – Algeria, Egypt, Israel, Kuwait, Nigeria, Saudi Arabia, South Africa, Turkey, United Arab Emirates, & Rest of MEA Competitive Landscape Faro Technologies Inc., Creaform, Inc., Direct Dimensions Inc., GOM GmbH, Konica Minolta Inc., 3D Digital Corporation, Autodesk Inc., 3D Systems Inc., Shape Grabber, Maptek Pty Ltd. Customization Scope Customization for segments, region/country-level will be provided. Moreover, additional customization can be done based on the requirements. Purchase Options We have three licenses to opt for: Single User License, Multi-User License (Up to 5 Users), Corporate Use License (Unlimited User and Printable PDF) -
- 1. Executive Summary
- 1.1. Definition
- 1.2. Taxonomy
- 1.3. Research Scope
- 1.4. Key Analysis
- 1.5. Key Findings by Major Segments
- 1.6. Top strategies by Major Players
- 2. Global 3D Scanning Market Overview
- 2.1. 3D Scanning Market Dynamics
- 2.1.1. Drivers
- 2.1.2. Opportunities
- 2.1.3. Restraints
- 2.1.4. Challenges
- 2.2. Macro-economic Factors
- 2.3. Regulatory Framework
- 2.4. Market Investment Feasibility Index
- 2.5. PEST Analysis
- 2.6. PORTER’S Five Force Analysis
- 2.7. Drivers & Restraints Impact Analysis
- 2.8. Industry Chain Analysis
- 2.9. Cost Structure Analysis
- 2.10. Marketing Strategy
- 2.11. Russia-Ukraine War Impact Analysis
- 2.12. Opportunity Map Analysis
- 2.13. Market Competition Scenario Analysis
- 2.14. Product Life Cycle Analysis
- 2.15. Opportunity Orbits
- 2.16. Manufacturer Intensity Map
- 2.17. Major Companies sales by Value & Volume
- 2.1. 3D Scanning Market Dynamics
- 3. Global 3D Scanning Market Analysis, Opportunity and Forecast, 2016-2032
- 3.1. Global 3D Scanning Market Analysis, 2016-2021
- 3.2. Global 3D Scanning Market Opportunity and Forecast, 2023-2032
- 3.3. Global 3D Scanning Market Analysis, Opportunity and Forecast, By By Scanner Type, 2016-2032
- 3.3.1. Global 3D Scanning Market Analysis by By Scanner Type: Introduction
- 3.3.2. Market Size Absolute $ Opportunity Analysis and Forecast, By By Scanner Type, 2016-2032
- 3.3.5. Optical scanners
- 3.3.6. Laser scanner
- 3.3.7. handheld and desktop
- 3.4. Global 3D Scanning Market Analysis, Opportunity and Forecast, By By Range, 2016-2032
- 3.4.1. Global 3D Scanning Market Analysis by By Range: Introduction
- 3.4.2. Market Size Absolute $ Opportunity Analysis and Forecast, By By Range, 2016-2032
- 3.4.3. Medium range scanner
- 3.4.4. Short-range scanner
- 3.4.5. Long-range scanner
- 3.5. Global 3D Scanning Market Analysis, Opportunity and Forecast, By By Services, 2016-2032
- 3.5.1. Global 3D Scanning Market Analysis by By Services: Introduction
- 3.5.2. Market Size Absolute $ Opportunity Analysis and Forecast, By By Services, 2016-2032
- 3.5.4. Reverse engineering
- 3.5.5. Quality inspection
- 3.5.6. Rapid prototyping
- 3.5.7. Face body scanning
- 3.6. Global 3D Scanning Market Analysis, Opportunity and Forecast, By Application Analysis, 2016-2032
- 3.6.1. Global 3D Scanning Market Analysis by Application Analysis: Introduction
- 3.6.2. Market Size Absolute $ Opportunity Analysis and Forecast, By Application Analysis, 2016-2032
- 3.6.3. Reverse Engineering
- 3.6.4. Quality Control
- 3.6.5. Virtual Simulation
- 3.6.6. Other Applications
- 3.7. Global 3D Scanning Market Analysis, Opportunity and Forecast, By By Industry, 2016-2032
- 3.7.1. Global 3D Scanning Market Analysis by By Industry: Introduction
- 3.7.2. Market Size Absolute $ Opportunity Analysis and Forecast, By By Industry, 2016-2032
- 3.7.4. Entertainment & media
- 3.7.5. Aerospace & defense
- 3.7.6. Healthcare
- 3.7.7. Civil & architecture
- 3.7.8. Industrial manufacturing
- 3.7.9. Energy & Power
- 3.7.10. Mining
- 3.7.11. Artifact & Heritage Preservation
- 3.7.12. Others
- 4. North America 3D Scanning Market Analysis, Opportunity and Forecast, 2016-2032
- 4.1. North America 3D Scanning Market Analysis, 2016-2021
- 4.2. North America 3D Scanning Market Opportunity and Forecast, 2023-2032
- 4.3. North America 3D Scanning Market Analysis, Opportunity and Forecast, By By Scanner Type, 2016-2032
- 4.3.1. North America 3D Scanning Market Analysis by By Scanner Type: Introduction
- 4.3.2. Market Size Absolute $ Opportunity Analysis and Forecast, By By Scanner Type, 2016-2032
- 4.3.5. Optical scanners
- 4.3.6. Laser scanner
- 4.3.7. handheld and desktop
- 4.4. North America 3D Scanning Market Analysis, Opportunity and Forecast, By By Range, 2016-2032
- 4.4.1. North America 3D Scanning Market Analysis by By Range: Introduction
- 4.4.2. Market Size Absolute $ Opportunity Analysis and Forecast, By By Range, 2016-2032
- 4.4.3. Medium range scanner
- 4.4.4. Short-range scanner
- 4.4.5. Long-range scanner
- 4.5. North America 3D Scanning Market Analysis, Opportunity and Forecast, By By Services, 2016-2032
- 4.5.1. North America 3D Scanning Market Analysis by By Services: Introduction
- 4.5.2. Market Size Absolute $ Opportunity Analysis and Forecast, By By Services, 2016-2032
- 4.5.4. Reverse engineering
- 4.5.5. Quality inspection
- 4.5.6. Rapid prototyping
- 4.5.7. Face body scanning
- 4.6. North America 3D Scanning Market Analysis, Opportunity and Forecast, By Application Analysis, 2016-2032
- 4.6.1. North America 3D Scanning Market Analysis by Application Analysis: Introduction
- 4.6.2. Market Size Absolute $ Opportunity Analysis and Forecast, By Application Analysis, 2016-2032
- 4.6.3. Reverse Engineering
- 4.6.4. Quality Control
- 4.6.5. Virtual Simulation
- 4.6.6. Other Applications
- 4.7. North America 3D Scanning Market Analysis, Opportunity and Forecast, By By Industry, 2016-2032
- 4.7.1. North America 3D Scanning Market Analysis by By Industry: Introduction
- 4.7.2. Market Size Absolute $ Opportunity Analysis and Forecast, By By Industry, 2016-2032
- 4.7.4. Entertainment & media
- 4.7.5. Aerospace & defense
- 4.7.6. Healthcare
- 4.7.7. Civil & architecture
- 4.7.8. Industrial manufacturing
- 4.7.9. Energy & Power
- 4.7.10. Mining
- 4.7.11. Artifact & Heritage Preservation
- 4.7.12. Others
- 4.CN. North America 3D Scanning Market Analysis, Opportunity and Forecast, By Country , 2016-2032
- 4.CN.1. North America 3D Scanning Market Analysis by Country : Introduction
- 4.CN.2. Market Size Absolute $ Opportunity Analysis and Forecast, Country , 2016-2032
- 4.CN.2.1. The US
- 4.CN.2.2. Canada
- 4.CN.2.3. Mexico
- 5. Western Europe 3D Scanning Market Analysis, Opportunity and Forecast, 2016-2032
- 5.1. Western Europe 3D Scanning Market Analysis, 2016-2021
- 5.2. Western Europe 3D Scanning Market Opportunity and Forecast, 2023-2032
- 5.3. Western Europe 3D Scanning Market Analysis, Opportunity and Forecast, By By Scanner Type, 2016-2032
- 5.3.1. Western Europe 3D Scanning Market Analysis by By Scanner Type: Introduction
- 5.3.2. Market Size Absolute $ Opportunity Analysis and Forecast, By By Scanner Type, 2016-2032
- 5.3.5. Optical scanners
- 5.3.6. Laser scanner
- 5.3.7. handheld and desktop
- 5.4. Western Europe 3D Scanning Market Analysis, Opportunity and Forecast, By By Range, 2016-2032
- 5.4.1. Western Europe 3D Scanning Market Analysis by By Range: Introduction
- 5.4.2. Market Size Absolute $ Opportunity Analysis and Forecast, By By Range, 2016-2032
- 5.4.3. Medium range scanner
- 5.4.4. Short-range scanner
- 5.4.5. Long-range scanner
- 5.5. Western Europe 3D Scanning Market Analysis, Opportunity and Forecast, By By Services, 2016-2032
- 5.5.1. Western Europe 3D Scanning Market Analysis by By Services: Introduction
- 5.5.2. Market Size Absolute $ Opportunity Analysis and Forecast, By By Services, 2016-2032
- 5.5.4. Reverse engineering
- 5.5.5. Quality inspection
- 5.5.6. Rapid prototyping
- 5.5.7. Face body scanning
- 5.6. Western Europe 3D Scanning Market Analysis, Opportunity and Forecast, By Application Analysis, 2016-2032
- 5.6.1. Western Europe 3D Scanning Market Analysis by Application Analysis: Introduction
- 5.6.2. Market Size Absolute $ Opportunity Analysis and Forecast, By Application Analysis, 2016-2032
- 5.6.3. Reverse Engineering
- 5.6.4. Quality Control
- 5.6.5. Virtual Simulation
- 5.6.6. Other Applications
- 5.7. Western Europe 3D Scanning Market Analysis, Opportunity and Forecast, By By Industry, 2016-2032
- 5.7.1. Western Europe 3D Scanning Market Analysis by By Industry: Introduction
- 5.7.2. Market Size Absolute $ Opportunity Analysis and Forecast, By By Industry, 2016-2032
- 5.7.4. Entertainment & media
- 5.7.5. Aerospace & defense
- 5.7.6. Healthcare
- 5.7.7. Civil & architecture
- 5.7.8. Industrial manufacturing
- 5.7.9. Energy & Power
- 5.7.10. Mining
- 5.7.11. Artifact & Heritage Preservation
- 5.7.12. Others
- 5.CN. Western Europe 3D Scanning Market Analysis, Opportunity and Forecast, By Country , 2016-2032
- 5.CN.1. Western Europe 3D Scanning Market Analysis by Country : Introduction
- 5.CN.2. Market Size Absolute $ Opportunity Analysis and Forecast, Country , 2016-2032
- 5.CN.2.1. Germany
- 5.CN.2.2. France
- 5.CN.2.3. The UK
- 5.CN.2.4. Spain
- 5.CN.2.5. Italy
- 5.CN.2.6. Portugal
- 5.CN.2.7. Ireland
- 5.CN.2.8. Austria
- 5.CN.2.9. Switzerland
- 5.CN.2.10. Benelux
- 5.CN.2.11. Nordic
- 5.CN.2.12. Rest of Western Europe
- 6. Eastern Europe 3D Scanning Market Analysis, Opportunity and Forecast, 2016-2032
- 6.1. Eastern Europe 3D Scanning Market Analysis, 2016-2021
- 6.2. Eastern Europe 3D Scanning Market Opportunity and Forecast, 2023-2032
- 6.3. Eastern Europe 3D Scanning Market Analysis, Opportunity and Forecast, By By Scanner Type, 2016-2032
- 6.3.1. Eastern Europe 3D Scanning Market Analysis by By Scanner Type: Introduction
- 6.3.2. Market Size Absolute $ Opportunity Analysis and Forecast, By By Scanner Type, 2016-2032
- 6.3.5. Optical scanners
- 6.3.6. Laser scanner
- 6.3.7. handheld and desktop
- 6.4. Eastern Europe 3D Scanning Market Analysis, Opportunity and Forecast, By By Range, 2016-2032
- 6.4.1. Eastern Europe 3D Scanning Market Analysis by By Range: Introduction
- 6.4.2. Market Size Absolute $ Opportunity Analysis and Forecast, By By Range, 2016-2032
- 6.4.3. Medium range scanner
- 6.4.4. Short-range scanner
- 6.4.5. Long-range scanner
- 6.5. Eastern Europe 3D Scanning Market Analysis, Opportunity and Forecast, By By Services, 2016-2032
- 6.5.1. Eastern Europe 3D Scanning Market Analysis by By Services: Introduction
- 6.5.2. Market Size Absolute $ Opportunity Analysis and Forecast, By By Services, 2016-2032
- 6.5.4. Reverse engineering
- 6.5.5. Quality inspection
- 6.5.6. Rapid prototyping
- 6.5.7. Face body scanning
- 6.6. Eastern Europe 3D Scanning Market Analysis, Opportunity and Forecast, By Application Analysis, 2016-2032
- 6.6.1. Eastern Europe 3D Scanning Market Analysis by Application Analysis: Introduction
- 6.6.2. Market Size Absolute $ Opportunity Analysis and Forecast, By Application Analysis, 2016-2032
- 6.6.3. Reverse Engineering
- 6.6.4. Quality Control
- 6.6.5. Virtual Simulation
- 6.6.6. Other Applications
- 6.7. Eastern Europe 3D Scanning Market Analysis, Opportunity and Forecast, By By Industry, 2016-2032
- 6.7.1. Eastern Europe 3D Scanning Market Analysis by By Industry: Introduction
- 6.7.2. Market Size Absolute $ Opportunity Analysis and Forecast, By By Industry, 2016-2032
- 6.7.4. Entertainment & media
- 6.7.5. Aerospace & defense
- 6.7.6. Healthcare
- 6.7.7. Civil & architecture
- 6.7.8. Industrial manufacturing
- 6.7.9. Energy & Power
- 6.7.10. Mining
- 6.7.11. Artifact & Heritage Preservation
- 6.7.12. Others
- 6.CN. Eastern Europe 3D Scanning Market Analysis, Opportunity and Forecast, By Country , 2016-2032
- 6.CN.1. Eastern Europe 3D Scanning Market Analysis by Country : Introduction
- 6.CN.2. Market Size Absolute $ Opportunity Analysis and Forecast, Country , 2016-2032
- 6.CN.2.1. Russia
- 6.CN.2.2. Poland
- 6.CN.2.3. The Czech Republic
- 6.CN.2.4. Greece
- 6.CN.2.5. Rest of Eastern Europe
- 7. APAC 3D Scanning Market Analysis, Opportunity and Forecast, 2016-2032
- 7.1. APAC 3D Scanning Market Analysis, 2016-2021
- 7.2. APAC 3D Scanning Market Opportunity and Forecast, 2023-2032
- 7.3. APAC 3D Scanning Market Analysis, Opportunity and Forecast, By By Scanner Type, 2016-2032
- 7.3.1. APAC 3D Scanning Market Analysis by By Scanner Type: Introduction
- 7.3.2. Market Size Absolute $ Opportunity Analysis and Forecast, By By Scanner Type, 2016-2032
- 7.3.5. Optical scanners
- 7.3.6. Laser scanner
- 7.3.7. handheld and desktop
- 7.4. APAC 3D Scanning Market Analysis, Opportunity and Forecast, By By Range, 2016-2032
- 7.4.1. APAC 3D Scanning Market Analysis by By Range: Introduction
- 7.4.2. Market Size Absolute $ Opportunity Analysis and Forecast, By By Range, 2016-2032
- 7.4.3. Medium range scanner
- 7.4.4. Short-range scanner
- 7.4.5. Long-range scanner
- 7.5. APAC 3D Scanning Market Analysis, Opportunity and Forecast, By By Services, 2016-2032
- 7.5.1. APAC 3D Scanning Market Analysis by By Services: Introduction
- 7.5.2. Market Size Absolute $ Opportunity Analysis and Forecast, By By Services, 2016-2032
- 7.5.4. Reverse engineering
- 7.5.5. Quality inspection
- 7.5.6. Rapid prototyping
- 7.5.7. Face body scanning
- 7.6. APAC 3D Scanning Market Analysis, Opportunity and Forecast, By Application Analysis, 2016-2032
- 7.6.1. APAC 3D Scanning Market Analysis by Application Analysis: Introduction
- 7.6.2. Market Size Absolute $ Opportunity Analysis and Forecast, By Application Analysis, 2016-2032
- 7.6.3. Reverse Engineering
- 7.6.4. Quality Control
- 7.6.5. Virtual Simulation
- 7.6.6. Other Applications
- 7.7. APAC 3D Scanning Market Analysis, Opportunity and Forecast, By By Industry, 2016-2032
- 7.7.1. APAC 3D Scanning Market Analysis by By Industry: Introduction
- 7.7.2. Market Size Absolute $ Opportunity Analysis and Forecast, By By Industry, 2016-2032
- 7.7.4. Entertainment & media
- 7.7.5. Aerospace & defense
- 7.7.6. Healthcare
- 7.7.7. Civil & architecture
- 7.7.8. Industrial manufacturing
- 7.7.9. Energy & Power
- 7.7.10. Mining
- 7.7.11. Artifact & Heritage Preservation
- 7.7.12. Others
- 7.CN. APAC 3D Scanning Market Analysis, Opportunity and Forecast, By Country , 2016-2032
- 7.CN.1. APAC 3D Scanning Market Analysis by Country : Introduction
- 7.CN.2. Market Size Absolute $ Opportunity Analysis and Forecast, Country , 2016-2032
- 7.CN.2.1. China
- 7.CN.2.2. Japan
- 7.CN.2.3. South Korea
- 7.CN.2.4. India
- 7.CN.2.5. Australia & New Zeland
- 7.CN.2.6. Indonesia
- 7.CN.2.7. Malaysia
- 7.CN.2.8. Philippines
- 7.CN.2.9. Singapore
- 7.CN.2.10. Thailand
- 7.CN.2.11. Vietnam
- 7.CN.2.12. Rest of APAC
- 8. Latin America 3D Scanning Market Analysis, Opportunity and Forecast, 2016-2032
- 8.1. Latin America 3D Scanning Market Analysis, 2016-2021
- 8.2. Latin America 3D Scanning Market Opportunity and Forecast, 2023-2032
- 8.3. Latin America 3D Scanning Market Analysis, Opportunity and Forecast, By By Scanner Type, 2016-2032
- 8.3.1. Latin America 3D Scanning Market Analysis by By Scanner Type: Introduction
- 8.3.2. Market Size Absolute $ Opportunity Analysis and Forecast, By By Scanner Type, 2016-2032
- 8.3.5. Optical scanners
- 8.3.6. Laser scanner
- 8.3.7. handheld and desktop
- 8.4. Latin America 3D Scanning Market Analysis, Opportunity and Forecast, By By Range, 2016-2032
- 8.4.1. Latin America 3D Scanning Market Analysis by By Range: Introduction
- 8.4.2. Market Size Absolute $ Opportunity Analysis and Forecast, By By Range, 2016-2032
- 8.4.3. Medium range scanner
- 8.4.4. Short-range scanner
- 8.4.5. Long-range scanner
- 8.5. Latin America 3D Scanning Market Analysis, Opportunity and Forecast, By By Services, 2016-2032
- 8.5.1. Latin America 3D Scanning Market Analysis by By Services: Introduction
- 8.5.2. Market Size Absolute $ Opportunity Analysis and Forecast, By By Services, 2016-2032
- 8.5.4. Reverse engineering
- 8.5.5. Quality inspection
- 8.5.6. Rapid prototyping
- 8.5.7. Face body scanning
- 8.6. Latin America 3D Scanning Market Analysis, Opportunity and Forecast, By Application Analysis, 2016-2032
- 8.6.1. Latin America 3D Scanning Market Analysis by Application Analysis: Introduction
- 8.6.2. Market Size Absolute $ Opportunity Analysis and Forecast, By Application Analysis, 2016-2032
- 8.6.3. Reverse Engineering
- 8.6.4. Quality Control
- 8.6.5. Virtual Simulation
- 8.6.6. Other Applications
- 8.7. Latin America 3D Scanning Market Analysis, Opportunity and Forecast, By By Industry, 2016-2032
- 8.7.1. Latin America 3D Scanning Market Analysis by By Industry: Introduction
- 8.7.2. Market Size Absolute $ Opportunity Analysis and Forecast, By By Industry, 2016-2032
- 8.7.4. Entertainment & media
- 8.7.5. Aerospace & defense
- 8.7.6. Healthcare
- 8.7.7. Civil & architecture
- 8.7.8. Industrial manufacturing
- 8.7.9. Energy & Power
- 8.7.10. Mining
- 8.7.11. Artifact & Heritage Preservation
- 8.7.12. Others
- 8.CN. Latin America 3D Scanning Market Analysis, Opportunity and Forecast, By Country , 2016-2032
- 8.CN.1. Latin America 3D Scanning Market Analysis by Country : Introduction
- 8.CN.2. Market Size Absolute $ Opportunity Analysis and Forecast, Country , 2016-2032
- 8.CN.2.1. Brazil
- 8.CN.2.2. Colombia
- 8.CN.2.3. Chile
- 8.CN.2.4. Argentina
- 8.CN.2.5. Costa Rica
- 8.CN.2.6. Rest of Latin America
- 9. Middle East & Africa 3D Scanning Market Analysis, Opportunity and Forecast, 2016-2032
- 9.1. Middle East & Africa 3D Scanning Market Analysis, 2016-2021
- 9.2. Middle East & Africa 3D Scanning Market Opportunity and Forecast, 2023-2032
- 9.3. Middle East & Africa 3D Scanning Market Analysis, Opportunity and Forecast, By By Scanner Type, 2016-2032
- 9.3.1. Middle East & Africa 3D Scanning Market Analysis by By Scanner Type: Introduction
- 9.3.2. Market Size Absolute $ Opportunity Analysis and Forecast, By By Scanner Type, 2016-2032
- 9.3.5. Optical scanners
- 9.3.6. Laser scanner
- 9.3.7. handheld and desktop
- 9.4. Middle East & Africa 3D Scanning Market Analysis, Opportunity and Forecast, By By Range, 2016-2032
- 9.4.1. Middle East & Africa 3D Scanning Market Analysis by By Range: Introduction
- 9.4.2. Market Size Absolute $ Opportunity Analysis and Forecast, By By Range, 2016-2032
- 9.4.3. Medium range scanner
- 9.4.4. Short-range scanner
- 9.4.5. Long-range scanner
- 9.5. Middle East & Africa 3D Scanning Market Analysis, Opportunity and Forecast, By By Services, 2016-2032
- 9.5.1. Middle East & Africa 3D Scanning Market Analysis by By Services: Introduction
- 9.5.2. Market Size Absolute $ Opportunity Analysis and Forecast, By By Services, 2016-2032
- 9.5.4. Reverse engineering
- 9.5.5. Quality inspection
- 9.5.6. Rapid prototyping
- 9.5.7. Face body scanning
- 9.6. Middle East & Africa 3D Scanning Market Analysis, Opportunity and Forecast, By Application Analysis, 2016-2032
- 9.6.1. Middle East & Africa 3D Scanning Market Analysis by Application Analysis: Introduction
- 9.6.2. Market Size Absolute $ Opportunity Analysis and Forecast, By Application Analysis, 2016-2032
- 9.6.3. Reverse Engineering
- 9.6.4. Quality Control
- 9.6.5. Virtual Simulation
- 9.6.6. Other Applications
- 9.7. Middle East & Africa 3D Scanning Market Analysis, Opportunity and Forecast, By By Industry, 2016-2032
- 9.7.1. Middle East & Africa 3D Scanning Market Analysis by By Industry: Introduction
- 9.7.2. Market Size Absolute $ Opportunity Analysis and Forecast, By By Industry, 2016-2032
- 9.7.4. Entertainment & media
- 9.7.5. Aerospace & defense
- 9.7.6. Healthcare
- 9.7.7. Civil & architecture
- 9.7.8. Industrial manufacturing
- 9.7.9. Energy & Power
- 9.7.10. Mining
- 9.7.11. Artifact & Heritage Preservation
- 9.7.12. Others
- 9.CN. Middle East & Africa 3D Scanning Market Analysis, Opportunity and Forecast, By Country , 2016-2032
- 9.CN.1. Middle East & Africa 3D Scanning Market Analysis by Country : Introduction
- 9.CN.2. Market Size Absolute $ Opportunity Analysis and Forecast, Country , 2016-2032
- 9.CN.2.1. Algeria
- 9.CN.2.2. Egypt
- 9.CN.2.3. Israel
- 9.CN.2.4. Kuwait
- 9.CN.2.5. Nigeria
- 9.CN.2.6. Saudi Arabia
- 9.CN.2.7. South Africa
- 9.CN.2.8. Turkey
- 9.CN.2.9. The UAE
- 9.CN.2.10. Rest of MEA
- 10. Global 3D Scanning Market Analysis, Opportunity and Forecast, By Region , 2016-2032
- 10.1. Global 3D Scanning Market Analysis by Region : Introduction
- 10.2. Market Size Absolute $ Opportunity Analysis and Forecast, By Region , 2016-2032
- 10.2.1. North America
- 10.2.2. Western Europe
- 10.2.3. Eastern Europe
- 10.2.4. APAC
- 10.2.5. Latin America
- 10.2.6. Middle East & Africa
- 11. Global 3D Scanning Market Competitive Landscape, Market Share Analysis, and Company Profiles
- 11.1. Market Share Analysis
- 11.2. Company Profiles
- 11.3. Faro Technologies, Inc.
- 11.3.1. Company Overview
- 11.3.2. Financial Highlights
- 11.3.3. Product Portfolio
- 11.3.4. SWOT Analysis
- 11.3.5. Key Strategies and Developments
- 11.4. Creaform, Inc.
- 11.4.1. Company Overview
- 11.4.2. Financial Highlights
- 11.4.3. Product Portfolio
- 11.4.4. SWOT Analysis
- 11.4.5. Key Strategies and Developments
- 11.5. Direct Dimensions, Inc.
- 11.5.1. Company Overview
- 11.5.2. Financial Highlights
- 11.5.3. Product Portfolio
- 11.5.4. SWOT Analysis
- 11.5.5. Key Strategies and Developments
- 11.6. GOM GmbH
- 11.6.1. Company Overview
- 11.6.2. Financial Highlights
- 11.6.3. Product Portfolio
- 11.6.4. SWOT Analysis
- 11.6.5. Key Strategies and Developments
- 11.7. Konica Minolta, Inc.
- 11.7.1. Company Overview
- 11.7.2. Financial Highlights
- 11.7.3. Product Portfolio
- 11.7.4. SWOT Analysis
- 11.7.5. Key Strategies and Developments
- 11.8. 3D Digital Corporation
- 11.8.1. Company Overview
- 11.8.2. Financial Highlights
- 11.8.3. Product Portfolio
- 11.8.4. SWOT Analysis
- 11.8.5. Key Strategies and Developments
- 11.9. Autodesk, Inc.
- 11.9.1. Company Overview
- 11.9.2. Financial Highlights
- 11.9.3. Product Portfolio
- 11.9.4. SWOT Analysis
- 11.9.5. Key Strategies and Developments
- 11.10. 3D Systems, Inc.
- 11.10.1. Company Overview
- 11.10.2. Financial Highlights
- 11.10.3. Product Portfolio
- 11.10.4. SWOT Analysis
- 11.10.5. Key Strategies and Developments
- 11.11. Shape Grabber
- 11.11.1. Company Overview
- 11.11.2. Financial Highlights
- 11.11.3. Product Portfolio
- 11.11.4. SWOT Analysis
- 11.11.5. Key Strategies and Developments
- 11.12. Maptek Pty Ltd.
- 11.12.1. Company Overview
- 11.12.2. Financial Highlights
- 11.12.3. Product Portfolio
- 11.12.4. SWOT Analysis
- 11.12.5. Key Strategies and Developments
- 12. Assumptions and Acronyms
- 13. Research Methodology
- 14. Contact
List of Figures
-
- Figure 1: Global 3D Scanning Market Revenue (US$ Mn) Market Share by By Scanner Type in 2022
- Figure 2: Global 3D Scanning Market Attractiveness Analysis by By Scanner Type, 2016-2032
- Figure 3: Global 3D Scanning Market Revenue (US$ Mn) Market Share by By Rangein 2022
- Figure 4: Global 3D Scanning Market Attractiveness Analysis by By Range, 2016-2032
- Figure 5: Global 3D Scanning Market Revenue (US$ Mn) Market Share by By Servicesin 2022
- Figure 6: Global 3D Scanning Market Attractiveness Analysis by By Services, 2016-2032
- Figure 7: Global 3D Scanning Market Revenue (US$ Mn) Market Share by Application Analysisin 2022
- Figure 8: Global 3D Scanning Market Attractiveness Analysis by Application Analysis, 2016-2032
- Figure 9: Global 3D Scanning Market Revenue (US$ Mn) Market Share by By Industryin 2022
- Figure 10: Global 3D Scanning Market Attractiveness Analysis by By Industry, 2016-2032
- Figure 11: Global 3D Scanning Market Revenue (US$ Mn) Market Share by Region in 2022
- Figure 12: Global 3D Scanning Market Attractiveness Analysis by Region, 2016-2032
- Figure 13: Global 3D Scanning Market Revenue (US$ Mn) (2016-2032)
- Figure 14: Global 3D Scanning Market Revenue (US$ Mn) Comparison by Region (2016-2032)
- Figure 15: Global 3D Scanning Market Revenue (US$ Mn) Comparison by By Scanner Type (2016-2032)
- Figure 16: Global 3D Scanning Market Revenue (US$ Mn) Comparison by By Range (2016-2032)
- Figure 17: Global 3D Scanning Market Revenue (US$ Mn) Comparison by By Services (2016-2032)
- Figure 18: Global 3D Scanning Market Revenue (US$ Mn) Comparison by Application Analysis (2016-2032)
- Figure 19: Global 3D Scanning Market Revenue (US$ Mn) Comparison by By Industry (2016-2032)
- Figure 20: Global 3D Scanning Market Y-o-Y Growth Rate Comparison by Region (2016-2032)
- Figure 21: Global 3D Scanning Market Y-o-Y Growth Rate Comparison by By Scanner Type (2016-2032)
- Figure 22: Global 3D Scanning Market Y-o-Y Growth Rate Comparison by By Range (2016-2032)
- Figure 23: Global 3D Scanning Market Y-o-Y Growth Rate Comparison by By Services (2016-2032)
- Figure 24: Global 3D Scanning Market Y-o-Y Growth Rate Comparison by Application Analysis (2016-2032)
- Figure 25: Global 3D Scanning Market Y-o-Y Growth Rate Comparison by By Industry (2016-2032)
- Figure 26: Global 3D Scanning Market Share Comparison by Region (2016-2032)
- Figure 27: Global 3D Scanning Market Share Comparison by By Scanner Type (2016-2032)
- Figure 28: Global 3D Scanning Market Share Comparison by By Range (2016-2032)
- Figure 29: Global 3D Scanning Market Share Comparison by By Services (2016-2032)
- Figure 30: Global 3D Scanning Market Share Comparison by Application Analysis (2016-2032)
- Figure 31: Global 3D Scanning Market Share Comparison by By Industry (2016-2032)
- Figure 32: North America 3D Scanning Market Revenue (US$ Mn) Market Share by By Scanner Typein 2022
- Figure 33: North America 3D Scanning Market Attractiveness Analysis by By Scanner Type, 2016-2032
- Figure 34: North America 3D Scanning Market Revenue (US$ Mn) Market Share by By Rangein 2022
- Figure 35: North America 3D Scanning Market Attractiveness Analysis by By Range, 2016-2032
- Figure 36: North America 3D Scanning Market Revenue (US$ Mn) Market Share by By Servicesin 2022
- Figure 37: North America 3D Scanning Market Attractiveness Analysis by By Services, 2016-2032
- Figure 38: North America 3D Scanning Market Revenue (US$ Mn) Market Share by Application Analysisin 2022
- Figure 39: North America 3D Scanning Market Attractiveness Analysis by Application Analysis, 2016-2032
- Figure 40: North America 3D Scanning Market Revenue (US$ Mn) Market Share by By Industryin 2022
- Figure 41: North America 3D Scanning Market Attractiveness Analysis by By Industry, 2016-2032
- Figure 42: North America 3D Scanning Market Revenue (US$ Mn) Market Share by Country in 2022
- Figure 43: North America 3D Scanning Market Attractiveness Analysis by Country, 2016-2032
- Figure 44: North America 3D Scanning Market Revenue (US$ Mn) (2016-2032)
- Figure 45: North America 3D Scanning Market Revenue (US$ Mn) Comparison by Country (2016-2032)
- Figure 46: North America 3D Scanning Market Revenue (US$ Mn) Comparison by By Scanner Type (2016-2032)
- Figure 47: North America 3D Scanning Market Revenue (US$ Mn) Comparison by By Range (2016-2032)
- Figure 48: North America 3D Scanning Market Revenue (US$ Mn) Comparison by By Services (2016-2032)
- Figure 49: North America 3D Scanning Market Revenue (US$ Mn) Comparison by Application Analysis (2016-2032)
- Figure 50: North America 3D Scanning Market Revenue (US$ Mn) Comparison by By Industry (2016-2032)
- Figure 51: North America 3D Scanning Market Y-o-Y Growth Rate Comparison by Country (2016-2032)
- Figure 52: North America 3D Scanning Market Y-o-Y Growth Rate Comparison by By Scanner Type (2016-2032)
- Figure 53: North America 3D Scanning Market Y-o-Y Growth Rate Comparison by By Range (2016-2032)
- Figure 54: North America 3D Scanning Market Y-o-Y Growth Rate Comparison by By Services (2016-2032)
- Figure 55: North America 3D Scanning Market Y-o-Y Growth Rate Comparison by Application Analysis (2016-2032)
- Figure 56: North America 3D Scanning Market Y-o-Y Growth Rate Comparison by By Industry (2016-2032)
- Figure 57: North America 3D Scanning Market Share Comparison by Country (2016-2032)
- Figure 58: North America 3D Scanning Market Share Comparison by By Scanner Type (2016-2032)
- Figure 59: North America 3D Scanning Market Share Comparison by By Range (2016-2032)
- Figure 60: North America 3D Scanning Market Share Comparison by By Services (2016-2032)
- Figure 61: North America 3D Scanning Market Share Comparison by Application Analysis (2016-2032)
- Figure 62: North America 3D Scanning Market Share Comparison by By Industry (2016-2032)
- Figure 63: Western Europe 3D Scanning Market Revenue (US$ Mn) Market Share by By Scanner Typein 2022
- Figure 64: Western Europe 3D Scanning Market Attractiveness Analysis by By Scanner Type, 2016-2032
- Figure 65: Western Europe 3D Scanning Market Revenue (US$ Mn) Market Share by By Rangein 2022
- Figure 66: Western Europe 3D Scanning Market Attractiveness Analysis by By Range, 2016-2032
- Figure 67: Western Europe 3D Scanning Market Revenue (US$ Mn) Market Share by By Servicesin 2022
- Figure 68: Western Europe 3D Scanning Market Attractiveness Analysis by By Services, 2016-2032
- Figure 69: Western Europe 3D Scanning Market Revenue (US$ Mn) Market Share by Application Analysisin 2022
- Figure 70: Western Europe 3D Scanning Market Attractiveness Analysis by Application Analysis, 2016-2032
- Figure 71: Western Europe 3D Scanning Market Revenue (US$ Mn) Market Share by By Industryin 2022
- Figure 72: Western Europe 3D Scanning Market Attractiveness Analysis by By Industry, 2016-2032
- Figure 73: Western Europe 3D Scanning Market Revenue (US$ Mn) Market Share by Country in 2022
- Figure 74: Western Europe 3D Scanning Market Attractiveness Analysis by Country, 2016-2032
- Figure 75: Western Europe 3D Scanning Market Revenue (US$ Mn) (2016-2032)
- Figure 76: Western Europe 3D Scanning Market Revenue (US$ Mn) Comparison by Country (2016-2032)
- Figure 77: Western Europe 3D Scanning Market Revenue (US$ Mn) Comparison by By Scanner Type (2016-2032)
- Figure 78: Western Europe 3D Scanning Market Revenue (US$ Mn) Comparison by By Range (2016-2032)
- Figure 79: Western Europe 3D Scanning Market Revenue (US$ Mn) Comparison by By Services (2016-2032)
- Figure 80: Western Europe 3D Scanning Market Revenue (US$ Mn) Comparison by Application Analysis (2016-2032)
- Figure 81: Western Europe 3D Scanning Market Revenue (US$ Mn) Comparison by By Industry (2016-2032)
- Figure 82: Western Europe 3D Scanning Market Y-o-Y Growth Rate Comparison by Country (2016-2032)
- Figure 83: Western Europe 3D Scanning Market Y-o-Y Growth Rate Comparison by By Scanner Type (2016-2032)
- Figure 84: Western Europe 3D Scanning Market Y-o-Y Growth Rate Comparison by By Range (2016-2032)
- Figure 85: Western Europe 3D Scanning Market Y-o-Y Growth Rate Comparison by By Services (2016-2032)
- Figure 86: Western Europe 3D Scanning Market Y-o-Y Growth Rate Comparison by Application Analysis (2016-2032)
- Figure 87: Western Europe 3D Scanning Market Y-o-Y Growth Rate Comparison by By Industry (2016-2032)
- Figure 88: Western Europe 3D Scanning Market Share Comparison by Country (2016-2032)
- Figure 89: Western Europe 3D Scanning Market Share Comparison by By Scanner Type (2016-2032)
- Figure 90: Western Europe 3D Scanning Market Share Comparison by By Range (2016-2032)
- Figure 91: Western Europe 3D Scanning Market Share Comparison by By Services (2016-2032)
- Figure 92: Western Europe 3D Scanning Market Share Comparison by Application Analysis (2016-2032)
- Figure 93: Western Europe 3D Scanning Market Share Comparison by By Industry (2016-2032)
- Figure 94: Eastern Europe 3D Scanning Market Revenue (US$ Mn) Market Share by By Scanner Typein 2022
- Figure 95: Eastern Europe 3D Scanning Market Attractiveness Analysis by By Scanner Type, 2016-2032
- Figure 96: Eastern Europe 3D Scanning Market Revenue (US$ Mn) Market Share by By Rangein 2022
- Figure 97: Eastern Europe 3D Scanning Market Attractiveness Analysis by By Range, 2016-2032
- Figure 98: Eastern Europe 3D Scanning Market Revenue (US$ Mn) Market Share by By Servicesin 2022
- Figure 99: Eastern Europe 3D Scanning Market Attractiveness Analysis by By Services, 2016-2032
- Figure 100: Eastern Europe 3D Scanning Market Revenue (US$ Mn) Market Share by Application Analysisin 2022
- Figure 101: Eastern Europe 3D Scanning Market Attractiveness Analysis by Application Analysis, 2016-2032
- Figure 102: Eastern Europe 3D Scanning Market Revenue (US$ Mn) Market Share by By Industryin 2022
- Figure 103: Eastern Europe 3D Scanning Market Attractiveness Analysis by By Industry, 2016-2032
- Figure 104: Eastern Europe 3D Scanning Market Revenue (US$ Mn) Market Share by Country in 2022
- Figure 105: Eastern Europe 3D Scanning Market Attractiveness Analysis by Country, 2016-2032
- Figure 106: Eastern Europe 3D Scanning Market Revenue (US$ Mn) (2016-2032)
- Figure 107: Eastern Europe 3D Scanning Market Revenue (US$ Mn) Comparison by Country (2016-2032)
- Figure 108: Eastern Europe 3D Scanning Market Revenue (US$ Mn) Comparison by By Scanner Type (2016-2032)
- Figure 109: Eastern Europe 3D Scanning Market Revenue (US$ Mn) Comparison by By Range (2016-2032)
- Figure 110: Eastern Europe 3D Scanning Market Revenue (US$ Mn) Comparison by By Services (2016-2032)
- Figure 111: Eastern Europe 3D Scanning Market Revenue (US$ Mn) Comparison by Application Analysis (2016-2032)
- Figure 112: Eastern Europe 3D Scanning Market Revenue (US$ Mn) Comparison by By Industry (2016-2032)
- Figure 113: Eastern Europe 3D Scanning Market Y-o-Y Growth Rate Comparison by Country (2016-2032)
- Figure 114: Eastern Europe 3D Scanning Market Y-o-Y Growth Rate Comparison by By Scanner Type (2016-2032)
- Figure 115: Eastern Europe 3D Scanning Market Y-o-Y Growth Rate Comparison by By Range (2016-2032)
- Figure 116: Eastern Europe 3D Scanning Market Y-o-Y Growth Rate Comparison by By Services (2016-2032)
- Figure 117: Eastern Europe 3D Scanning Market Y-o-Y Growth Rate Comparison by Application Analysis (2016-2032)
- Figure 118: Eastern Europe 3D Scanning Market Y-o-Y Growth Rate Comparison by By Industry (2016-2032)
- Figure 119: Eastern Europe 3D Scanning Market Share Comparison by Country (2016-2032)
- Figure 120: Eastern Europe 3D Scanning Market Share Comparison by By Scanner Type (2016-2032)
- Figure 121: Eastern Europe 3D Scanning Market Share Comparison by By Range (2016-2032)
- Figure 122: Eastern Europe 3D Scanning Market Share Comparison by By Services (2016-2032)
- Figure 123: Eastern Europe 3D Scanning Market Share Comparison by Application Analysis (2016-2032)
- Figure 124: Eastern Europe 3D Scanning Market Share Comparison by By Industry (2016-2032)
- Figure 125: APAC 3D Scanning Market Revenue (US$ Mn) Market Share by By Scanner Typein 2022
- Figure 126: APAC 3D Scanning Market Attractiveness Analysis by By Scanner Type, 2016-2032
- Figure 127: APAC 3D Scanning Market Revenue (US$ Mn) Market Share by By Rangein 2022
- Figure 128: APAC 3D Scanning Market Attractiveness Analysis by By Range, 2016-2032
- Figure 129: APAC 3D Scanning Market Revenue (US$ Mn) Market Share by By Servicesin 2022
- Figure 130: APAC 3D Scanning Market Attractiveness Analysis by By Services, 2016-2032
- Figure 131: APAC 3D Scanning Market Revenue (US$ Mn) Market Share by Application Analysisin 2022
- Figure 132: APAC 3D Scanning Market Attractiveness Analysis by Application Analysis, 2016-2032
- Figure 133: APAC 3D Scanning Market Revenue (US$ Mn) Market Share by By Industryin 2022
- Figure 134: APAC 3D Scanning Market Attractiveness Analysis by By Industry, 2016-2032
- Figure 135: APAC 3D Scanning Market Revenue (US$ Mn) Market Share by Country in 2022
- Figure 136: APAC 3D Scanning Market Attractiveness Analysis by Country, 2016-2032
- Figure 137: APAC 3D Scanning Market Revenue (US$ Mn) (2016-2032)
- Figure 138: APAC 3D Scanning Market Revenue (US$ Mn) Comparison by Country (2016-2032)
- Figure 139: APAC 3D Scanning Market Revenue (US$ Mn) Comparison by By Scanner Type (2016-2032)
- Figure 140: APAC 3D Scanning Market Revenue (US$ Mn) Comparison by By Range (2016-2032)
- Figure 141: APAC 3D Scanning Market Revenue (US$ Mn) Comparison by By Services (2016-2032)
- Figure 142: APAC 3D Scanning Market Revenue (US$ Mn) Comparison by Application Analysis (2016-2032)
- Figure 143: APAC 3D Scanning Market Revenue (US$ Mn) Comparison by By Industry (2016-2032)
- Figure 144: APAC 3D Scanning Market Y-o-Y Growth Rate Comparison by Country (2016-2032)
- Figure 145: APAC 3D Scanning Market Y-o-Y Growth Rate Comparison by By Scanner Type (2016-2032)
- Figure 146: APAC 3D Scanning Market Y-o-Y Growth Rate Comparison by By Range (2016-2032)
- Figure 147: APAC 3D Scanning Market Y-o-Y Growth Rate Comparison by By Services (2016-2032)
- Figure 148: APAC 3D Scanning Market Y-o-Y Growth Rate Comparison by Application Analysis (2016-2032)
- Figure 149: APAC 3D Scanning Market Y-o-Y Growth Rate Comparison by By Industry (2016-2032)
- Figure 150: APAC 3D Scanning Market Share Comparison by Country (2016-2032)
- Figure 151: APAC 3D Scanning Market Share Comparison by By Scanner Type (2016-2032)
- Figure 152: APAC 3D Scanning Market Share Comparison by By Range (2016-2032)
- Figure 153: APAC 3D Scanning Market Share Comparison by By Services (2016-2032)
- Figure 154: APAC 3D Scanning Market Share Comparison by Application Analysis (2016-2032)
- Figure 155: APAC 3D Scanning Market Share Comparison by By Industry (2016-2032)
- Figure 156: Latin America 3D Scanning Market Revenue (US$ Mn) Market Share by By Scanner Typein 2022
- Figure 157: Latin America 3D Scanning Market Attractiveness Analysis by By Scanner Type, 2016-2032
- Figure 158: Latin America 3D Scanning Market Revenue (US$ Mn) Market Share by By Rangein 2022
- Figure 159: Latin America 3D Scanning Market Attractiveness Analysis by By Range, 2016-2032
- Figure 160: Latin America 3D Scanning Market Revenue (US$ Mn) Market Share by By Servicesin 2022
- Figure 161: Latin America 3D Scanning Market Attractiveness Analysis by By Services, 2016-2032
- Figure 162: Latin America 3D Scanning Market Revenue (US$ Mn) Market Share by Application Analysisin 2022
- Figure 163: Latin America 3D Scanning Market Attractiveness Analysis by Application Analysis, 2016-2032
- Figure 164: Latin America 3D Scanning Market Revenue (US$ Mn) Market Share by By Industryin 2022
- Figure 165: Latin America 3D Scanning Market Attractiveness Analysis by By Industry, 2016-2032
- Figure 166: Latin America 3D Scanning Market Revenue (US$ Mn) Market Share by Country in 2022
- Figure 167: Latin America 3D Scanning Market Attractiveness Analysis by Country, 2016-2032
- Figure 168: Latin America 3D Scanning Market Revenue (US$ Mn) (2016-2032)
- Figure 169: Latin America 3D Scanning Market Revenue (US$ Mn) Comparison by Country (2016-2032)
- Figure 170: Latin America 3D Scanning Market Revenue (US$ Mn) Comparison by By Scanner Type (2016-2032)
- Figure 171: Latin America 3D Scanning Market Revenue (US$ Mn) Comparison by By Range (2016-2032)
- Figure 172: Latin America 3D Scanning Market Revenue (US$ Mn) Comparison by By Services (2016-2032)
- Figure 173: Latin America 3D Scanning Market Revenue (US$ Mn) Comparison by Application Analysis (2016-2032)
- Figure 174: Latin America 3D Scanning Market Revenue (US$ Mn) Comparison by By Industry (2016-2032)
- Figure 175: Latin America 3D Scanning Market Y-o-Y Growth Rate Comparison by Country (2016-2032)
- Figure 176: Latin America 3D Scanning Market Y-o-Y Growth Rate Comparison by By Scanner Type (2016-2032)
- Figure 177: Latin America 3D Scanning Market Y-o-Y Growth Rate Comparison by By Range (2016-2032)
- Figure 178: Latin America 3D Scanning Market Y-o-Y Growth Rate Comparison by By Services (2016-2032)
- Figure 179: Latin America 3D Scanning Market Y-o-Y Growth Rate Comparison by Application Analysis (2016-2032)
- Figure 180: Latin America 3D Scanning Market Y-o-Y Growth Rate Comparison by By Industry (2016-2032)
- Figure 181: Latin America 3D Scanning Market Share Comparison by Country (2016-2032)
- Figure 182: Latin America 3D Scanning Market Share Comparison by By Scanner Type (2016-2032)
- Figure 183: Latin America 3D Scanning Market Share Comparison by By Range (2016-2032)
- Figure 184: Latin America 3D Scanning Market Share Comparison by By Services (2016-2032)
- Figure 185: Latin America 3D Scanning Market Share Comparison by Application Analysis (2016-2032)
- Figure 186: Latin America 3D Scanning Market Share Comparison by By Industry (2016-2032)
- Figure 187: Middle East & Africa 3D Scanning Market Revenue (US$ Mn) Market Share by By Scanner Typein 2022
- Figure 188: Middle East & Africa 3D Scanning Market Attractiveness Analysis by By Scanner Type, 2016-2032
- Figure 189: Middle East & Africa 3D Scanning Market Revenue (US$ Mn) Market Share by By Rangein 2022
- Figure 190: Middle East & Africa 3D Scanning Market Attractiveness Analysis by By Range, 2016-2032
- Figure 191: Middle East & Africa 3D Scanning Market Revenue (US$ Mn) Market Share by By Servicesin 2022
- Figure 192: Middle East & Africa 3D Scanning Market Attractiveness Analysis by By Services, 2016-2032
- Figure 193: Middle East & Africa 3D Scanning Market Revenue (US$ Mn) Market Share by Application Analysisin 2022
- Figure 194: Middle East & Africa 3D Scanning Market Attractiveness Analysis by Application Analysis, 2016-2032
- Figure 195: Middle East & Africa 3D Scanning Market Revenue (US$ Mn) Market Share by By Industryin 2022
- Figure 196: Middle East & Africa 3D Scanning Market Attractiveness Analysis by By Industry, 2016-2032
- Figure 197: Middle East & Africa 3D Scanning Market Revenue (US$ Mn) Market Share by Country in 2022
- Figure 198: Middle East & Africa 3D Scanning Market Attractiveness Analysis by Country, 2016-2032
- Figure 199: Middle East & Africa 3D Scanning Market Revenue (US$ Mn) (2016-2032)
- Figure 200: Middle East & Africa 3D Scanning Market Revenue (US$ Mn) Comparison by Country (2016-2032)
- Figure 201: Middle East & Africa 3D Scanning Market Revenue (US$ Mn) Comparison by By Scanner Type (2016-2032)
- Figure 202: Middle East & Africa 3D Scanning Market Revenue (US$ Mn) Comparison by By Range (2016-2032)
- Figure 203: Middle East & Africa 3D Scanning Market Revenue (US$ Mn) Comparison by By Services (2016-2032)
- Figure 204: Middle East & Africa 3D Scanning Market Revenue (US$ Mn) Comparison by Application Analysis (2016-2032)
- Figure 205: Middle East & Africa 3D Scanning Market Revenue (US$ Mn) Comparison by By Industry (2016-2032)
- Figure 206: Middle East & Africa 3D Scanning Market Y-o-Y Growth Rate Comparison by Country (2016-2032)
- Figure 207: Middle East & Africa 3D Scanning Market Y-o-Y Growth Rate Comparison by By Scanner Type (2016-2032)
- Figure 208: Middle East & Africa 3D Scanning Market Y-o-Y Growth Rate Comparison by By Range (2016-2032)
- Figure 209: Middle East & Africa 3D Scanning Market Y-o-Y Growth Rate Comparison by By Services (2016-2032)
- Figure 210: Middle East & Africa 3D Scanning Market Y-o-Y Growth Rate Comparison by Application Analysis (2016-2032)
- Figure 211: Middle East & Africa 3D Scanning Market Y-o-Y Growth Rate Comparison by By Industry (2016-2032)
- Figure 212: Middle East & Africa 3D Scanning Market Share Comparison by Country (2016-2032)
- Figure 213: Middle East & Africa 3D Scanning Market Share Comparison by By Scanner Type (2016-2032)
- Figure 214: Middle East & Africa 3D Scanning Market Share Comparison by By Range (2016-2032)
- Figure 215: Middle East & Africa 3D Scanning Market Share Comparison by By Services (2016-2032)
- Figure 216: Middle East & Africa 3D Scanning Market Share Comparison by Application Analysis (2016-2032)
- Figure 217: Middle East & Africa 3D Scanning Market Share Comparison by By Industry (2016-2032)
- List of Tables
- Table 1: Global 3D Scanning Market Comparison by By Scanner Type (2016-2032)
- Table 2: Global 3D Scanning Market Comparison by By Range (2016-2032)
- Table 3: Global 3D Scanning Market Comparison by By Services (2016-2032)
- Table 4: Global 3D Scanning Market Comparison by Application Analysis (2016-2032)
- Table 5: Global 3D Scanning Market Comparison by By Industry (2016-2032)
- Table 6: Global 3D Scanning Market Revenue (US$ Mn) Comparison by Region (2016-2032)
- Table 7: Global 3D Scanning Market Revenue (US$ Mn) (2016-2032)
- Table 8: Global 3D Scanning Market Revenue (US$ Mn) Comparison by Region (2016-2032)
- Table 9: Global 3D Scanning Market Revenue (US$ Mn) Comparison by By Scanner Type (2016-2032)
- Table 10: Global 3D Scanning Market Revenue (US$ Mn) Comparison by By Range (2016-2032)
- Table 11: Global 3D Scanning Market Revenue (US$ Mn) Comparison by By Services (2016-2032)
- Table 12: Global 3D Scanning Market Revenue (US$ Mn) Comparison by Application Analysis (2016-2032)
- Table 13: Global 3D Scanning Market Revenue (US$ Mn) Comparison by By Industry (2016-2032)
- Table 14: Global 3D Scanning Market Y-o-Y Growth Rate Comparison by Region (2016-2032)
- Table 15: Global 3D Scanning Market Y-o-Y Growth Rate Comparison by By Scanner Type (2016-2032)
- Table 16: Global 3D Scanning Market Y-o-Y Growth Rate Comparison by By Range (2016-2032)
- Table 17: Global 3D Scanning Market Y-o-Y Growth Rate Comparison by By Services (2016-2032)
- Table 18: Global 3D Scanning Market Y-o-Y Growth Rate Comparison by Application Analysis (2016-2032)
- Table 19: Global 3D Scanning Market Y-o-Y Growth Rate Comparison by By Industry (2016-2032)
- Table 20: Global 3D Scanning Market Share Comparison by Region (2016-2032)
- Table 21: Global 3D Scanning Market Share Comparison by By Scanner Type (2016-2032)
- Table 22: Global 3D Scanning Market Share Comparison by By Range (2016-2032)
- Table 23: Global 3D Scanning Market Share Comparison by By Services (2016-2032)
- Table 24: Global 3D Scanning Market Share Comparison by Application Analysis (2016-2032)
- Table 25: Global 3D Scanning Market Share Comparison by By Industry (2016-2032)
- Table 26: North America 3D Scanning Market Comparison by By Range (2016-2032)
- Table 27: North America 3D Scanning Market Comparison by By Services (2016-2032)
- Table 28: North America 3D Scanning Market Comparison by Application Analysis (2016-2032)
- Table 29: North America 3D Scanning Market Comparison by By Industry (2016-2032)
- Table 30: North America 3D Scanning Market Revenue (US$ Mn) Comparison by Country (2016-2032)
- Table 31: North America 3D Scanning Market Revenue (US$ Mn) (2016-2032)
- Table 32: North America 3D Scanning Market Revenue (US$ Mn) Comparison by Country (2016-2032)
- Table 33: North America 3D Scanning Market Revenue (US$ Mn) Comparison by By Scanner Type (2016-2032)
- Table 34: North America 3D Scanning Market Revenue (US$ Mn) Comparison by By Range (2016-2032)
- Table 35: North America 3D Scanning Market Revenue (US$ Mn) Comparison by By Services (2016-2032)
- Table 36: North America 3D Scanning Market Revenue (US$ Mn) Comparison by Application Analysis (2016-2032)
- Table 37: North America 3D Scanning Market Revenue (US$ Mn) Comparison by By Industry (2016-2032)
- Table 38: North America 3D Scanning Market Y-o-Y Growth Rate Comparison by Country (2016-2032)
- Table 39: North America 3D Scanning Market Y-o-Y Growth Rate Comparison by By Scanner Type (2016-2032)
- Table 40: North America 3D Scanning Market Y-o-Y Growth Rate Comparison by By Range (2016-2032)
- Table 41: North America 3D Scanning Market Y-o-Y Growth Rate Comparison by By Services (2016-2032)
- Table 42: North America 3D Scanning Market Y-o-Y Growth Rate Comparison by Application Analysis (2016-2032)
- Table 43: North America 3D Scanning Market Y-o-Y Growth Rate Comparison by By Industry (2016-2032)
- Table 44: North America 3D Scanning Market Share Comparison by Country (2016-2032)
- Table 45: North America 3D Scanning Market Share Comparison by By Scanner Type (2016-2032)
- Table 46: North America 3D Scanning Market Share Comparison by By Range (2016-2032)
- Table 47: North America 3D Scanning Market Share Comparison by By Services (2016-2032)
- Table 48: North America 3D Scanning Market Share Comparison by Application Analysis (2016-2032)
- Table 49: North America 3D Scanning Market Share Comparison by By Industry (2016-2032)
- Table 50: Western Europe 3D Scanning Market Comparison by By Scanner Type (2016-2032)
- Table 51: Western Europe 3D Scanning Market Comparison by By Range (2016-2032)
- Table 52: Western Europe 3D Scanning Market Comparison by By Services (2016-2032)
- Table 53: Western Europe 3D Scanning Market Comparison by Application Analysis (2016-2032)
- Table 54: Western Europe 3D Scanning Market Comparison by By Industry (2016-2032)
- Table 55: Western Europe 3D Scanning Market Revenue (US$ Mn) Comparison by Country (2016-2032)
- Table 56: Western Europe 3D Scanning Market Revenue (US$ Mn) (2016-2032)
- Table 57: Western Europe 3D Scanning Market Revenue (US$ Mn) Comparison by Country (2016-2032)
- Table 58: Western Europe 3D Scanning Market Revenue (US$ Mn) Comparison by By Scanner Type (2016-2032)
- Table 59: Western Europe 3D Scanning Market Revenue (US$ Mn) Comparison by By Range (2016-2032)
- Table 60: Western Europe 3D Scanning Market Revenue (US$ Mn) Comparison by By Services (2016-2032)
- Table 61: Western Europe 3D Scanning Market Revenue (US$ Mn) Comparison by Application Analysis (2016-2032)
- Table 62: Western Europe 3D Scanning Market Revenue (US$ Mn) Comparison by By Industry (2016-2032)
- Table 63: Western Europe 3D Scanning Market Y-o-Y Growth Rate Comparison by Country (2016-2032)
- Table 64: Western Europe 3D Scanning Market Y-o-Y Growth Rate Comparison by By Scanner Type (2016-2032)
- Table 65: Western Europe 3D Scanning Market Y-o-Y Growth Rate Comparison by By Range (2016-2032)
- Table 66: Western Europe 3D Scanning Market Y-o-Y Growth Rate Comparison by By Services (2016-2032)
- Table 67: Western Europe 3D Scanning Market Y-o-Y Growth Rate Comparison by Application Analysis (2016-2032)
- Table 68: Western Europe 3D Scanning Market Y-o-Y Growth Rate Comparison by By Industry (2016-2032)
- Table 69: Western Europe 3D Scanning Market Share Comparison by Country (2016-2032)
- Table 70: Western Europe 3D Scanning Market Share Comparison by By Scanner Type (2016-2032)
- Table 71: Western Europe 3D Scanning Market Share Comparison by By Range (2016-2032)
- Table 72: Western Europe 3D Scanning Market Share Comparison by By Services (2016-2032)
- Table 73: Western Europe 3D Scanning Market Share Comparison by Application Analysis (2016-2032)
- Table 74: Western Europe 3D Scanning Market Share Comparison by By Industry (2016-2032)
- Table 75: Eastern Europe 3D Scanning Market Comparison by By Scanner Type (2016-2032)
- Table 76: Eastern Europe 3D Scanning Market Comparison by By Range (2016-2032)
- Table 77: Eastern Europe 3D Scanning Market Comparison by By Services (2016-2032)
- Table 78: Eastern Europe 3D Scanning Market Comparison by Application Analysis (2016-2032)
- Table 79: Eastern Europe 3D Scanning Market Comparison by By Industry (2016-2032)
- Table 80: Eastern Europe 3D Scanning Market Revenue (US$ Mn) Comparison by Country (2016-2032)
- Table 81: Eastern Europe 3D Scanning Market Revenue (US$ Mn) (2016-2032)
- Table 82: Eastern Europe 3D Scanning Market Revenue (US$ Mn) Comparison by Country (2016-2032)
- Table 83: Eastern Europe 3D Scanning Market Revenue (US$ Mn) Comparison by By Scanner Type (2016-2032)
- Table 84: Eastern Europe 3D Scanning Market Revenue (US$ Mn) Comparison by By Range (2016-2032)
- Table 85: Eastern Europe 3D Scanning Market Revenue (US$ Mn) Comparison by By Services (2016-2032)
- Table 86: Eastern Europe 3D Scanning Market Revenue (US$ Mn) Comparison by Application Analysis (2016-2032)
- Table 87: Eastern Europe 3D Scanning Market Revenue (US$ Mn) Comparison by By Industry (2016-2032)
- Table 88: Eastern Europe 3D Scanning Market Y-o-Y Growth Rate Comparison by Country (2016-2032)
- Table 89: Eastern Europe 3D Scanning Market Y-o-Y Growth Rate Comparison by By Scanner Type (2016-2032)
- Table 90: Eastern Europe 3D Scanning Market Y-o-Y Growth Rate Comparison by By Range (2016-2032)
- Table 91: Eastern Europe 3D Scanning Market Y-o-Y Growth Rate Comparison by By Services (2016-2032)
- Table 92: Eastern Europe 3D Scanning Market Y-o-Y Growth Rate Comparison by Application Analysis (2016-2032)
- Table 93: Eastern Europe 3D Scanning Market Y-o-Y Growth Rate Comparison by By Industry (2016-2032)
- Table 94: Eastern Europe 3D Scanning Market Share Comparison by Country (2016-2032)
- Table 95: Eastern Europe 3D Scanning Market Share Comparison by By Scanner Type (2016-2032)
- Table 96: Eastern Europe 3D Scanning Market Share Comparison by By Range (2016-2032)
- Table 97: Eastern Europe 3D Scanning Market Share Comparison by By Services (2016-2032)
- Table 98: Eastern Europe 3D Scanning Market Share Comparison by Application Analysis (2016-2032)
- Table 99: Eastern Europe 3D Scanning Market Share Comparison by By Industry (2016-2032)
- Table 100: APAC 3D Scanning Market Comparison by By Scanner Type (2016-2032)
- Table 101: APAC 3D Scanning Market Comparison by By Range (2016-2032)
- Table 102: APAC 3D Scanning Market Comparison by By Services (2016-2032)
- Table 103: APAC 3D Scanning Market Comparison by Application Analysis (2016-2032)
- Table 104: APAC 3D Scanning Market Comparison by By Industry (2016-2032)
- Table 105: APAC 3D Scanning Market Revenue (US$ Mn) Comparison by Country (2016-2032)
- Table 106: APAC 3D Scanning Market Revenue (US$ Mn) (2016-2032)
- Table 107: APAC 3D Scanning Market Revenue (US$ Mn) Comparison by Country (2016-2032)
- Table 108: APAC 3D Scanning Market Revenue (US$ Mn) Comparison by By Scanner Type (2016-2032)
- Table 109: APAC 3D Scanning Market Revenue (US$ Mn) Comparison by By Range (2016-2032)
- Table 110: APAC 3D Scanning Market Revenue (US$ Mn) Comparison by By Services (2016-2032)
- Table 111: APAC 3D Scanning Market Revenue (US$ Mn) Comparison by Application Analysis (2016-2032)
- Table 112: APAC 3D Scanning Market Revenue (US$ Mn) Comparison by By Industry (2016-2032)
- Table 113: APAC 3D Scanning Market Y-o-Y Growth Rate Comparison by Country (2016-2032)
- Table 114: APAC 3D Scanning Market Y-o-Y Growth Rate Comparison by By Scanner Type (2016-2032)
- Table 115: APAC 3D Scanning Market Y-o-Y Growth Rate Comparison by By Range (2016-2032)
- Table 116: APAC 3D Scanning Market Y-o-Y Growth Rate Comparison by By Services (2016-2032)
- Table 117: APAC 3D Scanning Market Y-o-Y Growth Rate Comparison by Application Analysis (2016-2032)
- Table 118: APAC 3D Scanning Market Y-o-Y Growth Rate Comparison by By Industry (2016-2032)
- Table 119: APAC 3D Scanning Market Share Comparison by Country (2016-2032)
- Table 120: APAC 3D Scanning Market Share Comparison by By Scanner Type (2016-2032)
- Table 121: APAC 3D Scanning Market Share Comparison by By Range (2016-2032)
- Table 122: APAC 3D Scanning Market Share Comparison by By Services (2016-2032)
- Table 123: APAC 3D Scanning Market Share Comparison by Application Analysis (2016-2032)
- Table 124: APAC 3D Scanning Market Share Comparison by By Industry (2016-2032)
- Table 125: Latin America 3D Scanning Market Comparison by By Scanner Type (2016-2032)
- Table 126: Latin America 3D Scanning Market Comparison by By Range (2016-2032)
- Table 127: Latin America 3D Scanning Market Comparison by By Services (2016-2032)
- Table 128: Latin America 3D Scanning Market Comparison by Application Analysis (2016-2032)
- Table 129: Latin America 3D Scanning Market Comparison by By Industry (2016-2032)
- Table 130: Latin America 3D Scanning Market Revenue (US$ Mn) Comparison by Country (2016-2032)
- Table 131: Latin America 3D Scanning Market Revenue (US$ Mn) (2016-2032)
- Table 132: Latin America 3D Scanning Market Revenue (US$ Mn) Comparison by Country (2016-2032)
- Table 133: Latin America 3D Scanning Market Revenue (US$ Mn) Comparison by By Scanner Type (2016-2032)
- Table 134: Latin America 3D Scanning Market Revenue (US$ Mn) Comparison by By Range (2016-2032)
- Table 135: Latin America 3D Scanning Market Revenue (US$ Mn) Comparison by By Services (2016-2032)
- Table 136: Latin America 3D Scanning Market Revenue (US$ Mn) Comparison by Application Analysis (2016-2032)
- Table 137: Latin America 3D Scanning Market Revenue (US$ Mn) Comparison by By Industry (2016-2032)
- Table 138: Latin America 3D Scanning Market Y-o-Y Growth Rate Comparison by Country (2016-2032)
- Table 139: Latin America 3D Scanning Market Y-o-Y Growth Rate Comparison by By Scanner Type (2016-2032)
- Table 140: Latin America 3D Scanning Market Y-o-Y Growth Rate Comparison by By Range (2016-2032)
- Table 141: Latin America 3D Scanning Market Y-o-Y Growth Rate Comparison by By Services (2016-2032)
- Table 142: Latin America 3D Scanning Market Y-o-Y Growth Rate Comparison by Application Analysis (2016-2032)
- Table 143: Latin America 3D Scanning Market Y-o-Y Growth Rate Comparison by By Industry (2016-2032)
- Table 144: Latin America 3D Scanning Market Share Comparison by Country (2016-2032)
- Table 145: Latin America 3D Scanning Market Share Comparison by By Scanner Type (2016-2032)
- Table 146: Latin America 3D Scanning Market Share Comparison by By Range (2016-2032)
- Table 147: Latin America 3D Scanning Market Share Comparison by By Services (2016-2032)
- Table 148: Latin America 3D Scanning Market Share Comparison by Application Analysis (2016-2032)
- Table 149: Latin America 3D Scanning Market Share Comparison by By Industry (2016-2032)
- Table 150: Middle East & Africa 3D Scanning Market Comparison by By Scanner Type (2016-2032)
- Table 151: Middle East & Africa 3D Scanning Market Comparison by By Range (2016-2032)
- Table 152: Middle East & Africa 3D Scanning Market Comparison by By Services (2016-2032)
- Table 153: Middle East & Africa 3D Scanning Market Comparison by Application Analysis (2016-2032)
- Table 154: Middle East & Africa 3D Scanning Market Comparison by By Industry (2016-2032)
- Table 155: Middle East & Africa 3D Scanning Market Revenue (US$ Mn) Comparison by Country (2016-2032)
- Table 156: Middle East & Africa 3D Scanning Market Revenue (US$ Mn) (2016-2032)
- Table 157: Middle East & Africa 3D Scanning Market Revenue (US$ Mn) Comparison by Country (2016-2032)
- Table 158: Middle East & Africa 3D Scanning Market Revenue (US$ Mn) Comparison by By Scanner Type (2016-2032)
- Table 159: Middle East & Africa 3D Scanning Market Revenue (US$ Mn) Comparison by By Range (2016-2032)
- Table 160: Middle East & Africa 3D Scanning Market Revenue (US$ Mn) Comparison by By Services (2016-2032)
- Table 161: Middle East & Africa 3D Scanning Market Revenue (US$ Mn) Comparison by Application Analysis (2016-2032)
- Table 162: Middle East & Africa 3D Scanning Market Revenue (US$ Mn) Comparison by By Industry (2016-2032)
- Table 163: Middle East & Africa 3D Scanning Market Y-o-Y Growth Rate Comparison by Country (2016-2032)
- Table 164: Middle East & Africa 3D Scanning Market Y-o-Y Growth Rate Comparison by By Scanner Type (2016-2032)
- Table 165: Middle East & Africa 3D Scanning Market Y-o-Y Growth Rate Comparison by By Range (2016-2032)
- Table 166: Middle East & Africa 3D Scanning Market Y-o-Y Growth Rate Comparison by By Services (2016-2032)
- Table 167: Middle East & Africa 3D Scanning Market Y-o-Y Growth Rate Comparison by Application Analysis (2016-2032)
- Table 168: Middle East & Africa 3D Scanning Market Y-o-Y Growth Rate Comparison by By Industry (2016-2032)
- Table 169: Middle East & Africa 3D Scanning Market Share Comparison by Country (2016-2032)
- Table 170: Middle East & Africa 3D Scanning Market Share Comparison by By Scanner Type (2016-2032)
- Table 171: Middle East & Africa 3D Scanning Market Share Comparison by By Range (2016-2032)
- Table 172: Middle East & Africa 3D Scanning Market Share Comparison by By Services (2016-2032)
- Table 173: Middle East & Africa 3D Scanning Market Share Comparison by Application Analysis (2016-2032)
- Table 174: Middle East & Africa 3D Scanning Market Share Comparison by By Industry (2016-2032)
- 1. Executive Summary
-
- Faro Technologies, Inc.
- Creaform, Inc.
- Direct Dimensions, Inc.
- GOM GmbH
- Konica Minolta, Inc.
- 3D Digital Corporation
- Autodesk, Inc.
- 3D Systems, Inc.
- Shape Grabber
- Maptek Pty Ltd.
Our Clients


View Our Licence Options
