
3D Knitting Services Market Size, Share, Growth, And Industry Analysis – By Application (Apparel and Fashion, Medical and Healthcare), By Material Used (Natural Fibers, Synthetic Fibers, Blended Fibers), By End-Use Industry (Textile and Fashion Industry, Medical and Healthcare Industry), By Technology, By Service Type, And By Region Forecast - 2023-2032
-
40895
-
June 2023
-
137
-


-
This report was compiled by Shreyas Rokade Shreyas Rokade is a seasoned Research Analyst with CMFE, bringing extensive expertise in market research and consulting, with a strong background in Chemical Engineering. Correspondence Team Lead-CMFE Linkedin | Detailed Market research Methodology Our methodology involves a mix of primary research, including interviews with leading mental health experts, and secondary research from reputable medical journals and databases. View Detailed Methodology Page
-
Quick Navigation
Report Overview
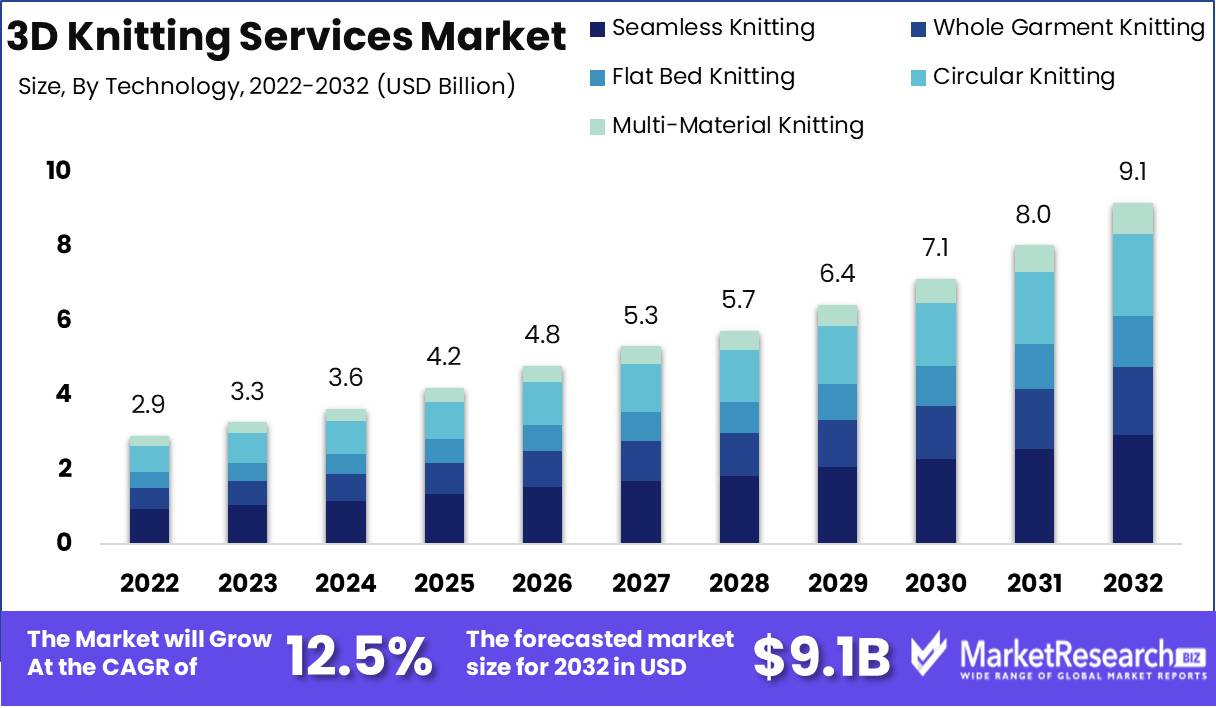
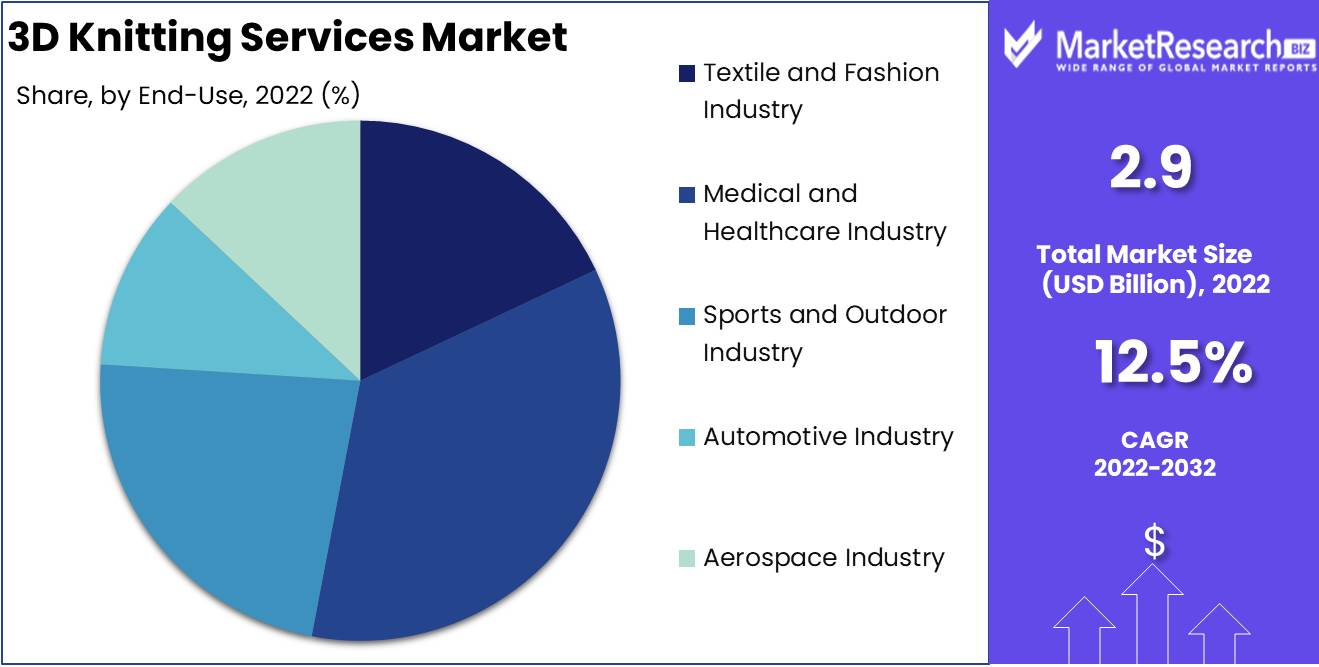
Global 3D Knitting Services Market revenue is expected to increase to USD 9.1 Bn in 2032 from USD 2.9 Bn in 2022, and register a revenue CAGR of 12.5% during the forecast period (2023 to 2032).
3D knitting services leverage innovative technology to produce intricate textile products. These services employ computer-controlled machines to create complex three-dimensional (3-D) knitted structures. A wide range of materials, from natural fibers to synthetics, can be used to tailor products for diverse applications, such as apparel, footwear, and medical devices. The equipment includes advanced knitting machines that translate digital designs into tangible items.
Requirements include design software proficiency and material selection expertise. Different technologies include seamless knitting for improved comfort, multi-material knitting for functional versatility, and customizable production for rapid prototyping. Services encompass product design, material sourcing, and efficient manufacturing, meeting evolving market demands.
The global 3D knitting services market is expected to gradually register remarkable revenue growth potential, driven by evolving consumer preferences and technological advancements, and the sheer convenience to produce products and items using a some-what unexpected technology and approach that was once a thing of science fiction.
Market revenue growth is expected to continue to be driven by increased adoption across industries such as fashion, medical, sports, and automotive, bolstered by ability of this technology to enable creation of intricate, customizable textiles. Rising demand for sustainable and efficient manufacturing practices is further expected to support revenue growth of the market.
As consumption trends shift toward personalized and functional products, 3D knitting services meet these demands through rapid prototyping and versatile material usage. Ongoing initiatives to develop more eco-friendly materials and devise and implement seamless production processes are expected to contribute to the sustainability. The advantages of reduced waste, shortened supply chains, and enhanced design flexibility are some other key factors supporting revenue growth of the global market.
Driving factors
Escalating demand for customization and personalization of products
A prominent trend is escalating demand for customization and personalization of a varying variety of products, as consumers seek unique designs and tailored fits. This trend significantly impacts revenue as 3D knitting technology enables the creation of individualized items that cater to a broader customer base and command higher prices. Moreover, increasing emphasis on sustainable practices aligns with rising environmental consciousness and focus on reducing waste and zero emissions. With its ability to reduce material waste, energy consumption, and carbon footprint management, 3D knitting attracts eco-conscious consumers, and this is positively impacting revenue growth of the market.
Rapid prototyping capabilities offered by 3D knitting technology
Rapid prototyping capabilities offered by 3D knitting services is a key factor driving market revenue growth currently. As product development cycles shrink and companies strive for quicker time-to-market, the ability to swiftly create and iterate prototypes becomes paramount. 3D knitting facilitates this process, allowing manufacturers to respond to market demands promptly and foster innovation.
Furthermore, the rise of functional and smart textiles is shaping the industry landscape. With consumers seeking technologically integrated products, 3D knitting's capacity to incorporate conductive yarns and other smart materials adds value and utility to the offerings, thereby supporting potential revenue growth of the market.
Versatility of 3D knitting and end-products
The versatility of 3D knitting is evident in its diverse industry applications. Beyond the traditional fashion sector, this technology has penetrated industries such as medical, automotive, and sports, thereby expanding possibilities and reducing dependency on a single industry for revenue. Also, the continuous exploration of advanced materials fuels innovation, and ongoing research and development efforts result in the introduction of novel fibers and blends, elevating the quality, durability, and performance of knitted products. This, in turn, drives premium pricing and cultivates customer loyalty, contributing positively to revenue growth.
Restraining Factors
High Initial Investment Costs
Adoption of advanced 3D knitting technology requires substantial upfront investment in machinery, software, and training. The impact is primarily evident on small and medium-sized businesses, which may face barriers to entry, thereby limiting market accessibility and potential revenue growth.
Limited Design Complexity
The complexity of certain designs and patterns might be challenging for current 3D knitting technology to replicate accurately. The impact can manifest as inability to fulfill intricate design demands and this could restrict market entry, and company ability to attract high-end fashion and luxury segments.
Opportunity
New avenues and diversified revenue streams driven by novel technology and capabilities
Companies operating in the global 3D knitting services market are presented with a spectrum of opportunities that can translate into diversified revenue streams. A significant avenue lies in catering to the rising demand for customized products. As consumers seek personalization and uniqueness, companies can capitalize on this trend by offering bespoke designs and tailored fits, commanding premium prices for these distinctive offerings. Moreover, the emphasis on sustainability and eco-friendliness provides an opening to position eco-conscious products as premium choices, attracting a niche yet expanding customer base that values environmentally responsible options.
Collaborative ventures with industries other than traditional fashion
Collaborative ventures with industries beyond traditional fashion, such as medical, automotive, and sports, unlock new opportunities. By tailoring their 3D knitting services to meet specialized requirements in these sectors, companies can tap into previously untapped markets, fostering revenue diversification. Incorporating technology into textiles is another avenue. The integration of conductive yarns and smart materials creates products with enhanced functionalities, catering to tech-savvy consumers willing to pay a premium for advanced features.
Investment in research and development and new revenue opportunities
Investment in research and development efforts geared towards pioneering advanced knitting materials presents another promising prospect. Developing innovative fibers and blends that enhance product quality and performance not only positions a company as an industry leader, but also offers premium materials for which customers are willing to pay a higher price.
Also, companies can leverage their expanding expertise by offering training programs, workshops, and educational resources on 3D knitting technology. These initiatives not only contribute to revenue generation but also establish the company as a knowledgeable and reputable entity in the field. By strategically embracing these opportunities and revenue streams, companies can create a path to sustained growth and competitive advantage in the 3D knitting services market.
By Application
The apparel and fashion segment accounts for a substantially larger revenue share among the application segments in the global 3D knitting services market. This is primarily due to the widespread adoption of 3D knitting technology by fashion brands and designers to create unique, customizable, and intricate garments.
Factors such as rising trend of personalized fashion, where consumers seek clothing items that reflect their individual style, and creation of specific designs, tailored fits, and complex patterns that resonate with modern consumers' preferences are supporting traction of this market. Also, the sustainability factor plays a significant role. With increasing awareness about eco-friendly practices in the fashion industry, 3D knitting offers reduced material waste and energy efficiency, and this is contributing to its rising popularity.
By End-Use Industry
The medical and healthcare segment is expected to continue to account for major revenue share in the global 3D knitting services market. This prominence is attributed to the growing demand for specialized medical textiles and devices that require precision and functionality. 3D knitting technology enables the production of medical textiles with tailored properties such as breathability, elasticity, and antibacterial properties.
Applications range from compression garments and wound dressings to orthopedic supports and prosthetics. As emphasis continues on patient comfort, hygiene, and innovative solutions, revenue growth of the global 3D knitting market is expected to incline owing to ability of this technology to address these requirements. In addition, the steadily aging global population and rising prevalence of chronic diseases and conditions is expected to further drive demand for medical textiles, thereby positively impacting revenue growth of this segment.
By Technology
The seamless knitting technology segment among the technology segment accounts for major revenue share in the global 3D knitting services market. Seamless knitting technology offers several advantages, such as enhanced comfort, reduced waste, and quicker production cycles. These benefits align well with consumer preferences with regard to seamless garments that offer superior fit and comfort. The technology's application spans various segments, including apparel, sports, and medical textiles. Athleisure and activewear, for instance, benefit from seamless knitting's ability to create functional and flexible designs. Moreover, seamless garments cater to the rising demand for activewear that is both fashionable and performance-oriented.
Key Market Segments
By Application
- Apparel and Fashion
- Medical and Healthcare
- Sports and Outdoor Equipment
- Automotive Interiors
- Home Textiles
By Material Used
- Natural Fibers (Cotton, Wool, Silk)
- Synthetic Fibers (Polyester, Nylon)
- Blended Fibers
- Technical Fibers (Carbon, Kevlar)
- Smart Textiles (Conductive Yarns)
By End-Use Industry
- Textile and Fashion Industry
- Medical and Healthcare Industry
- Sports and Outdoor Industry
- Automotive Industry
- Aerospace Industry
By Technology
- Seamless Knitting
- Whole Garment Knitting
- Flat Bed Knitting
- Circular Knitting
- Multi-Material Knitting
By Service Type
- Product Design and Development
- Rapid Prototyping
- Customized Manufacturing
- Material Sourcing and Consulting
- Quality Control and Testing
Regional Analysis
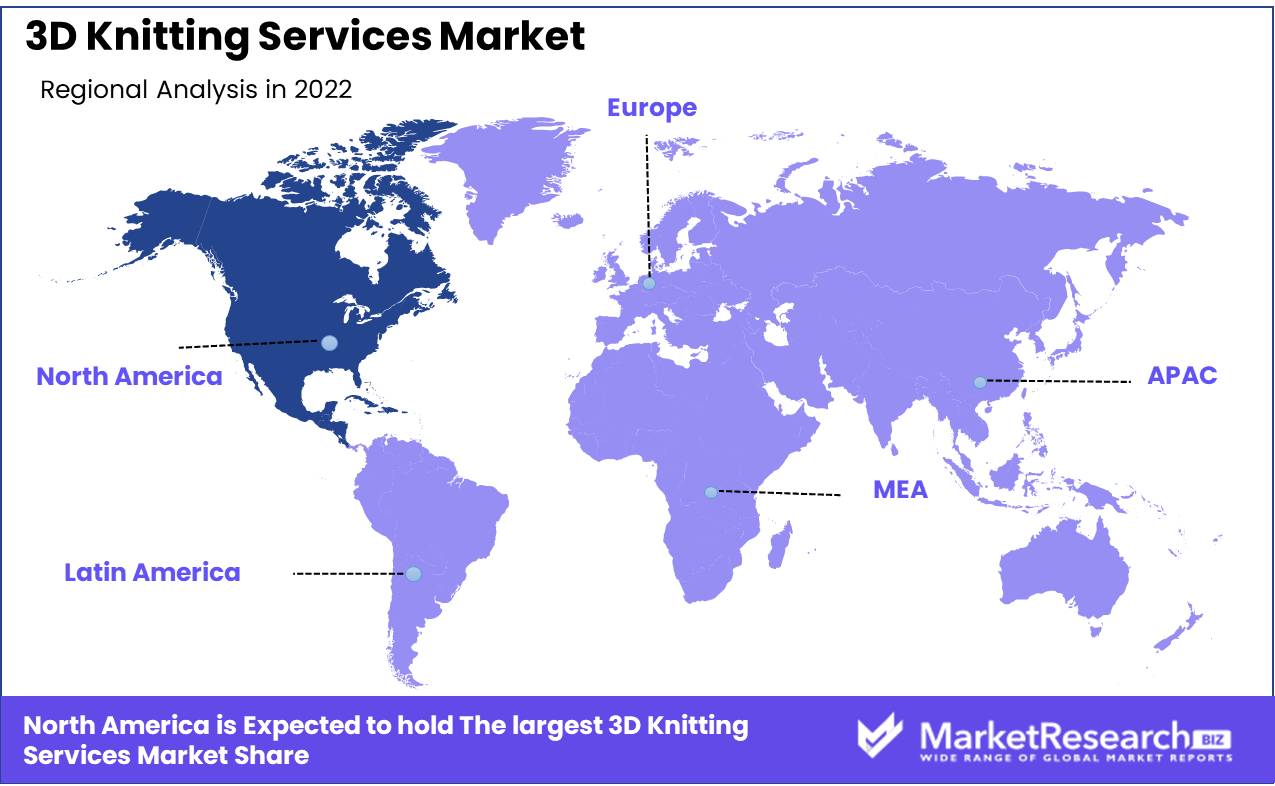
North America
In North America, the 3D knitting services market has been registering significant growth due to a robust fashion industry, tech-savvy consumers, and emphasis on sustainable practices and production approaches. The market in the region accounts for a substantially robust market share, and this is supported by major contribution from markets in the United States and Canada. Growth is also supported by the well-established fashion and sports industry and high demand for 3D knitted products in the country.
Rising demand for personalized and sustainable textiles aligns with the capabilities of 3D knitting technology. Industry growth is also supported by technological advancements such as development and introduction of advanced knitting machines and software solutions that enable intricate designs and seamless production.
Initiatives promoting local manufacturing and eco-friendly practices further contribute to revenue growth. Companies are focusing on reducing carbon footprint through proximity to customers and sustainable materials. North America's strong R&D sector also supports innovation in knitting materials, thereby enhancing product quality. Collaborations between fashion brands and technology companies have led to dynamic market offerings.
Europe
In Europe, the 3D knitting services market has gained momentum through a combination of fashion-forward consumer preferences and an increasing emphasis on sustainable practices. Germany, Italy, and the UK account for significant market shares respectively due to renowned fashion industries in these countries. Also, market revenue growth potential is driven by rising demand for customized and functional textiles, aligning well with 3D knitting capabilities.
Rapid industry growth in countries in the region is backed by research collaborations between textile companies and research institutions, leading to advancements in knitting materials and techniques. Technological developments, such as improved CAD software and automated knitting machines, further enhance market competitiveness. Initiatives to promote local manufacturing and circular fashion models support sustainable revenue growth. The European Union's focus on eco-friendly practices and textile innovation encourages companies to adopt 3D knitting technology to meet these criteria.
Asia-Pacific
Asia-Pacific dominates other regional markets in the global 3D knitting services market with key players in China, Japan, and South Korea. This region's market share is supported substantially by its manufacturing prowess and rapid technological adoption in major countries. Potential revenue growth is also driven by its vast consumer base, where 3D knitted products find applications in fashion, sports, and healthcare sectors. Market growth is further supported by the presence of leading textile manufacturers and a strong focus on innovation.
Technological developments in this region include integration of automation and robotics in knitting processes, which are enhancing efficiency and precision. Governments and industry associations are investing in R&D and promoting technology adoption to encourage the domestic textile sector. Initiatives to improve production sustainability and reduce waste also contributes to market revenue growth. As consumer awareness grows, the adoption of 3D knitting services is also expected to increase, thereby further driving revenue of the Asia-Pacific market.
Latin America
The Latin American 3D knitting services market is emerging with untapped potential. 3D knitting technology is gradually being incorporated into textile industries in countries such as Brazil, Mexico, and Argentina. While the market share is relatively smaller compared currently to countries such as the United States and some in Asia Pacific, the potential revenue growth is supported by a rising demand for fashion and sportswear, as well as the adoption of sustainable manufacturing practices.
Industry growth is also supported by collaborations between local textile manufacturers and global technology providers. Technological developments in this region are focused on improving the efficiency and cost-effectiveness of 3D knitting processes. Initiatives to promote domestic textile production and reduce reliance on imports are gaining traction, supporting the revenue growth of the market. As the fashion industry expands and consumers become more conscious of sustainable products, the Latin American market's revenue potential is poised for growth.
Middle East & Africa
The Middle East & Africa market is gradually exploring the potential of 3D knitting services. While the market share is relatively modest, the region's revenue growth potential is driven by a growing interest in fashion, innovative textiles, and local manufacturing. Countries such as Turkey, United Arab Emirates, and South Africa are expected to emerge at the forefront of this industry in terms of potential revenue growth over the forecast period.
Key Regions and Countries
North America
- US
- Canada
- Mexico
Western Europe
- Germany
- France
- The UK
- Spain
- Italy
- Portugal
- Ireland
- Austria
- Switzerland
- Benelux
- Nordic
- Rest of Western Europe
Eastern Europe
- Russia
- Poland
- The Czech Republic
- Greece
- Rest of Eastern Europe
APAC
- China
- Japan
- South Korea
- India
- Australia & New Zealand
- Indonesia
- Malaysia
- Philippines
- Singapore
- Thailand
- Vietnam
- Rest of APAC
Latin America
- Brazil
- Colombia
- Chile
- Argentina
- Costa Rica
- Rest of Latin America
Middle East & Africa
- Algeria
- Egypt
- Israel
- Kuwait
- Nigeria
- Saudi Arabia
- South Africa
- Turkey
- United Arab Emirates
- Rest of MEA
Competitive Landscape
The competitive landscape of the global 3-D knitting services market is characterized by a mix of established players, innovative startups, and niche service providers. This dynamic market is driven by technological advancements, changing consumer preferences, and the demand for sustainable and personalized textiles. Leading players in the market have positioned themselves as pioneers in 3D knitting technology, offering a range of services across various industries.
Shima Seiki Co., Ltd. and Stoll GmbH & Co. KG are prominent players renowned for their cutting-edge knitting machines and solutions. These companies have a strong presence in the fashion and textiles industry, providing seamless and whole garment knitting technologies. Santoni S.p.A. is recognized for its innovation in circular knitting machines, catering to the needs of various sectors including medical and sports textiles. These players hold significant market share due to their established reputation and comprehensive service offerings.
Kniterate Ltd. and Unmade Ltd. represent startups that have disrupted the industry by providing customizable, on-demand knitting services. The companies offer platforms that allow consumers to design and order personalized knitwear, catering to the trend of individualized fashion. These companies have gained attention for their user-friendly interfaces and direct-to-consumer approach.
The competitive landscape also features companies such as Viridis Apparel and Mayer & Cie GmbH & Co. KG, recognized for their commitment to sustainability and eco-friendly practices. These companies emphasize the use of recycled and organic materials in their 3D knitting services, aligning with the growing demand for sustainable textiles.
In addition to these major players, various smaller service providers are contributing to the diversification in the market. The landscape is also characterized by ongoing technological innovation, partnerships with other industries, and collaborations between traditional textile manufacturers and technology providers.
As the market continues to evolve, competition remains robust, driven by the need to offer unique designs, efficient production processes, and sustainable solutions. Leading players and service providers are positioning themselves strategically to capture various segments of the market, ensuring that they can adapt to changing consumer preferences and capitalize on emerging opportunities.
Top Key Players in 3D Knitting Services Market
- Shima Seiki Co., Ltd.
- Stoll GmbH & Co. KG
- Santoni S.p.A.
- Stoll AG & Co. KG
- Kern-Liebers Textile
- Mayer & Cie GmbH & Co. KG
- Cifra S.p.A.
- Viridis Apparel
- Kniterate Ltd.
- Seamless Garment Technology Co., Ltd.
- Sock Fancy
- Unmade Ltd.
- EFI Optitex
- Aeoon Technologies GmbH
- Sewbo Inc.
Recent Development
- In 2023, Nimble Industries is a 3D knitting company, has announced a new partnership with Adidas to develop 3D knitted sportswear. The partnership will focus on developing high-performance 3D knitted fabrics that are lightweight, breathable, and comfortable.
- In 2023, Evolve3D is a 3D knitting company, has launched a new line of 3D knitted footwear. The footwear is made from a proprietary 3D knitting material that is said to be more durable and comfortable than traditional knitted footwear.
- In 2023, Thread.Works is a 3D knitting company, has announced a new funding round of $10 million. The funding will be used to expand the company's manufacturing capacity and to develop new 3D knitting technologies.
- In 2023, 3D4Medical is a 3D printing company, has launched a new line of 3D knitted medical devices. The devices are made from a biocompatible 3D knitting material that is said to be more comfortable and efficient than traditional medical devices.
Report Scope:
Report Features Description Market Value (2022) USD 2.9 BN Forecast Revenue (2032) USD 9.1 BN CAGR (2023-2032) 12.5% Base Year for Estimation 2022 Historic Period 2016-2022 Forecast Period 2023-2032 Report Coverage Revenue Forecast, Market Dynamics, Competitive Landscape, Competitive Analysis, Segment and Sub-segment Breakdown and Analysis, Trend Analysis, Opportunity & Strategy Reporting Segments Covered By Application (Apparel and Fashion, Medical and Healthcare, Sports and Outdoor Equipment, Automotive Interiors, Home Textiles), By Material Used (Natural Fibers (Cotton, Wool, Silk), Synthetic Fibers (Polyester, Nylon), Blended Fibers, Technical Fibers (Carbon, Kevlar), Smart Textiles (Conductive Yarns)), By End-Use Industry (Textile and Fashion Industry, Medical and Healthcare Industry, Sports and Outdoor Industry, Automotive Industry, Aerospace Industry), By Technology (Seamless Knitting, Whole Garment Knitting, Flat Bed Knitting, Circular Knitting, Multi-Material Knitting), By Service Type (Product Design and Development, Rapid Prototyping, Customized Manufacturing, Material Sourcing and Consulting, Quality Control and Testing) Regional Analysis North America (United States, Canada); Asia Pacific (China, India, Japan, Australia & New Zealand, Association of Southeast Asian Nations (ASEAN), Rest of Asia Pacific); Europe (Germany, U.K., France, Spain, Italy, Russia, Poland, BENELUX [Belgium, the Netherlands, Luxembourg], NORDIC [Norway, Sweden, Finland, Denmark], Rest of Europe); Latin America (Brazil, Mexico, Argentina, Rest of Latin America); Middle East & Africa (Saudi Arabia, United Arab Emirates, South Africa, Egypt, Israel, Rest of Middle East & Africa) Competitive Landscape Shima Seiki Co., Ltd., Stoll GmbH & Co. KG, Santoni S.p.A., Stoll AG & Co. KG, Kern-Liebers Textile, Mayer & Cie GmbH & Co. KG, Cifra S.p.A., Viridis Apparel, Kniterate Ltd., Seamless Garment Technology Co., Ltd., Sock Fancy, Unmade Ltd., EFI Optitex, Aeoon Technologies GmbH, Sewbo Inc. Customization Scope Further customization of segments, regions/country-breakdown can be provided upon request. Purchase Options Licenses Available are Single User License, Multi-User License (Up to 5 Users), Corporate Use License (Unlimited User and Printable PDF) -
- 1. Executive Summary
- 1.1. Definition
- 1.2. Taxonomy
- 1.3. Research Scope
- 1.4. Key Analysis
- 1.5. Key Findings by Major Segments
- 1.6. Top strategies by Major Players
- 2. Global 3D Knitting Services Market Overview
- 2.1. 3D Knitting Services Market Dynamics
- 2.1.1. Drivers
- 2.1.2. Opportunities
- 2.1.3. Restraints
- 2.1.4. Challenges
- 2.2. Macro-economic Factors
- 2.3. Regulatory Framework
- 2.4. Market Investment Feasibility Index
- 2.5. PEST Analysis
- 2.6. PORTER’S Five Force Analysis
- 2.7. Drivers & Restraints Impact Analysis
- 2.8. Industry Chain Analysis
- 2.9. Cost Structure Analysis
- 2.10. Marketing Strategy
- 2.11. Russia-Ukraine War Impact Analysis
- 2.12. Opportunity Map Analysis
- 2.13. Market Competition Scenario Analysis
- 2.14. Product Life Cycle Analysis
- 2.15. Opportunity Orbits
- 2.16. Manufacturer Intensity Map
- 2.17. Major Companies sales by Value & Volume
- 2.1. 3D Knitting Services Market Dynamics
- 3. Global 3D Knitting Services Market Analysis, Opportunity and Forecast, 2016-2032
- 3.1. Global 3D Knitting Services Market Analysis, 2016-2021
- 3.2. Global 3D Knitting Services Market Opportunity and Forecast, 2023-2032
- 3.3. Global 3D Knitting Services Market Analysis, Opportunity and Forecast, By By Application, 2016-2032
- 3.3.1. Global 3D Knitting Services Market Analysis by By Application: Introduction
- 3.3.2. Market Size Absolute $ Opportunity Analysis and Forecast, By By Application, 2016-2032
- 3.3.3. Apparel and Fashion
- 3.3.4. Medical and Healthcare
- 3.3.5. Sports and Outdoor Equipment
- 3.3.6. Automotive Interiors
- 3.3.7. Home Textiles
- 3.4. Global 3D Knitting Services Market Analysis, Opportunity and Forecast, By By Material Used, 2016-2032
- 3.4.1. Global 3D Knitting Services Market Analysis by By Material Used: Introduction
- 3.4.2. Market Size Absolute $ Opportunity Analysis and Forecast, By By Material Used, 2016-2032
- 3.4.3. Natural Fibers (Cotton, Wool, Silk)
- 3.4.4. Synthetic Fibers (Polyester, Nylon)
- 3.4.5. Blended Fibers
- 3.4.6. Technical Fibers (Carbon, Kevlar)
- 3.4.7. Smart Textiles (Conductive Yarns)
- 3.5. Global 3D Knitting Services Market Analysis, Opportunity and Forecast, By By End-Use Industry, 2016-2032
- 3.5.1. Global 3D Knitting Services Market Analysis by By End-Use Industry: Introduction
- 3.5.2. Market Size Absolute $ Opportunity Analysis and Forecast, By By End-Use Industry, 2016-2032
- 3.5.3. Textile and Fashion Industry
- 3.5.4. Medical and Healthcare Industry
- 3.5.5. Sports and Outdoor Industry
- 3.5.6. Automotive Industry
- 3.5.7. Aerospace Industry
- 3.6. Global 3D Knitting Services Market Analysis, Opportunity and Forecast, By By Technology, 2016-2032
- 3.6.1. Global 3D Knitting Services Market Analysis by By Technology: Introduction
- 3.6.2. Market Size Absolute $ Opportunity Analysis and Forecast, By By Technology, 2016-2032
- 3.6.3. Seamless Knitting
- 3.6.4. Whole Garment Knitting
- 3.6.5. Flat Bed Knitting
- 3.6.6. Circular Knitting
- 3.6.7. Multi-Material Knitting
- 3.7. Global 3D Knitting Services Market Analysis, Opportunity and Forecast, By By Service Type, 2016-2032
- 3.7.1. Global 3D Knitting Services Market Analysis by By Service Type: Introduction
- 3.7.2. Market Size Absolute $ Opportunity Analysis and Forecast, By By Service Type, 2016-2032
- 3.7.3. Product Design and Development
- 3.7.4. Rapid Prototyping
- 3.7.5. Customized Manufacturing
- 3.7.6. Material Sourcing and Consulting
- 3.7.7. Quality Control and Testing
- 4. North America 3D Knitting Services Market Analysis, Opportunity and Forecast, 2016-2032
- 4.1. North America 3D Knitting Services Market Analysis, 2016-2021
- 4.2. North America 3D Knitting Services Market Opportunity and Forecast, 2023-2032
- 4.3. North America 3D Knitting Services Market Analysis, Opportunity and Forecast, By By Application, 2016-2032
- 4.3.1. North America 3D Knitting Services Market Analysis by By Application: Introduction
- 4.3.2. Market Size Absolute $ Opportunity Analysis and Forecast, By By Application, 2016-2032
- 4.3.3. Apparel and Fashion
- 4.3.4. Medical and Healthcare
- 4.3.5. Sports and Outdoor Equipment
- 4.3.6. Automotive Interiors
- 4.3.7. Home Textiles
- 4.4. North America 3D Knitting Services Market Analysis, Opportunity and Forecast, By By Material Used, 2016-2032
- 4.4.1. North America 3D Knitting Services Market Analysis by By Material Used: Introduction
- 4.4.2. Market Size Absolute $ Opportunity Analysis and Forecast, By By Material Used, 2016-2032
- 4.4.3. Natural Fibers (Cotton, Wool, Silk)
- 4.4.4. Synthetic Fibers (Polyester, Nylon)
- 4.4.5. Blended Fibers
- 4.4.6. Technical Fibers (Carbon, Kevlar)
- 4.4.7. Smart Textiles (Conductive Yarns)
- 4.5. North America 3D Knitting Services Market Analysis, Opportunity and Forecast, By By End-Use Industry, 2016-2032
- 4.5.1. North America 3D Knitting Services Market Analysis by By End-Use Industry: Introduction
- 4.5.2. Market Size Absolute $ Opportunity Analysis and Forecast, By By End-Use Industry, 2016-2032
- 4.5.3. Textile and Fashion Industry
- 4.5.4. Medical and Healthcare Industry
- 4.5.5. Sports and Outdoor Industry
- 4.5.6. Automotive Industry
- 4.5.7. Aerospace Industry
- 4.6. North America 3D Knitting Services Market Analysis, Opportunity and Forecast, By By Technology, 2016-2032
- 4.6.1. North America 3D Knitting Services Market Analysis by By Technology: Introduction
- 4.6.2. Market Size Absolute $ Opportunity Analysis and Forecast, By By Technology, 2016-2032
- 4.6.3. Seamless Knitting
- 4.6.4. Whole Garment Knitting
- 4.6.5. Flat Bed Knitting
- 4.6.6. Circular Knitting
- 4.6.7. Multi-Material Knitting
- 4.7. North America 3D Knitting Services Market Analysis, Opportunity and Forecast, By By Service Type, 2016-2032
- 4.7.1. North America 3D Knitting Services Market Analysis by By Service Type: Introduction
- 4.7.2. Market Size Absolute $ Opportunity Analysis and Forecast, By By Service Type, 2016-2032
- 4.7.3. Product Design and Development
- 4.7.4. Rapid Prototyping
- 4.7.5. Customized Manufacturing
- 4.7.6. Material Sourcing and Consulting
- 4.7.7. Quality Control and Testing
- 4.8. North America 3D Knitting Services Market Analysis, Opportunity and Forecast, By Country , 2016-2032
- 4.8.1. North America 3D Knitting Services Market Analysis by Country : Introduction
- 4.8.2. Market Size Absolute $ Opportunity Analysis and Forecast, Country , 2016-2032
- 4.8.2.1. The US
- 4.8.2.2. Canada
- 4.8.2.3. Mexico
- 5. Western Europe 3D Knitting Services Market Analysis, Opportunity and Forecast, 2016-2032
- 5.1. Western Europe 3D Knitting Services Market Analysis, 2016-2021
- 5.2. Western Europe 3D Knitting Services Market Opportunity and Forecast, 2023-2032
- 5.3. Western Europe 3D Knitting Services Market Analysis, Opportunity and Forecast, By By Application, 2016-2032
- 5.3.1. Western Europe 3D Knitting Services Market Analysis by By Application: Introduction
- 5.3.2. Market Size Absolute $ Opportunity Analysis and Forecast, By By Application, 2016-2032
- 5.3.3. Apparel and Fashion
- 5.3.4. Medical and Healthcare
- 5.3.5. Sports and Outdoor Equipment
- 5.3.6. Automotive Interiors
- 5.3.7. Home Textiles
- 5.4. Western Europe 3D Knitting Services Market Analysis, Opportunity and Forecast, By By Material Used, 2016-2032
- 5.4.1. Western Europe 3D Knitting Services Market Analysis by By Material Used: Introduction
- 5.4.2. Market Size Absolute $ Opportunity Analysis and Forecast, By By Material Used, 2016-2032
- 5.4.3. Natural Fibers (Cotton, Wool, Silk)
- 5.4.4. Synthetic Fibers (Polyester, Nylon)
- 5.4.5. Blended Fibers
- 5.4.6. Technical Fibers (Carbon, Kevlar)
- 5.4.7. Smart Textiles (Conductive Yarns)
- 5.5. Western Europe 3D Knitting Services Market Analysis, Opportunity and Forecast, By By End-Use Industry, 2016-2032
- 5.5.1. Western Europe 3D Knitting Services Market Analysis by By End-Use Industry: Introduction
- 5.5.2. Market Size Absolute $ Opportunity Analysis and Forecast, By By End-Use Industry, 2016-2032
- 5.5.3. Textile and Fashion Industry
- 5.5.4. Medical and Healthcare Industry
- 5.5.5. Sports and Outdoor Industry
- 5.5.6. Automotive Industry
- 5.5.7. Aerospace Industry
- 5.6. Western Europe 3D Knitting Services Market Analysis, Opportunity and Forecast, By By Technology, 2016-2032
- 5.6.1. Western Europe 3D Knitting Services Market Analysis by By Technology: Introduction
- 5.6.2. Market Size Absolute $ Opportunity Analysis and Forecast, By By Technology, 2016-2032
- 5.6.3. Seamless Knitting
- 5.6.4. Whole Garment Knitting
- 5.6.5. Flat Bed Knitting
- 5.6.6. Circular Knitting
- 5.6.7. Multi-Material Knitting
- 5.7. Western Europe 3D Knitting Services Market Analysis, Opportunity and Forecast, By By Service Type, 2016-2032
- 5.7.1. Western Europe 3D Knitting Services Market Analysis by By Service Type: Introduction
- 5.7.2. Market Size Absolute $ Opportunity Analysis and Forecast, By By Service Type, 2016-2032
- 5.7.3. Product Design and Development
- 5.7.4. Rapid Prototyping
- 5.7.5. Customized Manufacturing
- 5.7.6. Material Sourcing and Consulting
- 5.7.7. Quality Control and Testing
- 5.8. Western Europe 3D Knitting Services Market Analysis, Opportunity and Forecast, By Country , 2016-2032
- 5.8.1. Western Europe 3D Knitting Services Market Analysis by Country : Introduction
- 5.8.2. Market Size Absolute $ Opportunity Analysis and Forecast, Country , 2016-2032
- 5.8.2.1. Germany
- 5.8.2.2. France
- 5.8.2.3. The UK
- 5.8.2.4. Spain
- 5.8.2.5. Italy
- 5.8.2.6. Portugal
- 5.8.2.7. Ireland
- 5.8.2.8. Austria
- 5.8.2.9. Switzerland
- 5.8.2.10. Benelux
- 5.8.2.11. Nordic
- 5.8.2.12. Rest of Western Europe
- 6. Eastern Europe 3D Knitting Services Market Analysis, Opportunity and Forecast, 2016-2032
- 6.1. Eastern Europe 3D Knitting Services Market Analysis, 2016-2021
- 6.2. Eastern Europe 3D Knitting Services Market Opportunity and Forecast, 2023-2032
- 6.3. Eastern Europe 3D Knitting Services Market Analysis, Opportunity and Forecast, By By Application, 2016-2032
- 6.3.1. Eastern Europe 3D Knitting Services Market Analysis by By Application: Introduction
- 6.3.2. Market Size Absolute $ Opportunity Analysis and Forecast, By By Application, 2016-2032
- 6.3.3. Apparel and Fashion
- 6.3.4. Medical and Healthcare
- 6.3.5. Sports and Outdoor Equipment
- 6.3.6. Automotive Interiors
- 6.3.7. Home Textiles
- 6.4. Eastern Europe 3D Knitting Services Market Analysis, Opportunity and Forecast, By By Material Used, 2016-2032
- 6.4.1. Eastern Europe 3D Knitting Services Market Analysis by By Material Used: Introduction
- 6.4.2. Market Size Absolute $ Opportunity Analysis and Forecast, By By Material Used, 2016-2032
- 6.4.3. Natural Fibers (Cotton, Wool, Silk)
- 6.4.4. Synthetic Fibers (Polyester, Nylon)
- 6.4.5. Blended Fibers
- 6.4.6. Technical Fibers (Carbon, Kevlar)
- 6.4.7. Smart Textiles (Conductive Yarns)
- 6.5. Eastern Europe 3D Knitting Services Market Analysis, Opportunity and Forecast, By By End-Use Industry, 2016-2032
- 6.5.1. Eastern Europe 3D Knitting Services Market Analysis by By End-Use Industry: Introduction
- 6.5.2. Market Size Absolute $ Opportunity Analysis and Forecast, By By End-Use Industry, 2016-2032
- 6.5.3. Textile and Fashion Industry
- 6.5.4. Medical and Healthcare Industry
- 6.5.5. Sports and Outdoor Industry
- 6.5.6. Automotive Industry
- 6.5.7. Aerospace Industry
- 6.6. Eastern Europe 3D Knitting Services Market Analysis, Opportunity and Forecast, By By Technology, 2016-2032
- 6.6.1. Eastern Europe 3D Knitting Services Market Analysis by By Technology: Introduction
- 6.6.2. Market Size Absolute $ Opportunity Analysis and Forecast, By By Technology, 2016-2032
- 6.6.3. Seamless Knitting
- 6.6.4. Whole Garment Knitting
- 6.6.5. Flat Bed Knitting
- 6.6.6. Circular Knitting
- 6.6.7. Multi-Material Knitting
- 6.7. Eastern Europe 3D Knitting Services Market Analysis, Opportunity and Forecast, By By Service Type, 2016-2032
- 6.7.1. Eastern Europe 3D Knitting Services Market Analysis by By Service Type: Introduction
- 6.7.2. Market Size Absolute $ Opportunity Analysis and Forecast, By By Service Type, 2016-2032
- 6.7.3. Product Design and Development
- 6.7.4. Rapid Prototyping
- 6.7.5. Customized Manufacturing
- 6.7.6. Material Sourcing and Consulting
- 6.7.7. Quality Control and Testing
- 6.8. Eastern Europe 3D Knitting Services Market Analysis, Opportunity and Forecast, By Country , 2016-2032
- 6.8.1. Eastern Europe 3D Knitting Services Market Analysis by Country : Introduction
- 6.8.2. Market Size Absolute $ Opportunity Analysis and Forecast, Country , 2016-2032
- 6.8.2.1. Russia
- 6.8.2.2. Poland
- 6.8.2.3. The Czech Republic
- 6.8.2.4. Greece
- 6.8.2.5. Rest of Eastern Europe
- 7. APAC 3D Knitting Services Market Analysis, Opportunity and Forecast, 2016-2032
- 7.1. APAC 3D Knitting Services Market Analysis, 2016-2021
- 7.2. APAC 3D Knitting Services Market Opportunity and Forecast, 2023-2032
- 7.3. APAC 3D Knitting Services Market Analysis, Opportunity and Forecast, By By Application, 2016-2032
- 7.3.1. APAC 3D Knitting Services Market Analysis by By Application: Introduction
- 7.3.2. Market Size Absolute $ Opportunity Analysis and Forecast, By By Application, 2016-2032
- 7.3.3. Apparel and Fashion
- 7.3.4. Medical and Healthcare
- 7.3.5. Sports and Outdoor Equipment
- 7.3.6. Automotive Interiors
- 7.3.7. Home Textiles
- 7.4. APAC 3D Knitting Services Market Analysis, Opportunity and Forecast, By By Material Used, 2016-2032
- 7.4.1. APAC 3D Knitting Services Market Analysis by By Material Used: Introduction
- 7.4.2. Market Size Absolute $ Opportunity Analysis and Forecast, By By Material Used, 2016-2032
- 7.4.3. Natural Fibers (Cotton, Wool, Silk)
- 7.4.4. Synthetic Fibers (Polyester, Nylon)
- 7.4.5. Blended Fibers
- 7.4.6. Technical Fibers (Carbon, Kevlar)
- 7.4.7. Smart Textiles (Conductive Yarns)
- 7.5. APAC 3D Knitting Services Market Analysis, Opportunity and Forecast, By By End-Use Industry, 2016-2032
- 7.5.1. APAC 3D Knitting Services Market Analysis by By End-Use Industry: Introduction
- 7.5.2. Market Size Absolute $ Opportunity Analysis and Forecast, By By End-Use Industry, 2016-2032
- 7.5.3. Textile and Fashion Industry
- 7.5.4. Medical and Healthcare Industry
- 7.5.5. Sports and Outdoor Industry
- 7.5.6. Automotive Industry
- 7.5.7. Aerospace Industry
- 7.6. APAC 3D Knitting Services Market Analysis, Opportunity and Forecast, By By Technology, 2016-2032
- 7.6.1. APAC 3D Knitting Services Market Analysis by By Technology: Introduction
- 7.6.2. Market Size Absolute $ Opportunity Analysis and Forecast, By By Technology, 2016-2032
- 7.6.3. Seamless Knitting
- 7.6.4. Whole Garment Knitting
- 7.6.5. Flat Bed Knitting
- 7.6.6. Circular Knitting
- 7.6.7. Multi-Material Knitting
- 7.7. APAC 3D Knitting Services Market Analysis, Opportunity and Forecast, By By Service Type, 2016-2032
- 7.7.1. APAC 3D Knitting Services Market Analysis by By Service Type: Introduction
- 7.7.2. Market Size Absolute $ Opportunity Analysis and Forecast, By By Service Type, 2016-2032
- 7.7.3. Product Design and Development
- 7.7.4. Rapid Prototyping
- 7.7.5. Customized Manufacturing
- 7.7.6. Material Sourcing and Consulting
- 7.7.7. Quality Control and Testing
- 7.8. APAC 3D Knitting Services Market Analysis, Opportunity and Forecast, By Country , 2016-2032
- 7.8.1. APAC 3D Knitting Services Market Analysis by Country : Introduction
- 7.8.2. Market Size Absolute $ Opportunity Analysis and Forecast, Country , 2016-2032
- 7.8.2.1. China
- 7.8.2.2. Japan
- 7.8.2.3. South Korea
- 7.8.2.4. India
- 7.8.2.5. Australia & New Zeland
- 7.8.2.6. Indonesia
- 7.8.2.7. Malaysia
- 7.8.2.8. Philippines
- 7.8.2.9. Singapore
- 7.8.2.10. Thailand
- 7.8.2.11. Vietnam
- 7.8.2.12. Rest of APAC
- 8. Latin America 3D Knitting Services Market Analysis, Opportunity and Forecast, 2016-2032
- 8.1. Latin America 3D Knitting Services Market Analysis, 2016-2021
- 8.2. Latin America 3D Knitting Services Market Opportunity and Forecast, 2023-2032
- 8.3. Latin America 3D Knitting Services Market Analysis, Opportunity and Forecast, By By Application, 2016-2032
- 8.3.1. Latin America 3D Knitting Services Market Analysis by By Application: Introduction
- 8.3.2. Market Size Absolute $ Opportunity Analysis and Forecast, By By Application, 2016-2032
- 8.3.3. Apparel and Fashion
- 8.3.4. Medical and Healthcare
- 8.3.5. Sports and Outdoor Equipment
- 8.3.6. Automotive Interiors
- 8.3.7. Home Textiles
- 8.4. Latin America 3D Knitting Services Market Analysis, Opportunity and Forecast, By By Material Used, 2016-2032
- 8.4.1. Latin America 3D Knitting Services Market Analysis by By Material Used: Introduction
- 8.4.2. Market Size Absolute $ Opportunity Analysis and Forecast, By By Material Used, 2016-2032
- 8.4.3. Natural Fibers (Cotton, Wool, Silk)
- 8.4.4. Synthetic Fibers (Polyester, Nylon)
- 8.4.5. Blended Fibers
- 8.4.6. Technical Fibers (Carbon, Kevlar)
- 8.4.7. Smart Textiles (Conductive Yarns)
- 8.5. Latin America 3D Knitting Services Market Analysis, Opportunity and Forecast, By By End-Use Industry, 2016-2032
- 8.5.1. Latin America 3D Knitting Services Market Analysis by By End-Use Industry: Introduction
- 8.5.2. Market Size Absolute $ Opportunity Analysis and Forecast, By By End-Use Industry, 2016-2032
- 8.5.3. Textile and Fashion Industry
- 8.5.4. Medical and Healthcare Industry
- 8.5.5. Sports and Outdoor Industry
- 8.5.6. Automotive Industry
- 8.5.7. Aerospace Industry
- 8.6. Latin America 3D Knitting Services Market Analysis, Opportunity and Forecast, By By Technology, 2016-2032
- 8.6.1. Latin America 3D Knitting Services Market Analysis by By Technology: Introduction
- 8.6.2. Market Size Absolute $ Opportunity Analysis and Forecast, By By Technology, 2016-2032
- 8.6.3. Seamless Knitting
- 8.6.4. Whole Garment Knitting
- 8.6.5. Flat Bed Knitting
- 8.6.6. Circular Knitting
- 8.6.7. Multi-Material Knitting
- 8.7. Latin America 3D Knitting Services Market Analysis, Opportunity and Forecast, By By Service Type, 2016-2032
- 8.7.1. Latin America 3D Knitting Services Market Analysis by By Service Type: Introduction
- 8.7.2. Market Size Absolute $ Opportunity Analysis and Forecast, By By Service Type, 2016-2032
- 8.7.3. Product Design and Development
- 8.7.4. Rapid Prototyping
- 8.7.5. Customized Manufacturing
- 8.7.6. Material Sourcing and Consulting
- 8.7.7. Quality Control and Testing
- 8.8. Latin America 3D Knitting Services Market Analysis, Opportunity and Forecast, By Country , 2016-2032
- 8.8.1. Latin America 3D Knitting Services Market Analysis by Country : Introduction
- 8.8.2. Market Size Absolute $ Opportunity Analysis and Forecast, Country , 2016-2032
- 8.8.2.1. Brazil
- 8.8.2.2. Colombia
- 8.8.2.3. Chile
- 8.8.2.4. Argentina
- 8.8.2.5. Costa Rica
- 8.8.2.6. Rest of Latin America
- 9. Middle East & Africa 3D Knitting Services Market Analysis, Opportunity and Forecast, 2016-2032
- 9.1. Middle East & Africa 3D Knitting Services Market Analysis, 2016-2021
- 9.2. Middle East & Africa 3D Knitting Services Market Opportunity and Forecast, 2023-2032
- 9.3. Middle East & Africa 3D Knitting Services Market Analysis, Opportunity and Forecast, By By Application, 2016-2032
- 9.3.1. Middle East & Africa 3D Knitting Services Market Analysis by By Application: Introduction
- 9.3.2. Market Size Absolute $ Opportunity Analysis and Forecast, By By Application, 2016-2032
- 9.3.3. Apparel and Fashion
- 9.3.4. Medical and Healthcare
- 9.3.5. Sports and Outdoor Equipment
- 9.3.6. Automotive Interiors
- 9.3.7. Home Textiles
- 9.4. Middle East & Africa 3D Knitting Services Market Analysis, Opportunity and Forecast, By By Material Used, 2016-2032
- 9.4.1. Middle East & Africa 3D Knitting Services Market Analysis by By Material Used: Introduction
- 9.4.2. Market Size Absolute $ Opportunity Analysis and Forecast, By By Material Used, 2016-2032
- 9.4.3. Natural Fibers (Cotton, Wool, Silk)
- 9.4.4. Synthetic Fibers (Polyester, Nylon)
- 9.4.5. Blended Fibers
- 9.4.6. Technical Fibers (Carbon, Kevlar)
- 9.4.7. Smart Textiles (Conductive Yarns)
- 9.5. Middle East & Africa 3D Knitting Services Market Analysis, Opportunity and Forecast, By By End-Use Industry, 2016-2032
- 9.5.1. Middle East & Africa 3D Knitting Services Market Analysis by By End-Use Industry: Introduction
- 9.5.2. Market Size Absolute $ Opportunity Analysis and Forecast, By By End-Use Industry, 2016-2032
- 9.5.3. Textile and Fashion Industry
- 9.5.4. Medical and Healthcare Industry
- 9.5.5. Sports and Outdoor Industry
- 9.5.6. Automotive Industry
- 9.5.7. Aerospace Industry
- 9.6. Middle East & Africa 3D Knitting Services Market Analysis, Opportunity and Forecast, By By Technology, 2016-2032
- 9.6.1. Middle East & Africa 3D Knitting Services Market Analysis by By Technology: Introduction
- 9.6.2. Market Size Absolute $ Opportunity Analysis and Forecast, By By Technology, 2016-2032
- 9.6.3. Seamless Knitting
- 9.6.4. Whole Garment Knitting
- 9.6.5. Flat Bed Knitting
- 9.6.6. Circular Knitting
- 9.6.7. Multi-Material Knitting
- 9.7. Middle East & Africa 3D Knitting Services Market Analysis, Opportunity and Forecast, By By Service Type, 2016-2032
- 9.7.1. Middle East & Africa 3D Knitting Services Market Analysis by By Service Type: Introduction
- 9.7.2. Market Size Absolute $ Opportunity Analysis and Forecast, By By Service Type, 2016-2032
- 9.7.3. Product Design and Development
- 9.7.4. Rapid Prototyping
- 9.7.5. Customized Manufacturing
- 9.7.6. Material Sourcing and Consulting
- 9.7.7. Quality Control and Testing
- 9.8. Middle East & Africa 3D Knitting Services Market Analysis, Opportunity and Forecast, By Country , 2016-2032
- 9.8.1. Middle East & Africa 3D Knitting Services Market Analysis by Country : Introduction
- 9.8.2. Market Size Absolute $ Opportunity Analysis and Forecast, Country , 2016-2032
- 9.8.2.1. Algeria
- 9.8.2.2. Egypt
- 9.8.2.3. Israel
- 9.8.2.4. Kuwait
- 9.8.2.5. Nigeria
- 9.8.2.6. Saudi Arabia
- 9.8.2.7. South Africa
- 9.8.2.8. Turkey
- 9.8.2.9. The UAE
- 9.8.2.10. Rest of MEA
- 10. Global 3D Knitting Services Market Analysis, Opportunity and Forecast, By Region , 2016-2032
- 10.1. Global 3D Knitting Services Market Analysis by Region : Introduction
- 10.2. Market Size Absolute $ Opportunity Analysis and Forecast, By Region , 2016-2032
- 10.2.1. North America
- 10.2.2. Western Europe
- 10.2.3. Eastern Europe
- 10.2.4. APAC
- 10.2.5. Latin America
- 10.2.6. Middle East & Africa
- 11. Global 3D Knitting Services Market Competitive Landscape, Market Share Analysis, and Company Profiles
- 11.1. Market Share Analysis
- 11.2. Company Profiles
- 11.3. Shima Seiki Co., Ltd.
- 11.3.1. Company Overview
- 11.3.2. Financial Highlights
- 11.3.3. Product Portfolio
- 11.3.4. SWOT Analysis
- 11.3.5. Key Strategies and Developments
- 11.4. Stoll GmbH & Co. KG
- 11.4.1. Company Overview
- 11.4.2. Financial Highlights
- 11.4.3. Product Portfolio
- 11.4.4. SWOT Analysis
- 11.4.5. Key Strategies and Developments
- 11.5. Santoni S.p.A.
- 11.5.1. Company Overview
- 11.5.2. Financial Highlights
- 11.5.3. Product Portfolio
- 11.5.4. SWOT Analysis
- 11.5.5. Key Strategies and Developments
- 11.6. Stoll AG & Co. KG
- 11.6.1. Company Overview
- 11.6.2. Financial Highlights
- 11.6.3. Product Portfolio
- 11.6.4. SWOT Analysis
- 11.6.5. Key Strategies and Developments
- 11.7. Kern-Liebers Textile
- 11.7.1. Company Overview
- 11.7.2. Financial Highlights
- 11.7.3. Product Portfolio
- 11.7.4. SWOT Analysis
- 11.7.5. Key Strategies and Developments
- 11.8. Mayer & Cie GmbH & Co. KG
- 11.8.1. Company Overview
- 11.8.2. Financial Highlights
- 11.8.3. Product Portfolio
- 11.8.4. SWOT Analysis
- 11.8.5. Key Strategies and Developments
- 11.9. Cifra S.p.A.
- 11.9.1. Company Overview
- 11.9.2. Financial Highlights
- 11.9.3. Product Portfolio
- 11.9.4. SWOT Analysis
- 11.9.5. Key Strategies and Developments
- 11.10. Viridis Apparel
- 11.10.1. Company Overview
- 11.10.2. Financial Highlights
- 11.10.3. Product Portfolio
- 11.10.4. SWOT Analysis
- 11.10.5. Key Strategies and Developments
- 11.11. Kniterate Ltd.
- 11.11.1. Company Overview
- 11.11.2. Financial Highlights
- 11.11.3. Product Portfolio
- 11.11.4. SWOT Analysis
- 11.11.5. Key Strategies and Developments
- 11.12. Seamless Garment Technology Co., Ltd.
- 11.12.1. Company Overview
- 11.12.2. Financial Highlights
- 11.12.3. Product Portfolio
- 11.12.4. SWOT Analysis
- 11.12.5. Key Strategies and Developments
- 11.13. Sock Fancy
- 11.13.1. Company Overview
- 11.13.2. Financial Highlights
- 11.13.3. Product Portfolio
- 11.13.4. SWOT Analysis
- 11.13.5. Key Strategies and Developments
- 11.14. Unmade Ltd.
- 11.14.1. Company Overview
- 11.14.2. Financial Highlights
- 11.14.3. Product Portfolio
- 11.14.4. SWOT Analysis
- 11.14.5. Key Strategies and Developments
- 11.15. EFI Optitex
- 11.15.1. Company Overview
- 11.15.2. Financial Highlights
- 11.15.3. Product Portfolio
- 11.15.4. SWOT Analysis
- 11.15.5. Key Strategies and Developments
- 11.16. Aeoon Technologies GmbH
- 11.16.1. Company Overview
- 11.16.2. Financial Highlights
- 11.16.3. Product Portfolio
- 11.16.4. SWOT Analysis
- 11.16.5. Key Strategies and Developments
- 11.17. Sewbo Inc.
- 11.17.1. Company Overview
- 11.17.2. Financial Highlights
- 11.17.3. Product Portfolio
- 11.17.4. SWOT Analysis
- 11.17.5. Key Strategies and Developments
- 12. Assumptions and Acronyms
- 13. Research Methodology
- 14. Contact
- List of Figures
- Figure 1: Global 3D Knitting Services Market Revenue (US$ Mn) Market Share by By Application in 2022
- Figure 2: Global 3D Knitting Services Market Attractiveness Analysis by By Application, 2016-2032
- Figure 3: Global 3D Knitting Services Market Revenue (US$ Mn) Market Share by By Material Usedin 2022
- Figure 4: Global 3D Knitting Services Market Attractiveness Analysis by By Material Used, 2016-2032
- Figure 5: Global 3D Knitting Services Market Revenue (US$ Mn) Market Share by By End-Use Industryin 2022
- Figure 6: Global 3D Knitting Services Market Attractiveness Analysis by By End-Use Industry, 2016-2032
- Figure 7: Global 3D Knitting Services Market Revenue (US$ Mn) Market Share by By Technologyin 2022
- Figure 8: Global 3D Knitting Services Market Attractiveness Analysis by By Technology, 2016-2032
- Figure 9: Global 3D Knitting Services Market Revenue (US$ Mn) Market Share by By Service Typein 2022
- Figure 10: Global 3D Knitting Services Market Attractiveness Analysis by By Service Type, 2016-2032
- Figure 11: Global 3D Knitting Services Market Revenue (US$ Mn) Market Share by Region in 2022
- Figure 12: Global 3D Knitting Services Market Attractiveness Analysis by Region, 2016-2032
- Figure 13: Global 3D Knitting Services Market Revenue (US$ Mn) (2016-2032)
- Figure 14: Global 3D Knitting Services Market Revenue (US$ Mn) Comparison by Region (2016-2032)
- Figure 15: Global 3D Knitting Services Market Revenue (US$ Mn) Comparison by By Application (2016-2032)
- Figure 16: Global 3D Knitting Services Market Revenue (US$ Mn) Comparison by By Material Used (2016-2032)
- Figure 17: Global 3D Knitting Services Market Revenue (US$ Mn) Comparison by By End-Use Industry (2016-2032)
- Figure 18: Global 3D Knitting Services Market Revenue (US$ Mn) Comparison by By Technology (2016-2032)
- Figure 19: Global 3D Knitting Services Market Revenue (US$ Mn) Comparison by By Service Type (2016-2032)
- Figure 20: Global 3D Knitting Services Market Y-o-Y Growth Rate Comparison by Region (2016-2032)
- Figure 21: Global 3D Knitting Services Market Y-o-Y Growth Rate Comparison by By Application (2016-2032)
- Figure 22: Global 3D Knitting Services Market Y-o-Y Growth Rate Comparison by By Material Used (2016-2032)
- Figure 23: Global 3D Knitting Services Market Y-o-Y Growth Rate Comparison by By End-Use Industry (2016-2032)
- Figure 24: Global 3D Knitting Services Market Y-o-Y Growth Rate Comparison by By Technology (2016-2032)
- Figure 25: Global 3D Knitting Services Market Y-o-Y Growth Rate Comparison by By Service Type (2016-2032)
- Figure 26: Global 3D Knitting Services Market Share Comparison by Region (2016-2032)
- Figure 27: Global 3D Knitting Services Market Share Comparison by By Application (2016-2032)
- Figure 28: Global 3D Knitting Services Market Share Comparison by By Material Used (2016-2032)
- Figure 29: Global 3D Knitting Services Market Share Comparison by By End-Use Industry (2016-2032)
- Figure 30: Global 3D Knitting Services Market Share Comparison by By Technology (2016-2032)
- Figure 31: Global 3D Knitting Services Market Share Comparison by By Service Type (2016-2032)
- Figure 32: North America 3D Knitting Services Market Revenue (US$ Mn) Market Share by By Applicationin 2022
- Figure 33: North America 3D Knitting Services Market Attractiveness Analysis by By Application, 2016-2032
- Figure 34: North America 3D Knitting Services Market Revenue (US$ Mn) Market Share by By Material Usedin 2022
- Figure 35: North America 3D Knitting Services Market Attractiveness Analysis by By Material Used, 2016-2032
- Figure 36: North America 3D Knitting Services Market Revenue (US$ Mn) Market Share by By End-Use Industryin 2022
- Figure 37: North America 3D Knitting Services Market Attractiveness Analysis by By End-Use Industry, 2016-2032
- Figure 38: North America 3D Knitting Services Market Revenue (US$ Mn) Market Share by By Technologyin 2022
- Figure 39: North America 3D Knitting Services Market Attractiveness Analysis by By Technology, 2016-2032
- Figure 40: North America 3D Knitting Services Market Revenue (US$ Mn) Market Share by By Service Typein 2022
- Figure 41: North America 3D Knitting Services Market Attractiveness Analysis by By Service Type, 2016-2032
- Figure 42: North America 3D Knitting Services Market Revenue (US$ Mn) Market Share by Country in 2022
- Figure 43: North America 3D Knitting Services Market Attractiveness Analysis by Country, 2016-2032
- Figure 44: North America 3D Knitting Services Market Revenue (US$ Mn) (2016-2032)
- Figure 45: North America 3D Knitting Services Market Revenue (US$ Mn) Comparison by Country (2016-2032)
- Figure 46: North America 3D Knitting Services Market Revenue (US$ Mn) Comparison by By Application (2016-2032)
- Figure 47: North America 3D Knitting Services Market Revenue (US$ Mn) Comparison by By Material Used (2016-2032)
- Figure 48: North America 3D Knitting Services Market Revenue (US$ Mn) Comparison by By End-Use Industry (2016-2032)
- Figure 49: North America 3D Knitting Services Market Revenue (US$ Mn) Comparison by By Technology (2016-2032)
- Figure 50: North America 3D Knitting Services Market Revenue (US$ Mn) Comparison by By Service Type (2016-2032)
- Figure 51: North America 3D Knitting Services Market Y-o-Y Growth Rate Comparison by Country (2016-2032)
- Figure 52: North America 3D Knitting Services Market Y-o-Y Growth Rate Comparison by By Application (2016-2032)
- Figure 53: North America 3D Knitting Services Market Y-o-Y Growth Rate Comparison by By Material Used (2016-2032)
- Figure 54: North America 3D Knitting Services Market Y-o-Y Growth Rate Comparison by By End-Use Industry (2016-2032)
- Figure 55: North America 3D Knitting Services Market Y-o-Y Growth Rate Comparison by By Technology (2016-2032)
- Figure 56: North America 3D Knitting Services Market Y-o-Y Growth Rate Comparison by By Service Type (2016-2032)
- Figure 57: North America 3D Knitting Services Market Share Comparison by Country (2016-2032)
- Figure 58: North America 3D Knitting Services Market Share Comparison by By Application (2016-2032)
- Figure 59: North America 3D Knitting Services Market Share Comparison by By Material Used (2016-2032)
- Figure 60: North America 3D Knitting Services Market Share Comparison by By End-Use Industry (2016-2032)
- Figure 61: North America 3D Knitting Services Market Share Comparison by By Technology (2016-2032)
- Figure 62: North America 3D Knitting Services Market Share Comparison by By Service Type (2016-2032)
- Figure 63: Western Europe 3D Knitting Services Market Revenue (US$ Mn) Market Share by By Applicationin 2022
- Figure 64: Western Europe 3D Knitting Services Market Attractiveness Analysis by By Application, 2016-2032
- Figure 65: Western Europe 3D Knitting Services Market Revenue (US$ Mn) Market Share by By Material Usedin 2022
- Figure 66: Western Europe 3D Knitting Services Market Attractiveness Analysis by By Material Used, 2016-2032
- Figure 67: Western Europe 3D Knitting Services Market Revenue (US$ Mn) Market Share by By End-Use Industryin 2022
- Figure 68: Western Europe 3D Knitting Services Market Attractiveness Analysis by By End-Use Industry, 2016-2032
- Figure 69: Western Europe 3D Knitting Services Market Revenue (US$ Mn) Market Share by By Technologyin 2022
- Figure 70: Western Europe 3D Knitting Services Market Attractiveness Analysis by By Technology, 2016-2032
- Figure 71: Western Europe 3D Knitting Services Market Revenue (US$ Mn) Market Share by By Service Typein 2022
- Figure 72: Western Europe 3D Knitting Services Market Attractiveness Analysis by By Service Type, 2016-2032
- Figure 73: Western Europe 3D Knitting Services Market Revenue (US$ Mn) Market Share by Country in 2022
- Figure 74: Western Europe 3D Knitting Services Market Attractiveness Analysis by Country, 2016-2032
- Figure 75: Western Europe 3D Knitting Services Market Revenue (US$ Mn) (2016-2032)
- Figure 76: Western Europe 3D Knitting Services Market Revenue (US$ Mn) Comparison by Country (2016-2032)
- Figure 77: Western Europe 3D Knitting Services Market Revenue (US$ Mn) Comparison by By Application (2016-2032)
- Figure 78: Western Europe 3D Knitting Services Market Revenue (US$ Mn) Comparison by By Material Used (2016-2032)
- Figure 79: Western Europe 3D Knitting Services Market Revenue (US$ Mn) Comparison by By End-Use Industry (2016-2032)
- Figure 80: Western Europe 3D Knitting Services Market Revenue (US$ Mn) Comparison by By Technology (2016-2032)
- Figure 81: Western Europe 3D Knitting Services Market Revenue (US$ Mn) Comparison by By Service Type (2016-2032)
- Figure 82: Western Europe 3D Knitting Services Market Y-o-Y Growth Rate Comparison by Country (2016-2032)
- Figure 83: Western Europe 3D Knitting Services Market Y-o-Y Growth Rate Comparison by By Application (2016-2032)
- Figure 84: Western Europe 3D Knitting Services Market Y-o-Y Growth Rate Comparison by By Material Used (2016-2032)
- Figure 85: Western Europe 3D Knitting Services Market Y-o-Y Growth Rate Comparison by By End-Use Industry (2016-2032)
- Figure 86: Western Europe 3D Knitting Services Market Y-o-Y Growth Rate Comparison by By Technology (2016-2032)
- Figure 87: Western Europe 3D Knitting Services Market Y-o-Y Growth Rate Comparison by By Service Type (2016-2032)
- Figure 88: Western Europe 3D Knitting Services Market Share Comparison by Country (2016-2032)
- Figure 89: Western Europe 3D Knitting Services Market Share Comparison by By Application (2016-2032)
- Figure 90: Western Europe 3D Knitting Services Market Share Comparison by By Material Used (2016-2032)
- Figure 91: Western Europe 3D Knitting Services Market Share Comparison by By End-Use Industry (2016-2032)
- Figure 92: Western Europe 3D Knitting Services Market Share Comparison by By Technology (2016-2032)
- Figure 93: Western Europe 3D Knitting Services Market Share Comparison by By Service Type (2016-2032)
- Figure 94: Eastern Europe 3D Knitting Services Market Revenue (US$ Mn) Market Share by By Applicationin 2022
- Figure 95: Eastern Europe 3D Knitting Services Market Attractiveness Analysis by By Application, 2016-2032
- Figure 96: Eastern Europe 3D Knitting Services Market Revenue (US$ Mn) Market Share by By Material Usedin 2022
- Figure 97: Eastern Europe 3D Knitting Services Market Attractiveness Analysis by By Material Used, 2016-2032
- Figure 98: Eastern Europe 3D Knitting Services Market Revenue (US$ Mn) Market Share by By End-Use Industryin 2022
- Figure 99: Eastern Europe 3D Knitting Services Market Attractiveness Analysis by By End-Use Industry, 2016-2032
- Figure 100: Eastern Europe 3D Knitting Services Market Revenue (US$ Mn) Market Share by By Technologyin 2022
- Figure 101: Eastern Europe 3D Knitting Services Market Attractiveness Analysis by By Technology, 2016-2032
- Figure 102: Eastern Europe 3D Knitting Services Market Revenue (US$ Mn) Market Share by By Service Typein 2022
- Figure 103: Eastern Europe 3D Knitting Services Market Attractiveness Analysis by By Service Type, 2016-2032
- Figure 104: Eastern Europe 3D Knitting Services Market Revenue (US$ Mn) Market Share by Country in 2022
- Figure 105: Eastern Europe 3D Knitting Services Market Attractiveness Analysis by Country, 2016-2032
- Figure 106: Eastern Europe 3D Knitting Services Market Revenue (US$ Mn) (2016-2032)
- Figure 107: Eastern Europe 3D Knitting Services Market Revenue (US$ Mn) Comparison by Country (2016-2032)
- Figure 108: Eastern Europe 3D Knitting Services Market Revenue (US$ Mn) Comparison by By Application (2016-2032)
- Figure 109: Eastern Europe 3D Knitting Services Market Revenue (US$ Mn) Comparison by By Material Used (2016-2032)
- Figure 110: Eastern Europe 3D Knitting Services Market Revenue (US$ Mn) Comparison by By End-Use Industry (2016-2032)
- Figure 111: Eastern Europe 3D Knitting Services Market Revenue (US$ Mn) Comparison by By Technology (2016-2032)
- Figure 112: Eastern Europe 3D Knitting Services Market Revenue (US$ Mn) Comparison by By Service Type (2016-2032)
- Figure 113: Eastern Europe 3D Knitting Services Market Y-o-Y Growth Rate Comparison by Country (2016-2032)
- Figure 114: Eastern Europe 3D Knitting Services Market Y-o-Y Growth Rate Comparison by By Application (2016-2032)
- Figure 115: Eastern Europe 3D Knitting Services Market Y-o-Y Growth Rate Comparison by By Material Used (2016-2032)
- Figure 116: Eastern Europe 3D Knitting Services Market Y-o-Y Growth Rate Comparison by By End-Use Industry (2016-2032)
- Figure 117: Eastern Europe 3D Knitting Services Market Y-o-Y Growth Rate Comparison by By Technology (2016-2032)
- Figure 118: Eastern Europe 3D Knitting Services Market Y-o-Y Growth Rate Comparison by By Service Type (2016-2032)
- Figure 119: Eastern Europe 3D Knitting Services Market Share Comparison by Country (2016-2032)
- Figure 120: Eastern Europe 3D Knitting Services Market Share Comparison by By Application (2016-2032)
- Figure 121: Eastern Europe 3D Knitting Services Market Share Comparison by By Material Used (2016-2032)
- Figure 122: Eastern Europe 3D Knitting Services Market Share Comparison by By End-Use Industry (2016-2032)
- Figure 123: Eastern Europe 3D Knitting Services Market Share Comparison by By Technology (2016-2032)
- Figure 124: Eastern Europe 3D Knitting Services Market Share Comparison by By Service Type (2016-2032)
- Figure 125: APAC 3D Knitting Services Market Revenue (US$ Mn) Market Share by By Applicationin 2022
- Figure 126: APAC 3D Knitting Services Market Attractiveness Analysis by By Application, 2016-2032
- Figure 127: APAC 3D Knitting Services Market Revenue (US$ Mn) Market Share by By Material Usedin 2022
- Figure 128: APAC 3D Knitting Services Market Attractiveness Analysis by By Material Used, 2016-2032
- Figure 129: APAC 3D Knitting Services Market Revenue (US$ Mn) Market Share by By End-Use Industryin 2022
- Figure 130: APAC 3D Knitting Services Market Attractiveness Analysis by By End-Use Industry, 2016-2032
- Figure 131: APAC 3D Knitting Services Market Revenue (US$ Mn) Market Share by By Technologyin 2022
- Figure 132: APAC 3D Knitting Services Market Attractiveness Analysis by By Technology, 2016-2032
- Figure 133: APAC 3D Knitting Services Market Revenue (US$ Mn) Market Share by By Service Typein 2022
- Figure 134: APAC 3D Knitting Services Market Attractiveness Analysis by By Service Type, 2016-2032
- Figure 135: APAC 3D Knitting Services Market Revenue (US$ Mn) Market Share by Country in 2022
- Figure 136: APAC 3D Knitting Services Market Attractiveness Analysis by Country, 2016-2032
- Figure 137: APAC 3D Knitting Services Market Revenue (US$ Mn) (2016-2032)
- Figure 138: APAC 3D Knitting Services Market Revenue (US$ Mn) Comparison by Country (2016-2032)
- Figure 139: APAC 3D Knitting Services Market Revenue (US$ Mn) Comparison by By Application (2016-2032)
- Figure 140: APAC 3D Knitting Services Market Revenue (US$ Mn) Comparison by By Material Used (2016-2032)
- Figure 141: APAC 3D Knitting Services Market Revenue (US$ Mn) Comparison by By End-Use Industry (2016-2032)
- Figure 142: APAC 3D Knitting Services Market Revenue (US$ Mn) Comparison by By Technology (2016-2032)
- Figure 143: APAC 3D Knitting Services Market Revenue (US$ Mn) Comparison by By Service Type (2016-2032)
- Figure 144: APAC 3D Knitting Services Market Y-o-Y Growth Rate Comparison by Country (2016-2032)
- Figure 145: APAC 3D Knitting Services Market Y-o-Y Growth Rate Comparison by By Application (2016-2032)
- Figure 146: APAC 3D Knitting Services Market Y-o-Y Growth Rate Comparison by By Material Used (2016-2032)
- Figure 147: APAC 3D Knitting Services Market Y-o-Y Growth Rate Comparison by By End-Use Industry (2016-2032)
- Figure 148: APAC 3D Knitting Services Market Y-o-Y Growth Rate Comparison by By Technology (2016-2032)
- Figure 149: APAC 3D Knitting Services Market Y-o-Y Growth Rate Comparison by By Service Type (2016-2032)
- Figure 150: APAC 3D Knitting Services Market Share Comparison by Country (2016-2032)
- Figure 151: APAC 3D Knitting Services Market Share Comparison by By Application (2016-2032)
- Figure 152: APAC 3D Knitting Services Market Share Comparison by By Material Used (2016-2032)
- Figure 153: APAC 3D Knitting Services Market Share Comparison by By End-Use Industry (2016-2032)
- Figure 154: APAC 3D Knitting Services Market Share Comparison by By Technology (2016-2032)
- Figure 155: APAC 3D Knitting Services Market Share Comparison by By Service Type (2016-2032)
- Figure 156: Latin America 3D Knitting Services Market Revenue (US$ Mn) Market Share by By Applicationin 2022
- Figure 157: Latin America 3D Knitting Services Market Attractiveness Analysis by By Application, 2016-2032
- Figure 158: Latin America 3D Knitting Services Market Revenue (US$ Mn) Market Share by By Material Usedin 2022
- Figure 159: Latin America 3D Knitting Services Market Attractiveness Analysis by By Material Used, 2016-2032
- Figure 160: Latin America 3D Knitting Services Market Revenue (US$ Mn) Market Share by By End-Use Industryin 2022
- Figure 161: Latin America 3D Knitting Services Market Attractiveness Analysis by By End-Use Industry, 2016-2032
- Figure 162: Latin America 3D Knitting Services Market Revenue (US$ Mn) Market Share by By Technologyin 2022
- Figure 163: Latin America 3D Knitting Services Market Attractiveness Analysis by By Technology, 2016-2032
- Figure 164: Latin America 3D Knitting Services Market Revenue (US$ Mn) Market Share by By Service Typein 2022
- Figure 165: Latin America 3D Knitting Services Market Attractiveness Analysis by By Service Type, 2016-2032
- Figure 166: Latin America 3D Knitting Services Market Revenue (US$ Mn) Market Share by Country in 2022
- Figure 167: Latin America 3D Knitting Services Market Attractiveness Analysis by Country, 2016-2032
- Figure 168: Latin America 3D Knitting Services Market Revenue (US$ Mn) (2016-2032)
- Figure 169: Latin America 3D Knitting Services Market Revenue (US$ Mn) Comparison by Country (2016-2032)
- Figure 170: Latin America 3D Knitting Services Market Revenue (US$ Mn) Comparison by By Application (2016-2032)
- Figure 171: Latin America 3D Knitting Services Market Revenue (US$ Mn) Comparison by By Material Used (2016-2032)
- Figure 172: Latin America 3D Knitting Services Market Revenue (US$ Mn) Comparison by By End-Use Industry (2016-2032)
- Figure 173: Latin America 3D Knitting Services Market Revenue (US$ Mn) Comparison by By Technology (2016-2032)
- Figure 174: Latin America 3D Knitting Services Market Revenue (US$ Mn) Comparison by By Service Type (2016-2032)
- Figure 175: Latin America 3D Knitting Services Market Y-o-Y Growth Rate Comparison by Country (2016-2032)
- Figure 176: Latin America 3D Knitting Services Market Y-o-Y Growth Rate Comparison by By Application (2016-2032)
- Figure 177: Latin America 3D Knitting Services Market Y-o-Y Growth Rate Comparison by By Material Used (2016-2032)
- Figure 178: Latin America 3D Knitting Services Market Y-o-Y Growth Rate Comparison by By End-Use Industry (2016-2032)
- Figure 179: Latin America 3D Knitting Services Market Y-o-Y Growth Rate Comparison by By Technology (2016-2032)
- Figure 180: Latin America 3D Knitting Services Market Y-o-Y Growth Rate Comparison by By Service Type (2016-2032)
- Figure 181: Latin America 3D Knitting Services Market Share Comparison by Country (2016-2032)
- Figure 182: Latin America 3D Knitting Services Market Share Comparison by By Application (2016-2032)
- Figure 183: Latin America 3D Knitting Services Market Share Comparison by By Material Used (2016-2032)
- Figure 184: Latin America 3D Knitting Services Market Share Comparison by By End-Use Industry (2016-2032)
- Figure 185: Latin America 3D Knitting Services Market Share Comparison by By Technology (2016-2032)
- Figure 186: Latin America 3D Knitting Services Market Share Comparison by By Service Type (2016-2032)
- Figure 187: Middle East & Africa 3D Knitting Services Market Revenue (US$ Mn) Market Share by By Applicationin 2022
- Figure 188: Middle East & Africa 3D Knitting Services Market Attractiveness Analysis by By Application, 2016-2032
- Figure 189: Middle East & Africa 3D Knitting Services Market Revenue (US$ Mn) Market Share by By Material Usedin 2022
- Figure 190: Middle East & Africa 3D Knitting Services Market Attractiveness Analysis by By Material Used, 2016-2032
- Figure 191: Middle East & Africa 3D Knitting Services Market Revenue (US$ Mn) Market Share by By End-Use Industryin 2022
- Figure 192: Middle East & Africa 3D Knitting Services Market Attractiveness Analysis by By End-Use Industry, 2016-2032
- Figure 193: Middle East & Africa 3D Knitting Services Market Revenue (US$ Mn) Market Share by By Technologyin 2022
- Figure 194: Middle East & Africa 3D Knitting Services Market Attractiveness Analysis by By Technology, 2016-2032
- Figure 195: Middle East & Africa 3D Knitting Services Market Revenue (US$ Mn) Market Share by By Service Typein 2022
- Figure 196: Middle East & Africa 3D Knitting Services Market Attractiveness Analysis by By Service Type, 2016-2032
- Figure 197: Middle East & Africa 3D Knitting Services Market Revenue (US$ Mn) Market Share by Country in 2022
- Figure 198: Middle East & Africa 3D Knitting Services Market Attractiveness Analysis by Country, 2016-2032
- Figure 199: Middle East & Africa 3D Knitting Services Market Revenue (US$ Mn) (2016-2032)
- Figure 200: Middle East & Africa 3D Knitting Services Market Revenue (US$ Mn) Comparison by Country (2016-2032)
- Figure 201: Middle East & Africa 3D Knitting Services Market Revenue (US$ Mn) Comparison by By Application (2016-2032)
- Figure 202: Middle East & Africa 3D Knitting Services Market Revenue (US$ Mn) Comparison by By Material Used (2016-2032)
- Figure 203: Middle East & Africa 3D Knitting Services Market Revenue (US$ Mn) Comparison by By End-Use Industry (2016-2032)
- Figure 204: Middle East & Africa 3D Knitting Services Market Revenue (US$ Mn) Comparison by By Technology (2016-2032)
- Figure 205: Middle East & Africa 3D Knitting Services Market Revenue (US$ Mn) Comparison by By Service Type (2016-2032)
- Figure 206: Middle East & Africa 3D Knitting Services Market Y-o-Y Growth Rate Comparison by Country (2016-2032)
- Figure 207: Middle East & Africa 3D Knitting Services Market Y-o-Y Growth Rate Comparison by By Application (2016-2032)
- Figure 208: Middle East & Africa 3D Knitting Services Market Y-o-Y Growth Rate Comparison by By Material Used (2016-2032)
- Figure 209: Middle East & Africa 3D Knitting Services Market Y-o-Y Growth Rate Comparison by By End-Use Industry (2016-2032)
- Figure 210: Middle East & Africa 3D Knitting Services Market Y-o-Y Growth Rate Comparison by By Technology (2016-2032)
- Figure 211: Middle East & Africa 3D Knitting Services Market Y-o-Y Growth Rate Comparison by By Service Type (2016-2032)
- Figure 212: Middle East & Africa 3D Knitting Services Market Share Comparison by Country (2016-2032)
- Figure 213: Middle East & Africa 3D Knitting Services Market Share Comparison by By Application (2016-2032)
- Figure 214: Middle East & Africa 3D Knitting Services Market Share Comparison by By Material Used (2016-2032)
- Figure 215: Middle East & Africa 3D Knitting Services Market Share Comparison by By End-Use Industry (2016-2032)
- Figure 216: Middle East & Africa 3D Knitting Services Market Share Comparison by By Technology (2016-2032)
- Figure 217: Middle East & Africa 3D Knitting Services Market Share Comparison by By Service Type (2016-2032)
- List of Tables
- Table 1: Global 3D Knitting Services Market Comparison by By Application (2016-2032)
- Table 2: Global 3D Knitting Services Market Comparison by By Material Used (2016-2032)
- Table 3: Global 3D Knitting Services Market Comparison by By End-Use Industry (2016-2032)
- Table 4: Global 3D Knitting Services Market Comparison by By Technology (2016-2032)
- Table 5: Global 3D Knitting Services Market Comparison by By Service Type (2016-2032)
- Table 6: Global 3D Knitting Services Market Revenue (US$ Mn) Comparison by Region (2016-2032)
- Table 7: Global 3D Knitting Services Market Revenue (US$ Mn) (2016-2032)
- Table 8: Global 3D Knitting Services Market Revenue (US$ Mn) Comparison by Region (2016-2032)
- Table 9: Global 3D Knitting Services Market Revenue (US$ Mn) Comparison by By Application (2016-2032)
- Table 10: Global 3D Knitting Services Market Revenue (US$ Mn) Comparison by By Material Used (2016-2032)
- Table 11: Global 3D Knitting Services Market Revenue (US$ Mn) Comparison by By End-Use Industry (2016-2032)
- Table 12: Global 3D Knitting Services Market Revenue (US$ Mn) Comparison by By Technology (2016-2032)
- Table 13: Global 3D Knitting Services Market Revenue (US$ Mn) Comparison by By Service Type (2016-2032)
- Table 14: Global 3D Knitting Services Market Y-o-Y Growth Rate Comparison by Region (2016-2032)
- Table 15: Global 3D Knitting Services Market Y-o-Y Growth Rate Comparison by By Application (2016-2032)
- Table 16: Global 3D Knitting Services Market Y-o-Y Growth Rate Comparison by By Material Used (2016-2032)
- Table 17: Global 3D Knitting Services Market Y-o-Y Growth Rate Comparison by By End-Use Industry (2016-2032)
- Table 18: Global 3D Knitting Services Market Y-o-Y Growth Rate Comparison by By Technology (2016-2032)
- Table 19: Global 3D Knitting Services Market Y-o-Y Growth Rate Comparison by By Service Type (2016-2032)
- Table 20: Global 3D Knitting Services Market Share Comparison by Region (2016-2032)
- Table 21: Global 3D Knitting Services Market Share Comparison by By Application (2016-2032)
- Table 22: Global 3D Knitting Services Market Share Comparison by By Material Used (2016-2032)
- Table 23: Global 3D Knitting Services Market Share Comparison by By End-Use Industry (2016-2032)
- Table 24: Global 3D Knitting Services Market Share Comparison by By Technology (2016-2032)
- Table 25: Global 3D Knitting Services Market Share Comparison by By Service Type (2016-2032)
- Table 26: North America 3D Knitting Services Market Comparison by By Material Used (2016-2032)
- Table 27: North America 3D Knitting Services Market Comparison by By End-Use Industry (2016-2032)
- Table 28: North America 3D Knitting Services Market Comparison by By Technology (2016-2032)
- Table 29: North America 3D Knitting Services Market Comparison by By Service Type (2016-2032)
- Table 30: North America 3D Knitting Services Market Revenue (US$ Mn) Comparison by Country (2016-2032)
- Table 31: North America 3D Knitting Services Market Revenue (US$ Mn) (2016-2032)
- Table 32: North America 3D Knitting Services Market Revenue (US$ Mn) Comparison by Country (2016-2032)
- Table 33: North America 3D Knitting Services Market Revenue (US$ Mn) Comparison by By Application (2016-2032)
- Table 34: North America 3D Knitting Services Market Revenue (US$ Mn) Comparison by By Material Used (2016-2032)
- Table 35: North America 3D Knitting Services Market Revenue (US$ Mn) Comparison by By End-Use Industry (2016-2032)
- Table 36: North America 3D Knitting Services Market Revenue (US$ Mn) Comparison by By Technology (2016-2032)
- Table 37: North America 3D Knitting Services Market Revenue (US$ Mn) Comparison by By Service Type (2016-2032)
- Table 38: North America 3D Knitting Services Market Y-o-Y Growth Rate Comparison by Country (2016-2032)
- Table 39: North America 3D Knitting Services Market Y-o-Y Growth Rate Comparison by By Application (2016-2032)
- Table 40: North America 3D Knitting Services Market Y-o-Y Growth Rate Comparison by By Material Used (2016-2032)
- Table 41: North America 3D Knitting Services Market Y-o-Y Growth Rate Comparison by By End-Use Industry (2016-2032)
- Table 42: North America 3D Knitting Services Market Y-o-Y Growth Rate Comparison by By Technology (2016-2032)
- Table 43: North America 3D Knitting Services Market Y-o-Y Growth Rate Comparison by By Service Type (2016-2032)
- Table 44: North America 3D Knitting Services Market Share Comparison by Country (2016-2032)
- Table 45: North America 3D Knitting Services Market Share Comparison by By Application (2016-2032)
- Table 46: North America 3D Knitting Services Market Share Comparison by By Material Used (2016-2032)
- Table 47: North America 3D Knitting Services Market Share Comparison by By End-Use Industry (2016-2032)
- Table 48: North America 3D Knitting Services Market Share Comparison by By Technology (2016-2032)
- Table 49: North America 3D Knitting Services Market Share Comparison by By Service Type (2016-2032)
- Table 50: Western Europe 3D Knitting Services Market Comparison by By Application (2016-2032)
- Table 51: Western Europe 3D Knitting Services Market Comparison by By Material Used (2016-2032)
- Table 52: Western Europe 3D Knitting Services Market Comparison by By End-Use Industry (2016-2032)
- Table 53: Western Europe 3D Knitting Services Market Comparison by By Technology (2016-2032)
- Table 54: Western Europe 3D Knitting Services Market Comparison by By Service Type (2016-2032)
- Table 55: Western Europe 3D Knitting Services Market Revenue (US$ Mn) Comparison by Country (2016-2032)
- Table 56: Western Europe 3D Knitting Services Market Revenue (US$ Mn) (2016-2032)
- Table 57: Western Europe 3D Knitting Services Market Revenue (US$ Mn) Comparison by Country (2016-2032)
- Table 58: Western Europe 3D Knitting Services Market Revenue (US$ Mn) Comparison by By Application (2016-2032)
- Table 59: Western Europe 3D Knitting Services Market Revenue (US$ Mn) Comparison by By Material Used (2016-2032)
- Table 60: Western Europe 3D Knitting Services Market Revenue (US$ Mn) Comparison by By End-Use Industry (2016-2032)
- Table 61: Western Europe 3D Knitting Services Market Revenue (US$ Mn) Comparison by By Technology (2016-2032)
- Table 62: Western Europe 3D Knitting Services Market Revenue (US$ Mn) Comparison by By Service Type (2016-2032)
- Table 63: Western Europe 3D Knitting Services Market Y-o-Y Growth Rate Comparison by Country (2016-2032)
- Table 64: Western Europe 3D Knitting Services Market Y-o-Y Growth Rate Comparison by By Application (2016-2032)
- Table 65: Western Europe 3D Knitting Services Market Y-o-Y Growth Rate Comparison by By Material Used (2016-2032)
- Table 66: Western Europe 3D Knitting Services Market Y-o-Y Growth Rate Comparison by By End-Use Industry (2016-2032)
- Table 67: Western Europe 3D Knitting Services Market Y-o-Y Growth Rate Comparison by By Technology (2016-2032)
- Table 68: Western Europe 3D Knitting Services Market Y-o-Y Growth Rate Comparison by By Service Type (2016-2032)
- Table 69: Western Europe 3D Knitting Services Market Share Comparison by Country (2016-2032)
- Table 70: Western Europe 3D Knitting Services Market Share Comparison by By Application (2016-2032)
- Table 71: Western Europe 3D Knitting Services Market Share Comparison by By Material Used (2016-2032)
- Table 72: Western Europe 3D Knitting Services Market Share Comparison by By End-Use Industry (2016-2032)
- Table 73: Western Europe 3D Knitting Services Market Share Comparison by By Technology (2016-2032)
- Table 74: Western Europe 3D Knitting Services Market Share Comparison by By Service Type (2016-2032)
- Table 75: Eastern Europe 3D Knitting Services Market Comparison by By Application (2016-2032)
- Table 76: Eastern Europe 3D Knitting Services Market Comparison by By Material Used (2016-2032)
- Table 77: Eastern Europe 3D Knitting Services Market Comparison by By End-Use Industry (2016-2032)
- Table 78: Eastern Europe 3D Knitting Services Market Comparison by By Technology (2016-2032)
- Table 79: Eastern Europe 3D Knitting Services Market Comparison by By Service Type (2016-2032)
- Table 80: Eastern Europe 3D Knitting Services Market Revenue (US$ Mn) Comparison by Country (2016-2032)
- Table 81: Eastern Europe 3D Knitting Services Market Revenue (US$ Mn) (2016-2032)
- Table 82: Eastern Europe 3D Knitting Services Market Revenue (US$ Mn) Comparison by Country (2016-2032)
- Table 83: Eastern Europe 3D Knitting Services Market Revenue (US$ Mn) Comparison by By Application (2016-2032)
- Table 84: Eastern Europe 3D Knitting Services Market Revenue (US$ Mn) Comparison by By Material Used (2016-2032)
- Table 85: Eastern Europe 3D Knitting Services Market Revenue (US$ Mn) Comparison by By End-Use Industry (2016-2032)
- Table 86: Eastern Europe 3D Knitting Services Market Revenue (US$ Mn) Comparison by By Technology (2016-2032)
- Table 87: Eastern Europe 3D Knitting Services Market Revenue (US$ Mn) Comparison by By Service Type (2016-2032)
- Table 88: Eastern Europe 3D Knitting Services Market Y-o-Y Growth Rate Comparison by Country (2016-2032)
- Table 89: Eastern Europe 3D Knitting Services Market Y-o-Y Growth Rate Comparison by By Application (2016-2032)
- Table 90: Eastern Europe 3D Knitting Services Market Y-o-Y Growth Rate Comparison by By Material Used (2016-2032)
- Table 91: Eastern Europe 3D Knitting Services Market Y-o-Y Growth Rate Comparison by By End-Use Industry (2016-2032)
- Table 92: Eastern Europe 3D Knitting Services Market Y-o-Y Growth Rate Comparison by By Technology (2016-2032)
- Table 93: Eastern Europe 3D Knitting Services Market Y-o-Y Growth Rate Comparison by By Service Type (2016-2032)
- Table 94: Eastern Europe 3D Knitting Services Market Share Comparison by Country (2016-2032)
- Table 95: Eastern Europe 3D Knitting Services Market Share Comparison by By Application (2016-2032)
- Table 96: Eastern Europe 3D Knitting Services Market Share Comparison by By Material Used (2016-2032)
- Table 97: Eastern Europe 3D Knitting Services Market Share Comparison by By End-Use Industry (2016-2032)
- Table 98: Eastern Europe 3D Knitting Services Market Share Comparison by By Technology (2016-2032)
- Table 99: Eastern Europe 3D Knitting Services Market Share Comparison by By Service Type (2016-2032)
- Table 100: APAC 3D Knitting Services Market Comparison by By Application (2016-2032)
- Table 101: APAC 3D Knitting Services Market Comparison by By Material Used (2016-2032)
- Table 102: APAC 3D Knitting Services Market Comparison by By End-Use Industry (2016-2032)
- Table 103: APAC 3D Knitting Services Market Comparison by By Technology (2016-2032)
- Table 104: APAC 3D Knitting Services Market Comparison by By Service Type (2016-2032)
- Table 105: APAC 3D Knitting Services Market Revenue (US$ Mn) Comparison by Country (2016-2032)
- Table 106: APAC 3D Knitting Services Market Revenue (US$ Mn) (2016-2032)
- Table 107: APAC 3D Knitting Services Market Revenue (US$ Mn) Comparison by Country (2016-2032)
- Table 108: APAC 3D Knitting Services Market Revenue (US$ Mn) Comparison by By Application (2016-2032)
- Table 109: APAC 3D Knitting Services Market Revenue (US$ Mn) Comparison by By Material Used (2016-2032)
- Table 110: APAC 3D Knitting Services Market Revenue (US$ Mn) Comparison by By End-Use Industry (2016-2032)
- Table 111: APAC 3D Knitting Services Market Revenue (US$ Mn) Comparison by By Technology (2016-2032)
- Table 112: APAC 3D Knitting Services Market Revenue (US$ Mn) Comparison by By Service Type (2016-2032)
- Table 113: APAC 3D Knitting Services Market Y-o-Y Growth Rate Comparison by Country (2016-2032)
- Table 114: APAC 3D Knitting Services Market Y-o-Y Growth Rate Comparison by By Application (2016-2032)
- Table 115: APAC 3D Knitting Services Market Y-o-Y Growth Rate Comparison by By Material Used (2016-2032)
- Table 116: APAC 3D Knitting Services Market Y-o-Y Growth Rate Comparison by By End-Use Industry (2016-2032)
- Table 117: APAC 3D Knitting Services Market Y-o-Y Growth Rate Comparison by By Technology (2016-2032)
- Table 118: APAC 3D Knitting Services Market Y-o-Y Growth Rate Comparison by By Service Type (2016-2032)
- Table 119: APAC 3D Knitting Services Market Share Comparison by Country (2016-2032)
- Table 120: APAC 3D Knitting Services Market Share Comparison by By Application (2016-2032)
- Table 121: APAC 3D Knitting Services Market Share Comparison by By Material Used (2016-2032)
- Table 122: APAC 3D Knitting Services Market Share Comparison by By End-Use Industry (2016-2032)
- Table 123: APAC 3D Knitting Services Market Share Comparison by By Technology (2016-2032)
- Table 124: APAC 3D Knitting Services Market Share Comparison by By Service Type (2016-2032)
- Table 125: Latin America 3D Knitting Services Market Comparison by By Application (2016-2032)
- Table 126: Latin America 3D Knitting Services Market Comparison by By Material Used (2016-2032)
- Table 127: Latin America 3D Knitting Services Market Comparison by By End-Use Industry (2016-2032)
- Table 128: Latin America 3D Knitting Services Market Comparison by By Technology (2016-2032)
- Table 129: Latin America 3D Knitting Services Market Comparison by By Service Type (2016-2032)
- Table 130: Latin America 3D Knitting Services Market Revenue (US$ Mn) Comparison by Country (2016-2032)
- Table 131: Latin America 3D Knitting Services Market Revenue (US$ Mn) (2016-2032)
- Table 132: Latin America 3D Knitting Services Market Revenue (US$ Mn) Comparison by Country (2016-2032)
- Table 133: Latin America 3D Knitting Services Market Revenue (US$ Mn) Comparison by By Application (2016-2032)
- Table 134: Latin America 3D Knitting Services Market Revenue (US$ Mn) Comparison by By Material Used (2016-2032)
- Table 135: Latin America 3D Knitting Services Market Revenue (US$ Mn) Comparison by By End-Use Industry (2016-2032)
- Table 136: Latin America 3D Knitting Services Market Revenue (US$ Mn) Comparison by By Technology (2016-2032)
- Table 137: Latin America 3D Knitting Services Market Revenue (US$ Mn) Comparison by By Service Type (2016-2032)
- Table 138: Latin America 3D Knitting Services Market Y-o-Y Growth Rate Comparison by Country (2016-2032)
- Table 139: Latin America 3D Knitting Services Market Y-o-Y Growth Rate Comparison by By Application (2016-2032)
- Table 140: Latin America 3D Knitting Services Market Y-o-Y Growth Rate Comparison by By Material Used (2016-2032)
- Table 141: Latin America 3D Knitting Services Market Y-o-Y Growth Rate Comparison by By End-Use Industry (2016-2032)
- Table 142: Latin America 3D Knitting Services Market Y-o-Y Growth Rate Comparison by By Technology (2016-2032)
- Table 143: Latin America 3D Knitting Services Market Y-o-Y Growth Rate Comparison by By Service Type (2016-2032)
- Table 144: Latin America 3D Knitting Services Market Share Comparison by Country (2016-2032)
- Table 145: Latin America 3D Knitting Services Market Share Comparison by By Application (2016-2032)
- Table 146: Latin America 3D Knitting Services Market Share Comparison by By Material Used (2016-2032)
- Table 147: Latin America 3D Knitting Services Market Share Comparison by By End-Use Industry (2016-2032)
- Table 148: Latin America 3D Knitting Services Market Share Comparison by By Technology (2016-2032)
- Table 149: Latin America 3D Knitting Services Market Share Comparison by By Service Type (2016-2032)
- Table 150: Middle East & Africa 3D Knitting Services Market Comparison by By Application (2016-2032)
- Table 151: Middle East & Africa 3D Knitting Services Market Comparison by By Material Used (2016-2032)
- Table 152: Middle East & Africa 3D Knitting Services Market Comparison by By End-Use Industry (2016-2032)
- Table 153: Middle East & Africa 3D Knitting Services Market Comparison by By Technology (2016-2032)
- Table 154: Middle East & Africa 3D Knitting Services Market Comparison by By Service Type (2016-2032)
- Table 155: Middle East & Africa 3D Knitting Services Market Revenue (US$ Mn) Comparison by Country (2016-2032)
- Table 156: Middle East & Africa 3D Knitting Services Market Revenue (US$ Mn) (2016-2032)
- Table 157: Middle East & Africa 3D Knitting Services Market Revenue (US$ Mn) Comparison by Country (2016-2032)
- Table 158: Middle East & Africa 3D Knitting Services Market Revenue (US$ Mn) Comparison by By Application (2016-2032)
- Table 159: Middle East & Africa 3D Knitting Services Market Revenue (US$ Mn) Comparison by By Material Used (2016-2032)
- Table 160: Middle East & Africa 3D Knitting Services Market Revenue (US$ Mn) Comparison by By End-Use Industry (2016-2032)
- Table 161: Middle East & Africa 3D Knitting Services Market Revenue (US$ Mn) Comparison by By Technology (2016-2032)
- Table 162: Middle East & Africa 3D Knitting Services Market Revenue (US$ Mn) Comparison by By Service Type (2016-2032)
- Table 163: Middle East & Africa 3D Knitting Services Market Y-o-Y Growth Rate Comparison by Country (2016-2032)
- Table 164: Middle East & Africa 3D Knitting Services Market Y-o-Y Growth Rate Comparison by By Application (2016-2032)
- Table 165: Middle East & Africa 3D Knitting Services Market Y-o-Y Growth Rate Comparison by By Material Used (2016-2032)
- Table 166: Middle East & Africa 3D Knitting Services Market Y-o-Y Growth Rate Comparison by By End-Use Industry (2016-2032)
- Table 167: Middle East & Africa 3D Knitting Services Market Y-o-Y Growth Rate Comparison by By Technology (2016-2032)
- Table 168: Middle East & Africa 3D Knitting Services Market Y-o-Y Growth Rate Comparison by By Service Type (2016-2032)
- Table 169: Middle East & Africa 3D Knitting Services Market Share Comparison by Country (2016-2032)
- Table 170: Middle East & Africa 3D Knitting Services Market Share Comparison by By Application (2016-2032)
- Table 171: Middle East & Africa 3D Knitting Services Market Share Comparison by By Material Used (2016-2032)
- Table 172: Middle East & Africa 3D Knitting Services Market Share Comparison by By End-Use Industry (2016-2032)
- Table 173: Middle East & Africa 3D Knitting Services Market Share Comparison by By Technology (2016-2032)
- Table 174: Middle East & Africa 3D Knitting Services Market Share Comparison by By Service Type (2016-2032)
- 1. Executive Summary
-
- Shima Seiki Co., Ltd.
- Stoll GmbH & Co. KG
- Santoni S.p.A.
- Stoll AG & Co. KG
- Kern-Liebers Textile
- Mayer & Cie GmbH & Co. KG
- Cifra S.p.A.
- Viridis Apparel
- Kniterate Ltd.
- Seamless Garment Technology Co., Ltd.
- Sock Fancy
- Unmade Ltd.
- EFI Optitex
- Aeoon Technologies GmbH
- Sewbo Inc.
Our Clients


View Our Licence Options
